


0
US Dollar Index
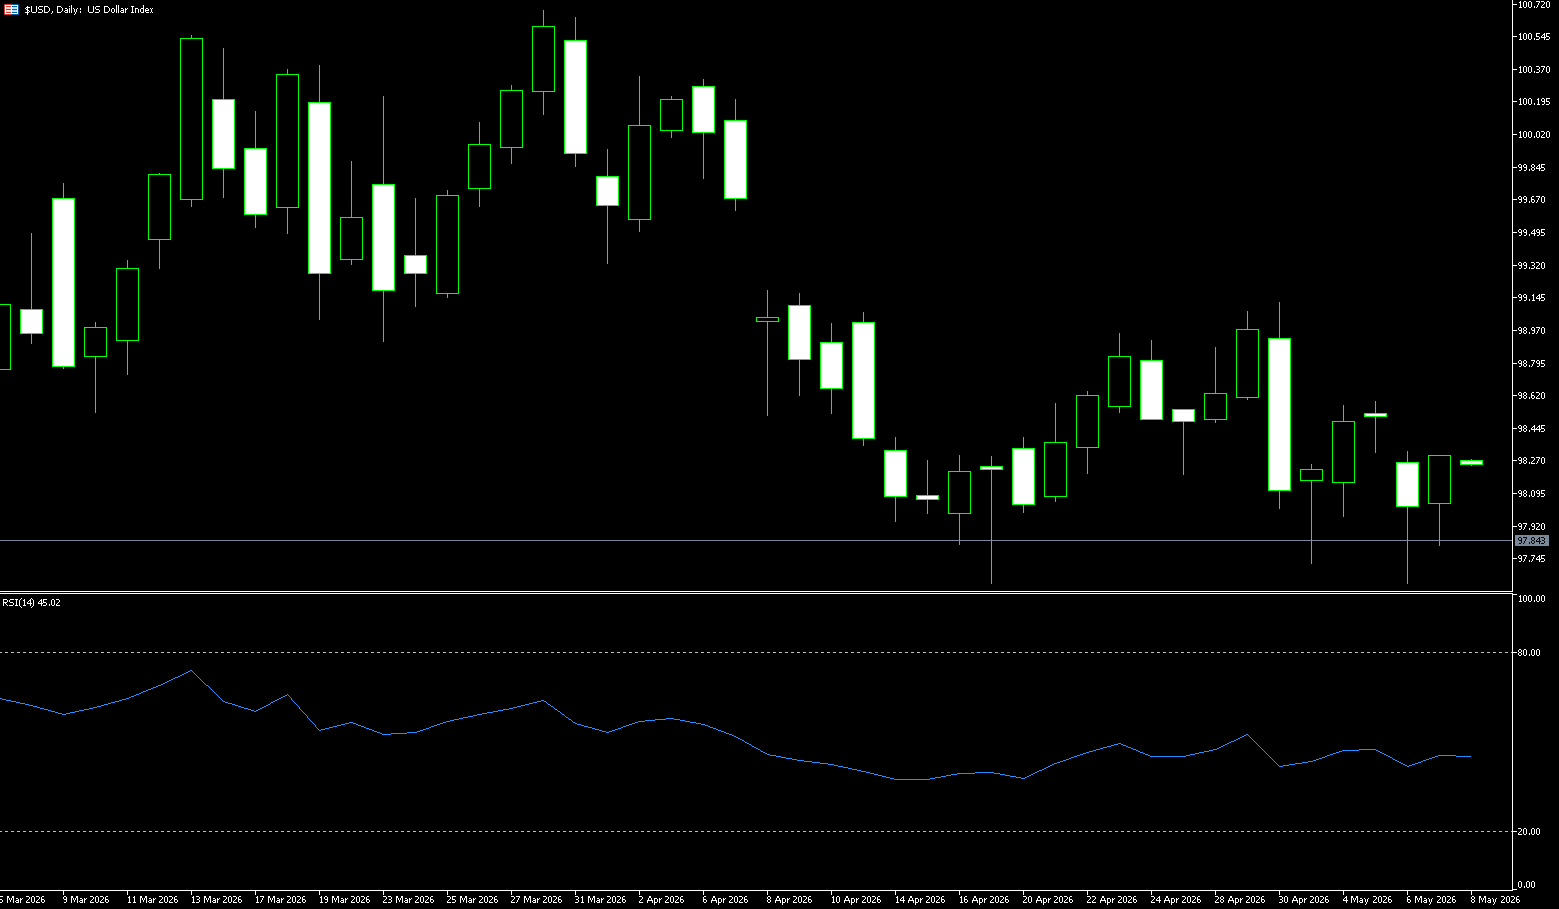
The US dollar index remained around 99.1 on Wednesday, retreating to its early April high reached earlier in the previous session, as market optimism rose that a deal between the US and Iran might be reached soon. According to the White House Pond Report, President Trump stated that negotiations with Iran had entered the final stage, pushing oil prices down for the second consecutive trading day. Despite this, crude oil prices remain nearly 50% higher than pre-war levels. Investors remain concerned that high energy costs could exacerbate inflationary pressures and potentially force central banks to further tighten monetary policy. The minutes of the Federal Open Market Committee (FOMC) April meeting showed that most policymakers believed further interest rate hikes might be necessary if inflation persists above the Fed's 2% target. The market widely expects the Fed to keep interest rates unchanged for the remainder of the year, although traders currently see about a 50% probability of a December rate hike.
US Treasury yields continued to weaken, driven by safe-haven selling, with yields rising across the board. The yield on 30-year Treasury bonds rose on the day, briefly touching 5.197% intraday, the highest level since July 2007. The yield on 10-year Treasury bonds reached a high of 4.682%, a new high since January 2025. This supports the continued strength of the US dollar index. Since rebounding from a double bottom near 97.62 in early May, the US dollar index has continued to rise, reaching a high of 99.43, and is currently trading at 99.30, in a high-level consolidation phase. Technically, the psychological level of 99.00 provides immediate support, while the 200-day moving average at 98.55 constitutes short-term resistance. The MACD indicator shows that the DIFF and DEA are above the zero axis, but the histogram has slightly turned green to -0.0438, indicating that short-term upward momentum has weakened and there is a need for a pullback from the high level, but the medium-term upward trend has not yet been broken. Based on a combination of technical and fundamental factors, the US dollar index is expected to remain range-bound between 99.00 and 99.50 over the next 2-3 days, with 99.43 (this week's high) as the first target. A break above this level could lead to a test of the 100 level in the short term.
Today, consider shorting the US dollar index at 99.20, with a stop-loss at 99.30 and targets at 98.70 and 98.60.
WTI Crude Oil
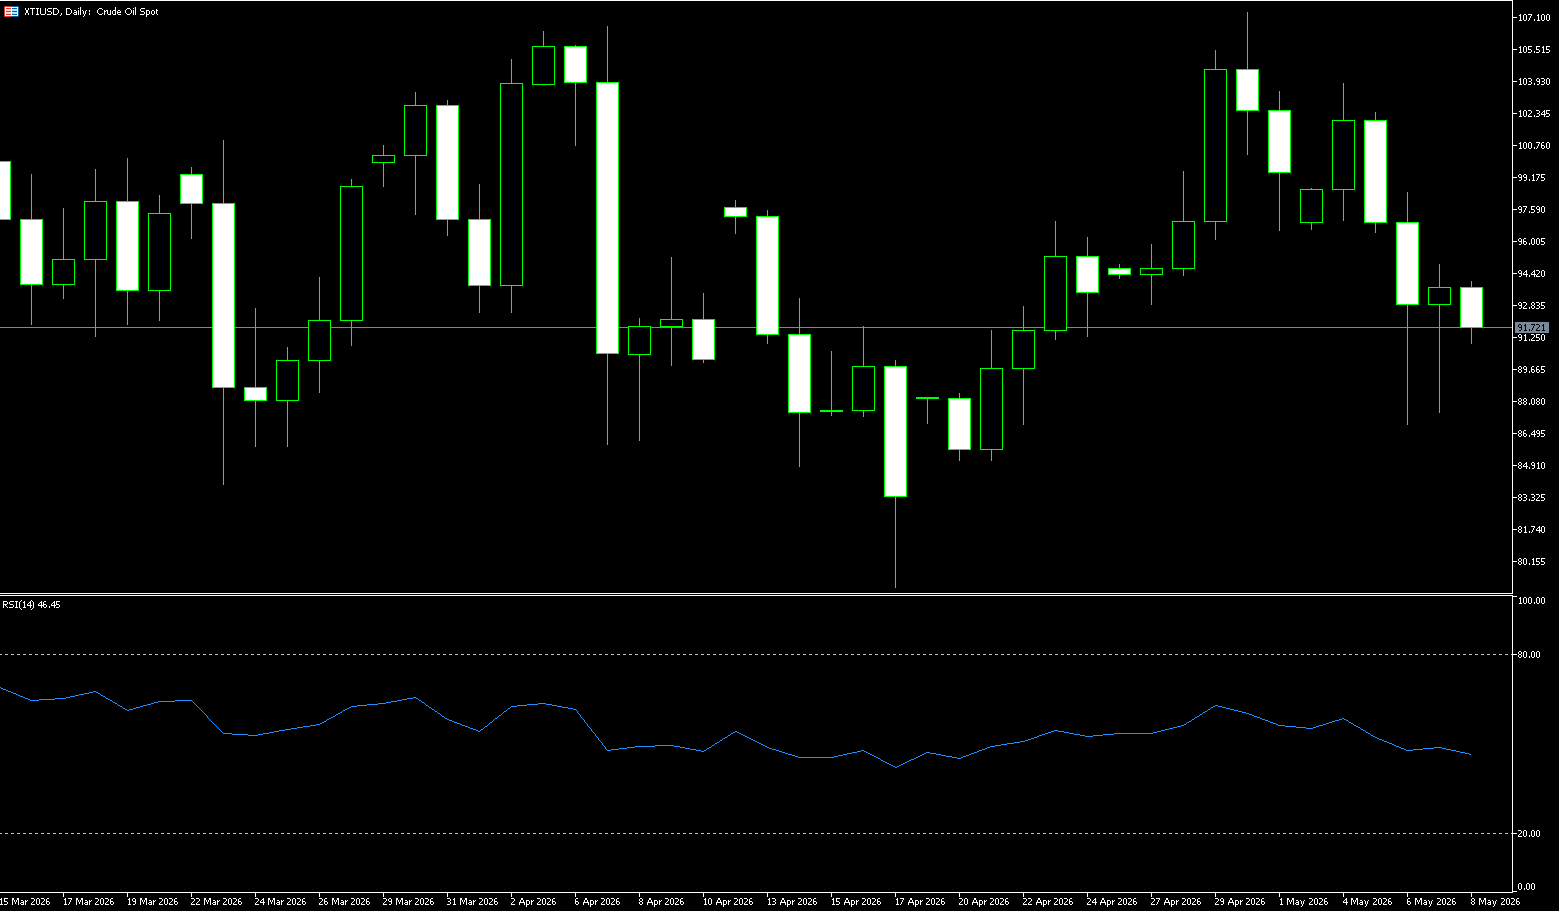
WTI crude oil fell more than 5% for the second consecutive trading day on Wednesday, breaking below the $100 mark to 98.30, as the market pinned renewed hopes on a gradual recovery in Middle Eastern supplies. US President Trump stated that negotiations between the US and Iran have entered the final stage, supporting earlier statements that Tehran could quickly end the war. An agreement could end the two countries' maritime blockade of the Strait of Hormuz, which has suspended tanker traffic since March. Satellite data showing three supertankers transiting the strait has further boosted optimism about supply, potentially reflecting a relaxation of traffic controls. The Persian Gulf typically supplies economies with about 20 million barrels of oil per day, while war-induced price surges reached a high of $120 per barrel in March. Crude oil inventories declined for the fourth consecutive week, with the U.S. Strategic Petroleum Reserve decreasing by 10 million barrels, a 6.6% year-over-year drop.
From a technical perspective, WTI crude oil's daily chart structure remains clearly strong. Current oil prices are firmly trading above the 9-day (98.87) and 50-day (95.47) simple moving averages, with the 50-day simple moving average area having become a key support zone for the bullish trend since April. The price is currently poised to re-enter the $104-$105 range, indicating that the overall upward trend remains intact. The daily stochastic oscillator has turned upward from neutral territory, suggesting renewed bullish momentum and further upside potential. Short-term resistance is concentrated around $108, corresponding to the highs of April and May. If geopolitical tensions continue to deteriorate, the market may further test the year-to-date high near $113.
Consider going long on crude oil today at $98.15, with a stop-loss at $98.00 and targets of $100.00 and $101.00.
Spot Gold
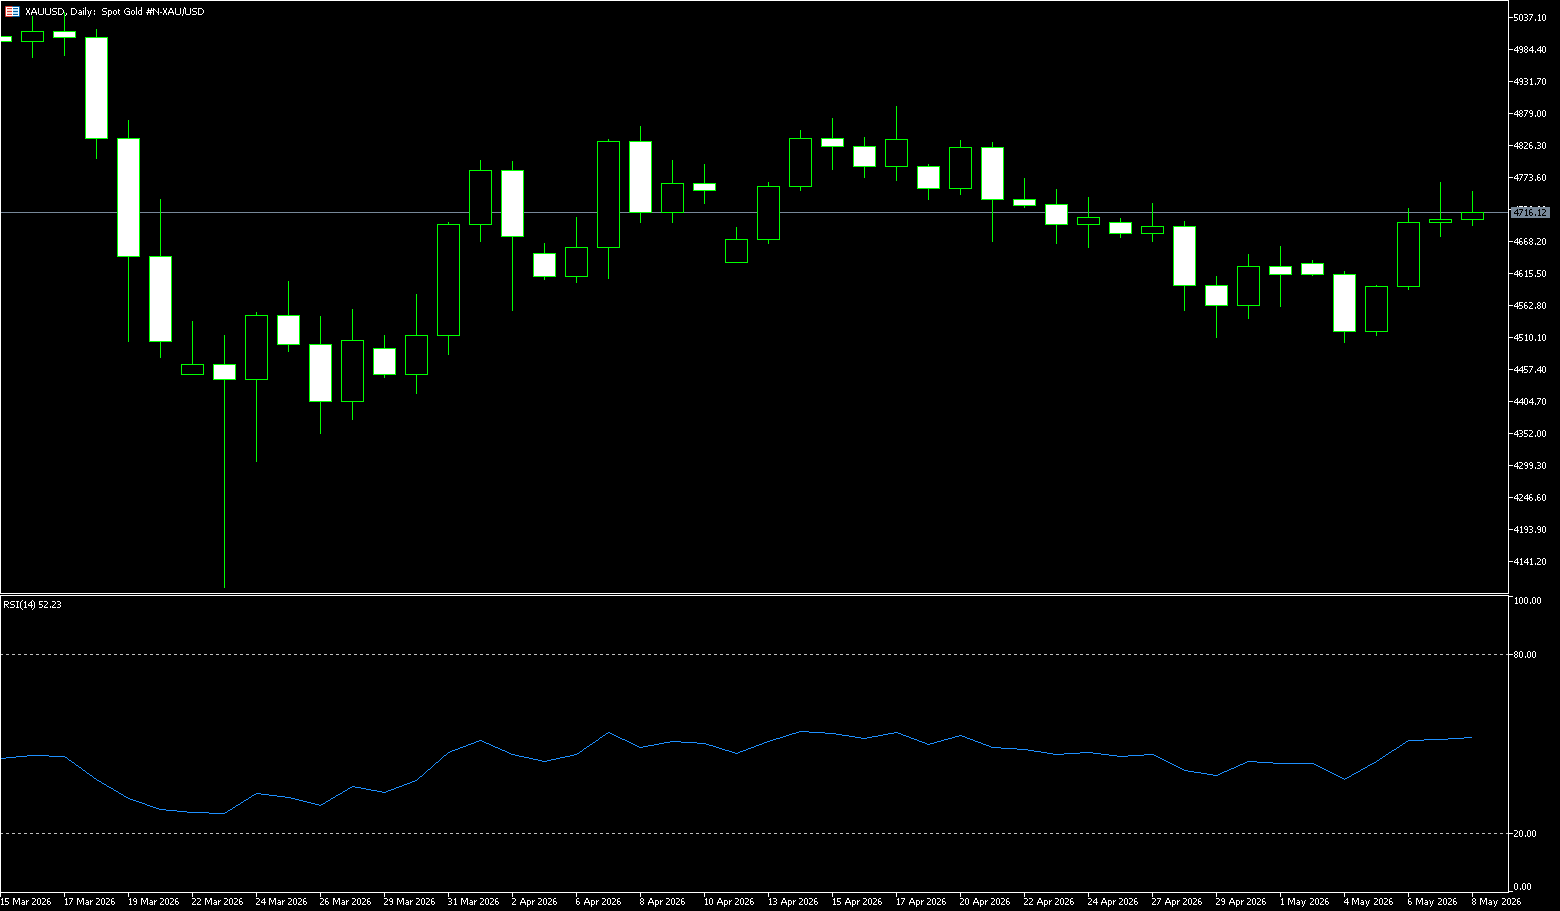
Gold prices rebounded above $4,500 per ounce on Wednesday, after falling nearly 2% in the previous session. Escalating tensions between the US and Iran have investors focused on inflation risks and the prospect of higher interest rates. President Trump warned that the US could resume strikes against Iran "within two or three days" if Tehran fails to agree to Washington's peace terms. This statement came shortly after Trump said a planned attack had been canceled due to appeals from Gulf allies, with Tehran's nuclear program being a major obstacle in negotiations. The protracted conflict has effectively closed the Strait of Hormuz to shipping, pushing up oil prices and exacerbating inflationary pressures. Accelerating US inflation has also prompted traders to further lower their expectations for a Fed rate cut this year, while reinforcing market speculation that central banks may still raise rates before the end of the year.
In summary, this round of gold price declines is the result of a confluence of three factors: expectations of macroeconomic tightening, the transmission of inflation from geopolitical conflicts, and a strong US dollar. On the daily chart, although gold prices are trading above $4,500, they maintain a short-term bearish pattern as they remain below several key moving averages. The 20-day moving average is around $4,623, and the 50-day simple moving average is around $4,689, both significantly higher than the spot price, reinforcing the supply pressure zone, while the 100-day SMA is around $4,793, further limiting broader upside potential. The Relative Strength Index (RSI) (14) hovers in the mid-30 range, suggesting continued downward pressure, even though prices are slightly above the longer-term 200-day simple moving average, which only slightly eases the bearish bias. On the downside, the short-term focus is on the psychological level of $4,400 (a descending wedge resistance turned support), while stronger structural support lies near the 200-day moving average at $4,363. A clear break below this support would open the door to a continued downtrend.
Consider going long on gold today at $4,538, with a stop-loss at $4,533 and targets at $4,580 and $4,590.
AUD/USD
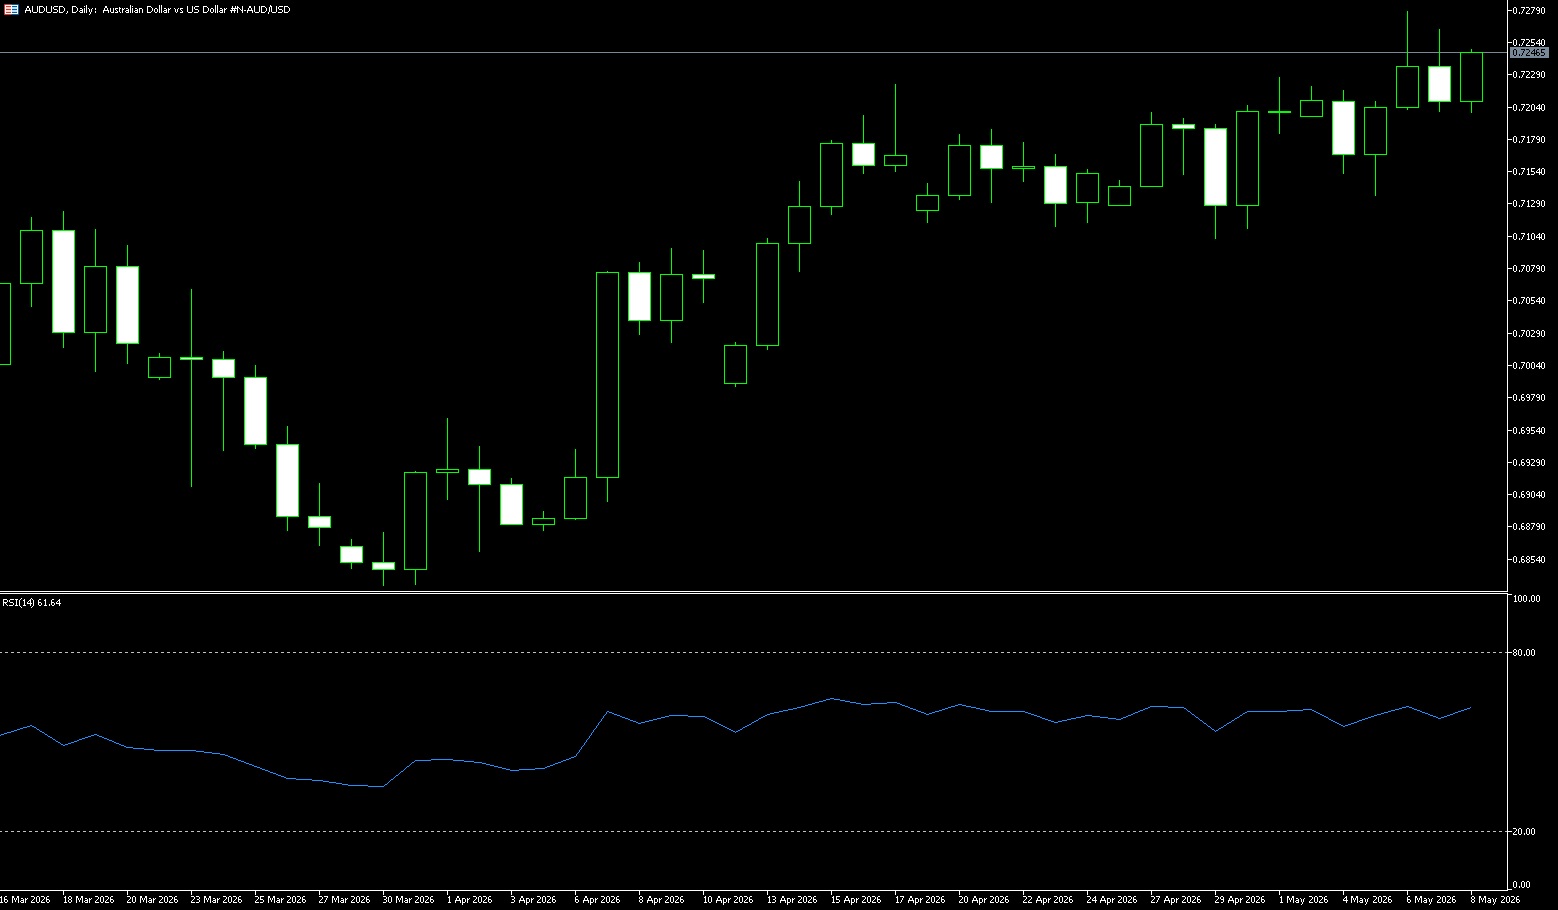
On Wednesday, the AUD/USD pair rose near the 0.7150 area as the US dollar (USD) continued to strengthen, driven by optimistic US labor market data released on Tuesday. Traders are now turning their attention to the upcoming Australian employment report. The latest ADP employment report showed that US private sector employers added an average of 42,250 jobs over four weeks, reinforcing market expectations that the Federal Reserve (Fed) may maintain a cautious interest rate policy. Strong labor market data boosted US Treasury yields and broadly supported a stronger dollar. Investors are now closely watching the Australian April employment change report due on Thursday. The market expects employment to increase by approximately 17,500, with the unemployment rate projected to remain at 4.3%. Stronger-than-expected labor market data could further reinforce expectations that the Reserve Bank of Australia (RBA) will maintain higher interest rates for an extended period.
From a technical perspective, the AUD/USD pair is holding near the 100-period exponential moving average (0.7143) on the 4-hour chart and below the 23.6% Fibonacci retracement level of the March-May upward move. Furthermore, the Relative Strength Index (RSI) (14) is hovering near the oversold zone of 30.56, suggesting continued downward pressure. Meanwhile, the Moving Average Convergence Divergence (MACD) indicator remains slightly negative and stabilizing, indicating that bearish momentum exists but has not accelerated. Therefore, any further declines may find initial support near the 50.0% Fibonacci retracement level of 0.7056, and if the bearish trend continues, it will face tests at the 61.8% retracement level of approximately 0.7004 and the psychological level of 0.7000. On the upside, the rebound first needs to break through the 100-period exponential moving average (0.7143) on the 4-hour chart; followed by the 23.6% Fibonacci retracement level at 0.7173, and the 0.7200 area.
Consider going long on the Australian dollar today at 0.7140, with a stop loss at 0.7130 and targets at 0.7200 and 0.7190.
GBP/USD
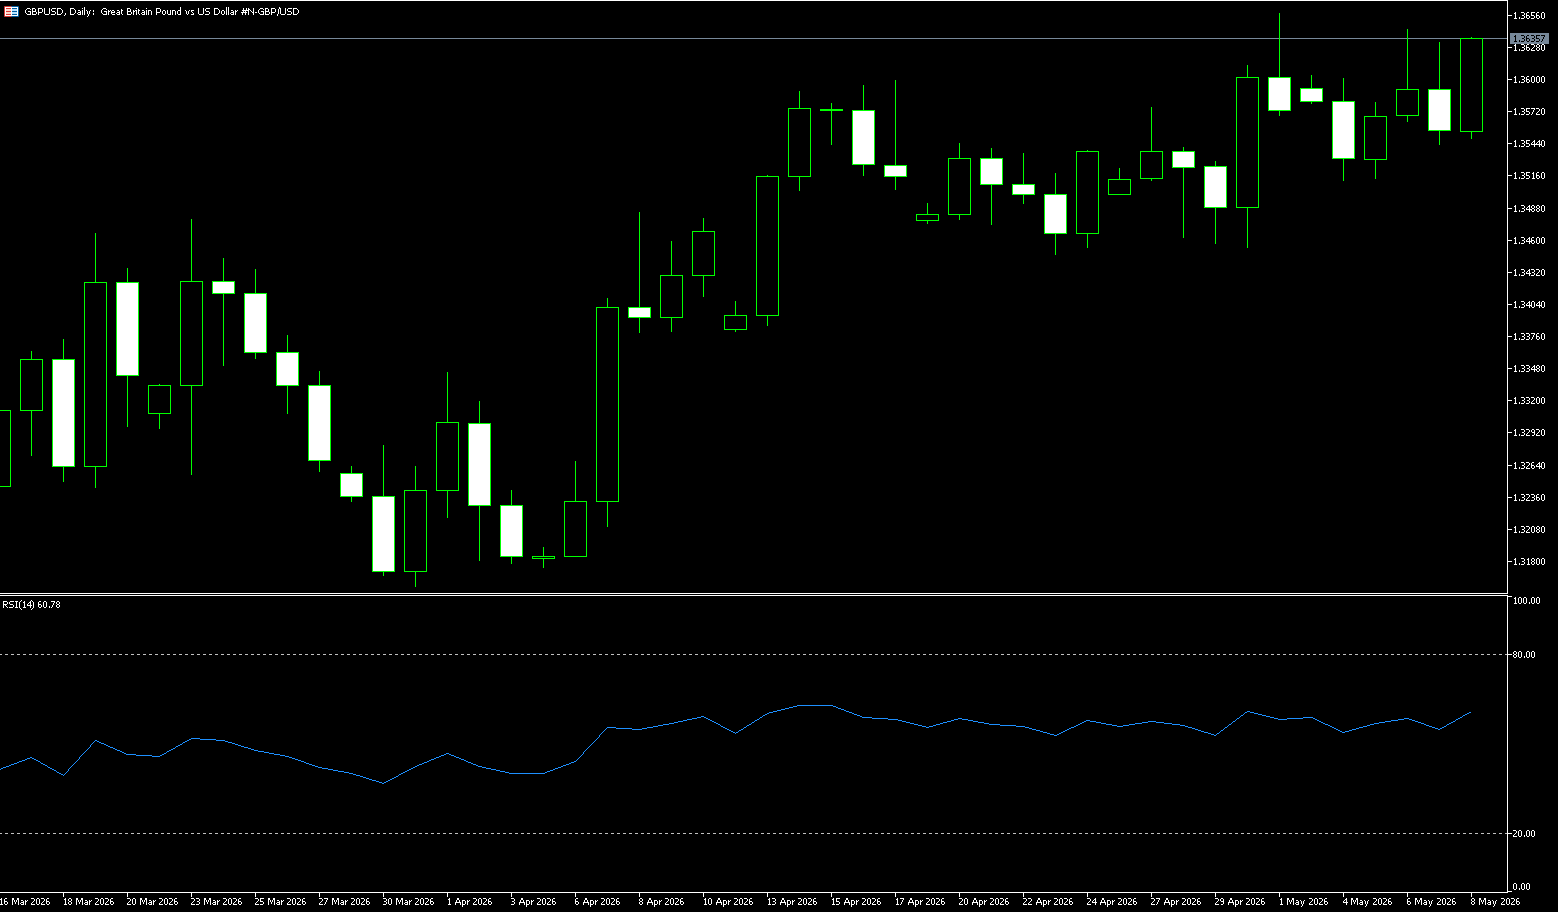
The pound rebounded above $1.34 as investors digested disappointing UK employment data and focused on developments in the Middle East conflict. Payrolls fell by 100,000 in April, the largest drop since May 2020, far exceeding the expected decline of 10,000. The unemployment rate unexpectedly rose to 5% in the first quarter of 2026, while regular wage growth slowed to 3.4%, the lowest pace since the end of 2020, and job vacancies fell to their lowest level since 2021. Therefore, traders now expect only two Bank of England rate hikes by December. Elsewhere, Brent crude prices remained near four-year highs after US President Donald Trump postponed further strikes against Iran but warned of a potential "full-scale, massive attack" if negotiations failed. In UK politics, leading candidate Andy Burnham ruled out changing the borrowing ceiling, easing concerns about loose fiscal policy, which had led to a sell-off in UK bonds last week. Meanwhile, Prime Minister Keir Starmer vowed to remain in office even if Burnham wins a by-election, hinting at a potential leadership conflict.
On the daily chart, GBP/USD is trading above 1.3400. The pair holds a bearish bias for the day as it remains below this week's high of 1.3450, and short-term movement remains under pressure despite a lack of structural support nearby on the chart. The Stochastic Relative Strength Index (RSI) is near 43, suggesting that while downward momentum is excessive, it has not yet clearly reversed. On the upside, immediate resistance lies at the 200-day simple moving average (SMA) at 1.3424, with stronger resistance at the 34-day SMA around 1.3483. The pair needs to recover both to alleviate the current bearish tone. On the downside, the lack of nearby structural support levels makes the pair vulnerable to further declines. Any new lows will likely depend on how long the price can hold below the 200-day SMA at 1.3424, with immediate support at 1.3378 (the May 20 low). A close below this area would expose the pair to renewed selling pressure and could lead to a pullback to the recent low of 1.3315.
Today, consider going long on GBP at 1.3420, with a stop-loss at 1.3410 and targets at 1.346 and 1.3480.
USD/JPY
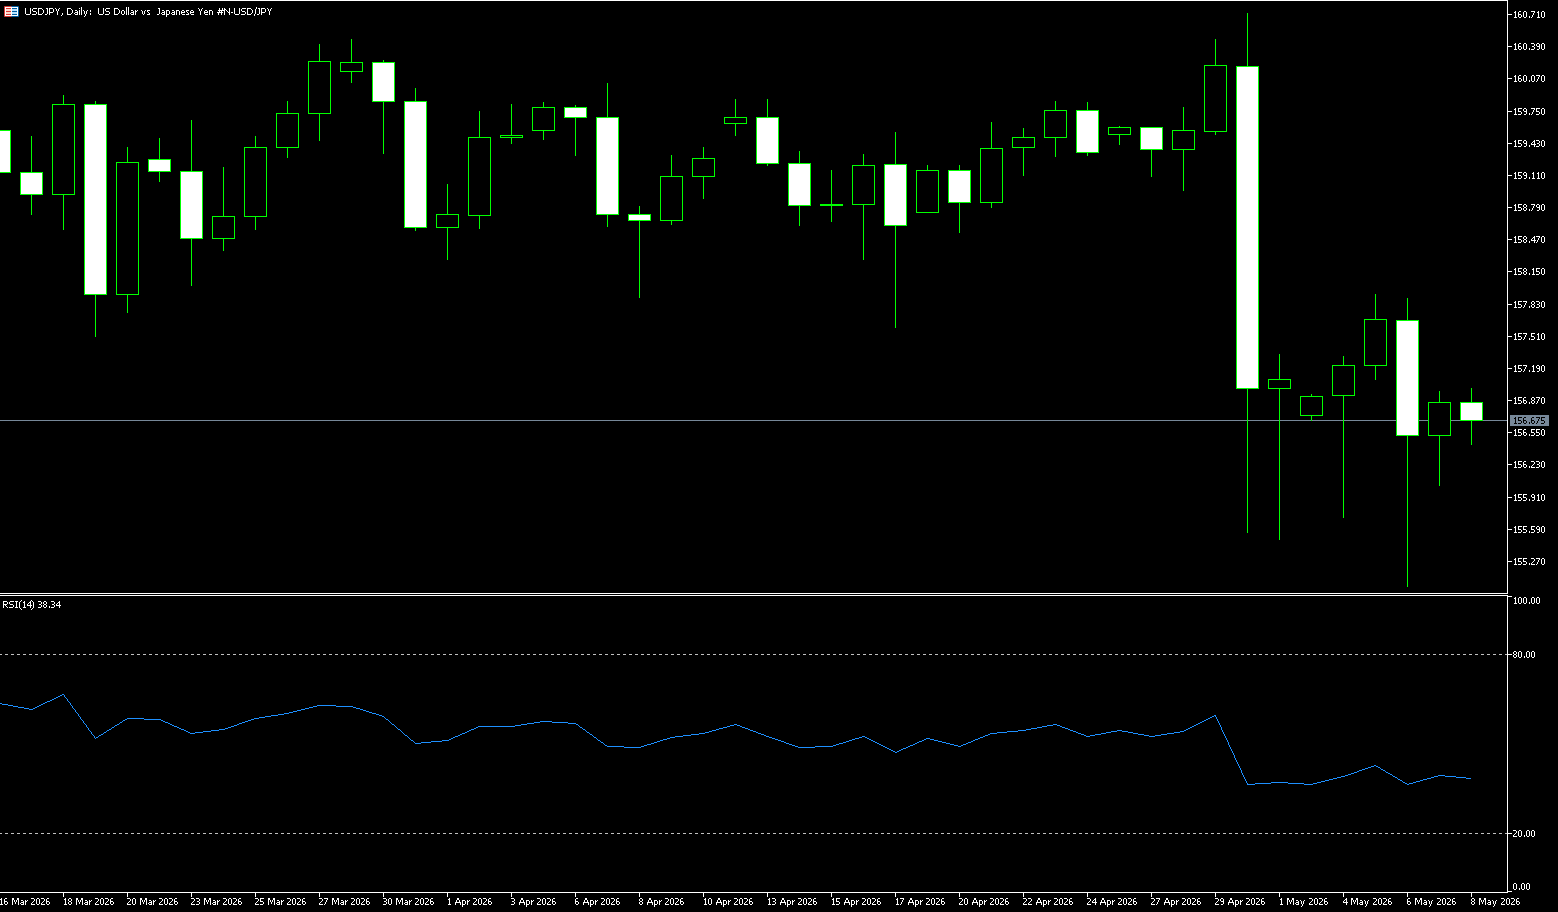
The yen traded near 159 against the dollar on Wednesday, continuing to be under pressure and hovering around the key 160 level, which triggered intervention by Japanese authorities to support the currency in late April and early May. Several officials in Tokyo have recently hinted that there may be no limit to the frequency with which authorities intervene in the foreign exchange market if necessary. Strong GDP data has also strengthened market expectations for a near-term interest rate hike by the Bank of Japan, with increasing speculation that action may be taken next month following hawkish comments from policymakers. Meanwhile, the yen continues to be pressured by the ongoing conflict in the Middle East, which keeps oil prices high and exacerbates inflation concerns. This situation has pushed up the dollar and US Treasury yields as investors increasingly bet that the Federal Reserve may still need to raise interest rates this year to control inflation, further putting downward pressure on the yen.
From a technical perspective, the USD/JPY daily chart still maintains a clear upward trend. The exchange rate is currently trading above the 65-day (158.33) and 100-day (157.52) simple moving averages, indicating that the medium-to-long-term bullish structure remains intact. Especially after forming support around 157, the market has resumed its upward momentum. The daily stochastic oscillator is still near high levels, showing some overbought signs in the short term, but no clear top reversal signal has yet formed, indicating that bullish momentum remains. On the upside, the 160 level remains the most important psychological resistance. If the situation in the Middle East continues to escalate, and US Treasury yields rise further, USD/JPY could test 160 or even higher to 160.73 (the high of April 30th). However, downside risks are also worth noting. Due to the significantly increased risk of Japanese government intervention, the market is generally wary of the 160 area. If the Japanese Ministry of Finance takes substantial intervention action, USD/JPY could quickly fall back to the 100-day (157.52) simple moving average, or even the 157 level.
Today, consider shorting the US dollar at 159.00, with a stop loss at 159.15 and targets at 158.20 and 158.30.
EUR/USD
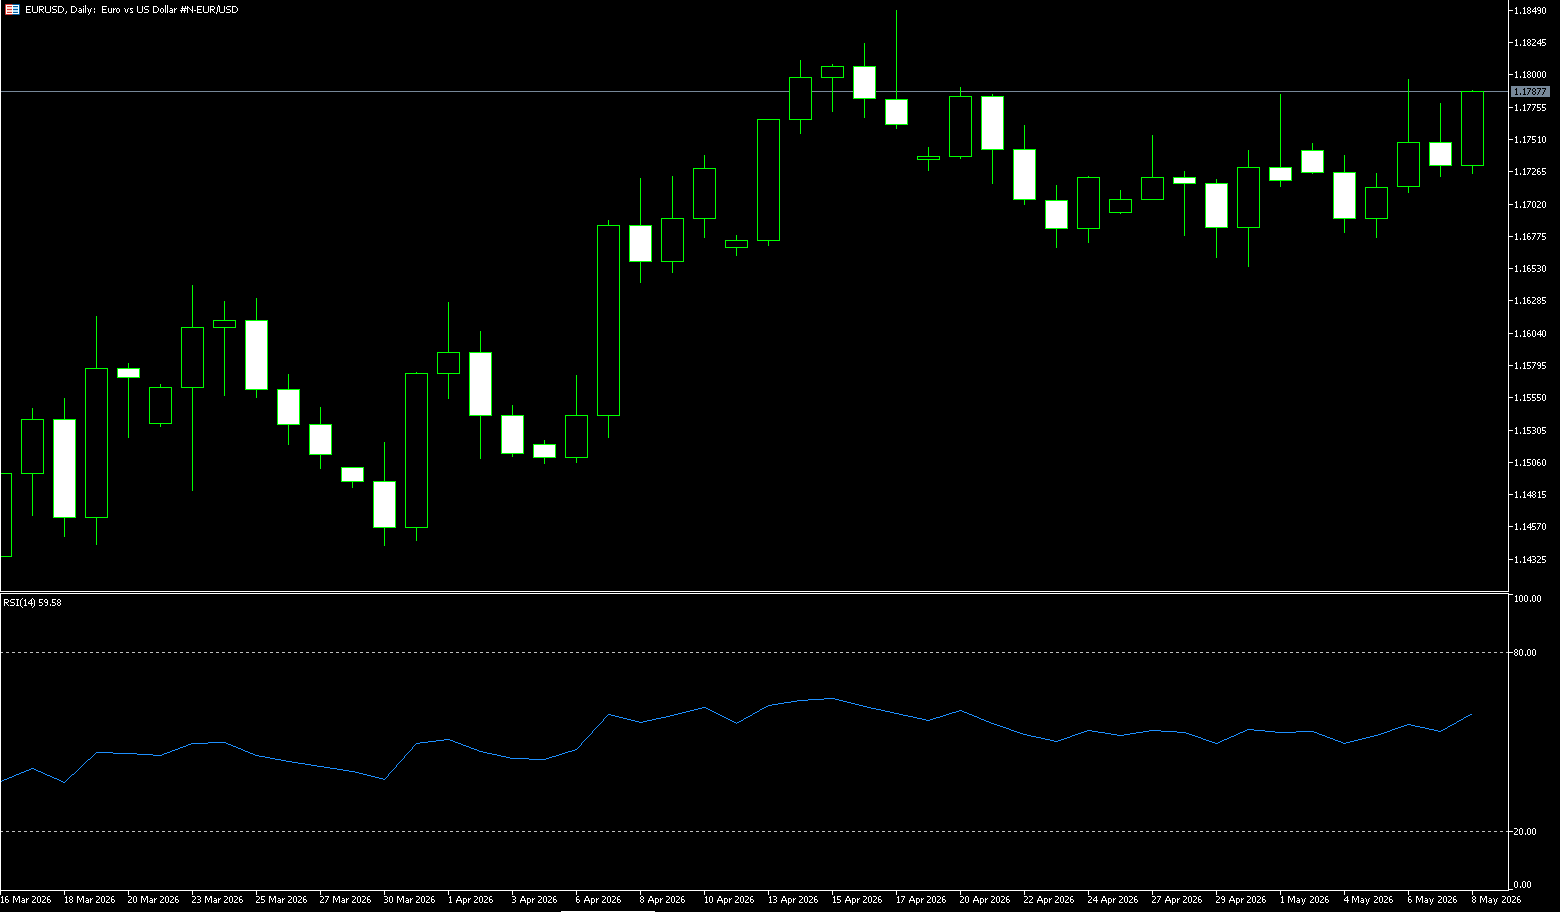
The euro rebounded above $1.16, after earlier hovering near a one-month low, as investors braced for the continued impact of high energy prices amid the Middle East conflict, which could exacerbate broader inflation and dampen economic growth. Brent crude prices neared four-year highs after US President Trump postponed further strikes against Iran but ordered the military to prepare for a “full-scale, large-scale attack” in case negotiations failed. Market expectations for tighter monetary policy from the European Central Bank have eased slightly, although traders still expect an 80% probability of a 25 basis point rate hike next month, with two more hikes possible before the end of the year. Recent data highlights the challenges: Eurozone growth slowed to 0.1% in the first quarter of 2026 due to energy supply constraints related to the Middle East conflict, the lowest level since the second quarter of 2025, while inflation rose to 3% in April, the highest level since September 2023, well above the ECB's 2% target. Investors are now awaiting Thursday's S&P Global PMI preliminary report for further clues on monetary policy.
From a technical perspective, the euro/dollar pair is currently maintaining a consolidation structure around 1.16 on the daily chart, but short-term downward pressure has emerged. After breaking below the 20-day moving average of 1.1666, the pair quickly fell to around 1.1590, and is currently attempting to regain footing above the short-term moving average area. The 14-day Relative Strength Index (RSI) is currently around 48, indicating that market sentiment is gradually recovering from oversold territory, but overall momentum remains neutral. The MACD indicator's bearish momentum is beginning to narrow, suggesting that short-term downward pressure has eased. Current technical indicators show that the first key resistance level for EUR/USD is around the 20-day moving average at 1.1666, which also coincides with a previous area of dense short-term trading. A successful break above this level could lead to a retest of the important psychological level of 1.1700. However, the market believes that a direct break above 1.1800 in the short term remains difficult. On the downside, 1.1635 provides initial short-term support, while 1.1600 is currently the most important dividing line between bullish and bearish sentiment. A break below 1.1600 could open further downside potential. Specifically, if EUR/USD breaks below 1.1572 (the high of March 26th), it is expected to test the swing low of 1.1505 from April 6th.
Consider going long on the Euro today at 1.1616, with a stop-loss at 1.1605 and targets at 1.1660 and 1.1650.
Disclaimer: The information contained herein (1) is proprietary to BCR and/or its content providers; (2) may not be copied or distributed; (3) is not warranted to be accurate, complete or timely; and, (4) does not constitute advice or a recommendation by BCR or its content providers in respect of the investment in financial instruments. Neither BCR or its content providers are responsible for any damages or losses arising from any use of this information. Past performance is no guarantee of future results.
More Coverage


Risk Disclosure:Derivatives are traded over-the-counter on margin, which means they carry a high level of risk and there is a possibility you could lose all of your investment. These products are not suitable for all investors. Please ensure you fully understand the risks and carefully consider your financial situation and trading experience before trading. Seek independent financial advice if necessary before opening an account with BCR.
BCR Co Pty Ltd (Company No. 1975046) is a company incorporated under the laws of the British Virgin Islands, with its registered office at Trident Chambers, Wickham’s Cay 1, Road Town, Tortola, British Virgin Islands, and is licensed and regulated by the British Virgin Islands Financial Services Commission under License No. SIBA/L/19/1122.
Open Bridge Limited (Company No. 16701394) is a company incorporated under the Companies Act 2006 and registered in England and Wales, with its registered address at Kemp House, 160 City Road, London, City Road, London, England, EC1V 2NX. This entity acts solely as a payment processor and does not provide any trading or investment services.

 English
 简体中文
简体中文
 繁體中文
繁體中文
 Bahasa
Melayu
Bahasa
Melayu
 Tiếng
Việt
Tiếng
Việt
 ไทย
ไทย
 日本語
日本語
 한국어
한국어
 ភាសាខ្មែរ
 español

