


0
US Dollar Index
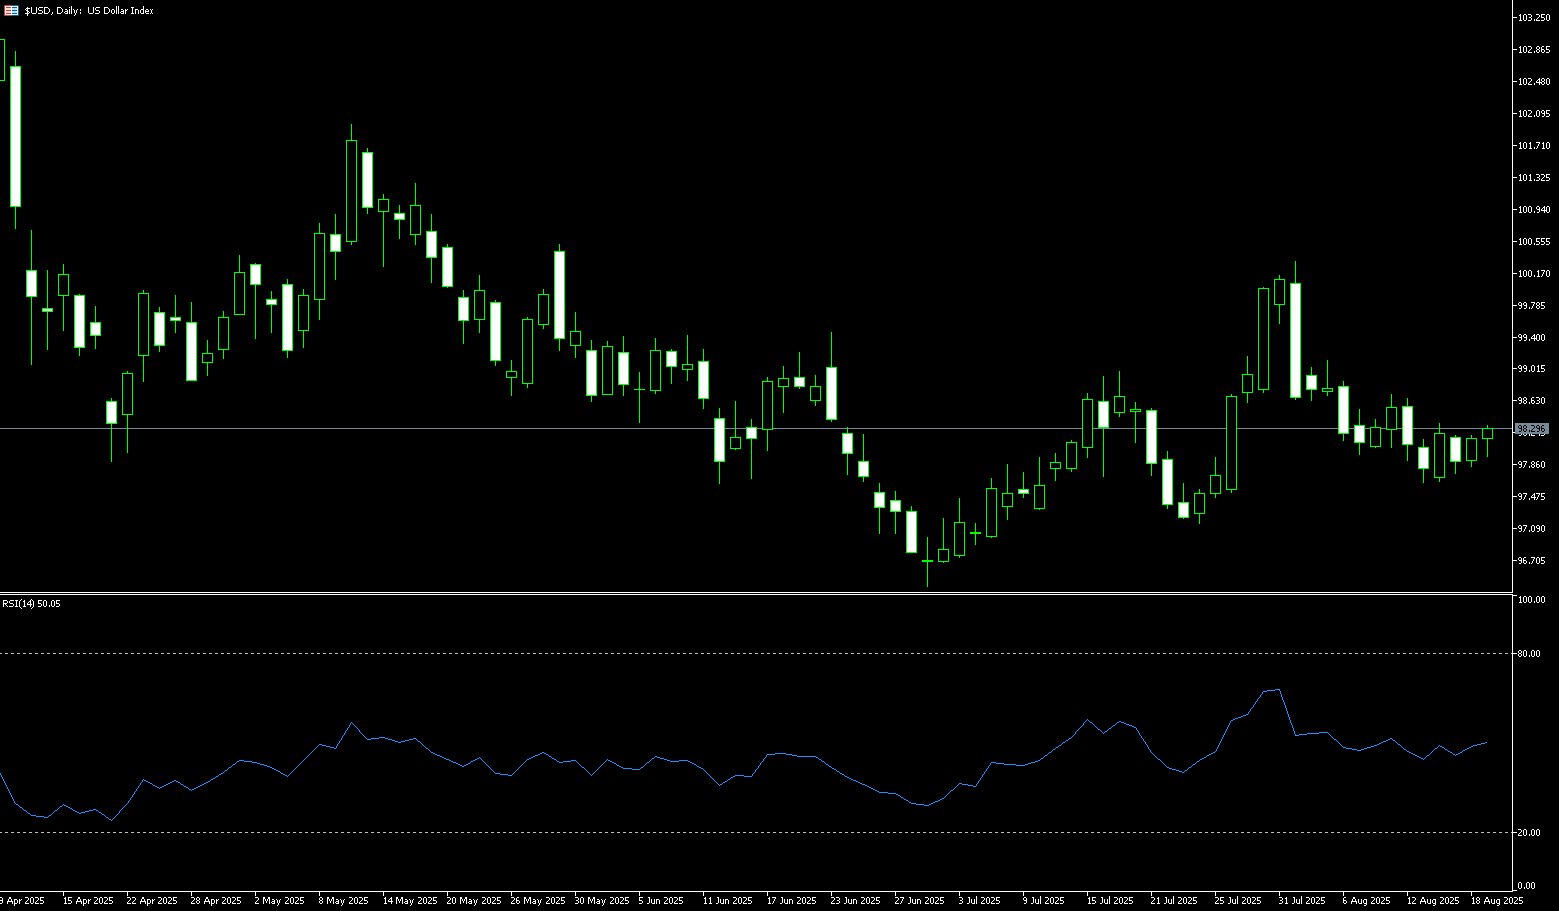
The US dollar index rose to around 98.25 on Tuesday, extending gains from the previous session, as investors focused on a crucial summit between President Trump and European leaders aimed at ending the war in Ukraine. During the meeting, Trump discussed potential security guarantees for Kyiv and announced a follow-up meeting involving Russian and Ukrainian leaders, which he will attend later. Ukrainian President Zelensky said Ukraine has proposed purchasing approximately $90 billion in US weapons as part of the guarantee, with details expected to be finalized within ten days. On the monetary policy front, the market is also looking forward to the Federal Reserve's annual Jackson Hole symposium later this week for signals on interest rate trends. Fed Chairman Powell plans to discuss the economic outlook and the central bank's policy framework. The dollar saw its strongest gains against the euro and yen.
The US dollar index remained above 98.00 this week. Technical analysis on the daily chart shows that the US dollar index remains within a descending channel pattern, indicating a dominant bearish bias. The 14-day relative strength index (RSI) is below 50, reinforcing the bearish bias. Furthermore, short-term price momentum remains weak as the US Dollar Index trades below its 20-day simple moving average at 98.38. On the downside, the US Dollar Index could find initial support at 97.63, a "double bottom," followed by 97.49 (the July 28 low). A break below this key support level could reinforce the bearish bias and exert downward pressure on the US Dollar Index, keeping it hovering around the 97.00 round-figure low. On the upside, the 20-day simple moving average at 98.38 and then 98.67 (the August 11 high) could be targeted.
Consider shorting the US Dollar Index at 98.38 today, with a stop-loss at 98.50 and a target at 97.90 or 97.80.
WTI Spot Crude Oil
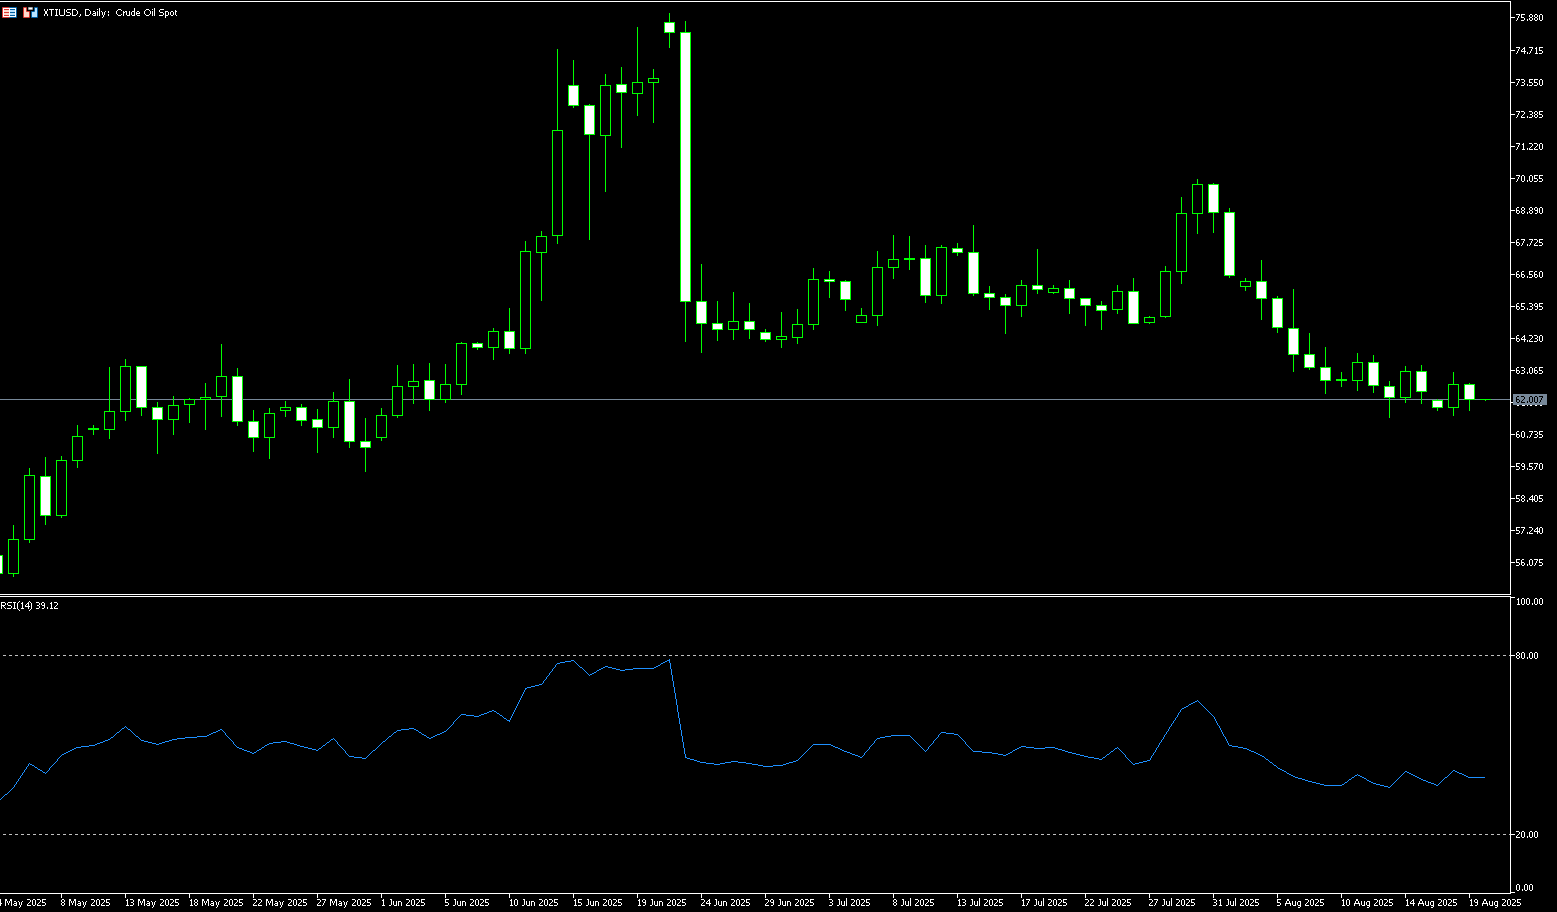
US crude oil is trading around $62.00 per barrel. Ukraine intensified its attacks on Russian energy infrastructure on Monday, and White House trade advisor Peter Navarro suggested that India should ban Russian crude oil imports. White House trade advisor Peter Navarro wrote in the Financial Times on Monday that India's dependence on Russian crude oil is highly speculative and seriously undermines international efforts to isolate Putin's war economy. In effect, India has become a global clearinghouse for Russian oil, while also providing Moscow with much-needed US dollars. Market sentiment is primarily influenced by geopolitical expectations. Following his meetings with Ukrainian President Volodymyr Zelensky and European allies, US President Trump announced that he had spoken with Russian President Vladimir Putin and was working on arranging a trilateral summit between the US, Russia, and Ukraine. This development is seen as potentially leading to the lifting of some sanctions on Russian crude oil, thereby depressing oil prices.
This round of oil price fluctuations clearly demonstrates the market's high sensitivity to geopolitical negotiations. If the trilateral talks show substantial progress, the oil market will re-price risk premiums; however, if the negotiations fail or are accompanied by new sanctions, oil prices could rise rapidly. Looking at the daily chart of US crude oil, prices have fallen below the key support levels of $64.75 (the 20-day moving average) and $65 (the round number), and continue to fluctuate downward. Current support is concentrated around the $62 round-figure mark. A break below could lead to further testing of $61.35 (the August 13 low), the $61.00 round-figure mark, and then the psychological $60 level. Above, resistance lies around $63.16 (the 61.8% Fibonacci retracement level from $54.78 to $76.74). A break above this level could potentially challenge the $64.75-$65.00 range.
Consider going long on crude oil at $61.75 today. Stop-loss: $61.58. Target: $63.00, $63.00.
Spot Gold
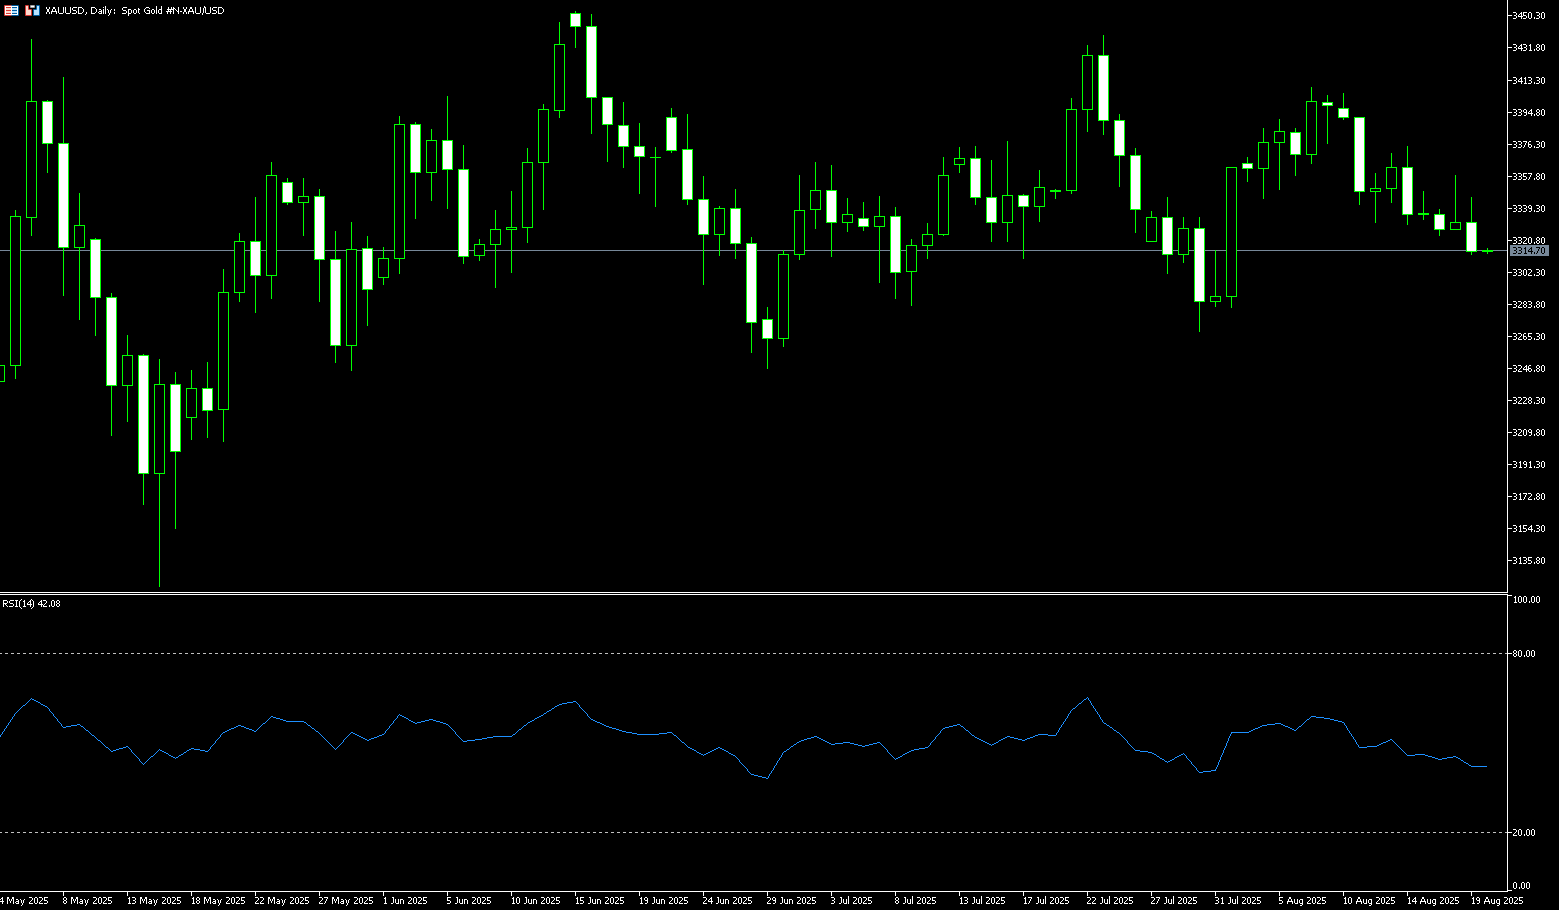
Gold prices stabilized around $3,330 per ounce on Tuesday as investors weighed US-led efforts to end the war in Ukraine and looked ahead to the Federal Reserve's annual Jackson Hole symposium. Following Monday's meetings with Ukrainian President Volodymyr Zelensky and European leaders, US President Donald Trump stated that he had spoken with Russian President Vladimir Putin and was working to arrange a direct meeting between Putin and Zelensky, followed by a three-way summit. This fueled hopes for a potential peace deal, though investors remained skeptical of an imminent breakthrough. Traders were also closely watching Federal Reserve Chairman Jerome Powell's speech in Wyoming later this week, seeking clues as to whether the US central bank will resume rate cuts in September.
Gold's uptrend stalled at the start of the week, with prices hovering around $3,318, facing key resistance near $3,360. The relative strength index (RSI) is bearish, though flattened, suggesting buyer intervention in the $3,300 area. For bullish continuation, buyers would need to break through the confluence of the 20-day and 50-day simple moving averages, located between $3,348 and $3,349. A break above this area would expose subsequent resistance at $3,374.80 (August 14 high) and $3,400, targeting the June 16 high of $3,452 and ultimately the all-time high of $3,500. On the downside, a close below the July 31 high of $3,315 could trigger a decline toward the psychologically important $3,300 level, with further support at the 110-day simple moving average near $3,285.
Consider a long gold position at $3,310 today, with a stop loss at $3,305 and targets at $3,335 or $3,340.
AUD/USD
The Australian dollar traded around $0.6460 on Tuesday as markets navigated a relatively quiet week of domestic economic data. Australia's Westpac-Melbourne Institute Consumer Confidence Index surged 5.7% to 98.5 in August 2025—the highest level since February 2022—following a 0.6% increase in July. Investors now await consumer inflation expectations, flash purchasing managers' indexes, and speeches from Reserve Bank of Australia officials this week. On the monetary policy front, investors expect the Reserve Bank of Australia to ease policy further before the end of the year, with markets pricing in another 50 basis point cut by November. At its August policy meeting, the central bank cut the cash rate by 25 basis points to 3.60%, lowering borrowing costs to their lowest level since April 2023 and totaling 75 basis points of easing through 2025.
AUD/USD traded around 0.6460 on Tuesday. Technical analysis on the daily chart suggests weak short-term momentum, as the pair trades below its 50-day simple moving average of 0.6520. Furthermore, the 14-day relative strength index (RSI) remains below 50, indicating a bearish market bias. On the downside, the pair could see scope for a move to the low of 0.6449 set on August 5. The next key support level lies at 0.6400, followed by the three-month low of 0.6372. Immediate resistance lies at the 50-day simple moving average at 0.6520, followed by last week's high of 0.6568, and then at the psychologically important 0.6600 level.
Consider a long position on the Australian dollar at 0.6442 today, with a stop-loss at 0.6430 and targets at 0.6500 or 0.6510.
GBP/USD
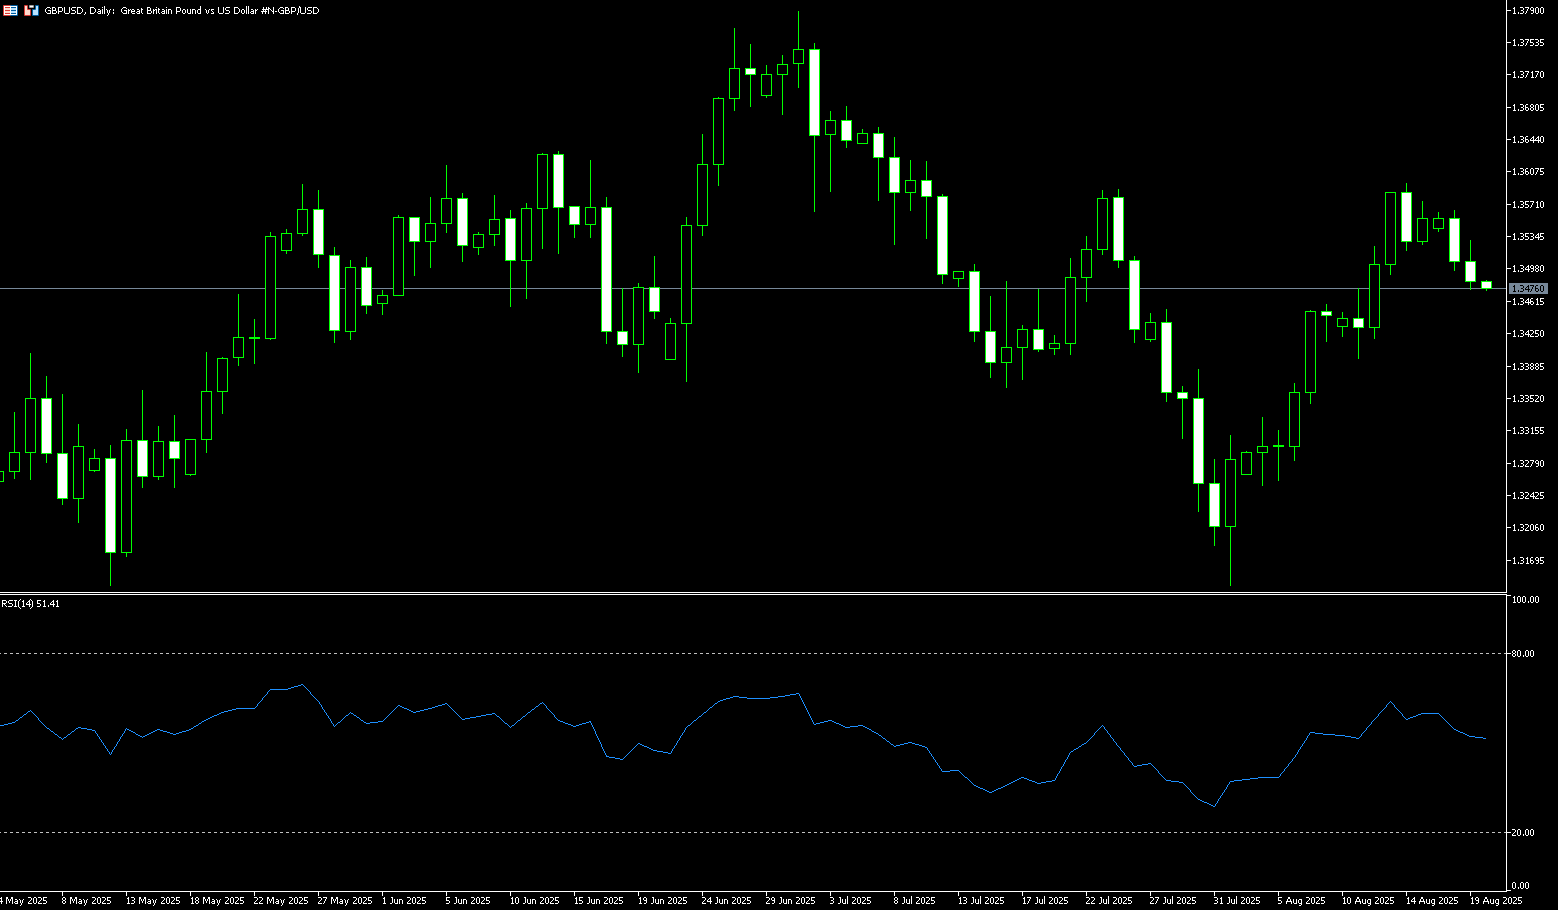
GBP/USD traded softer in early European trading on Tuesday, just below 1.3500. The dollar rose against the British pound as traders pared their bets on a rate cut by the Federal Reserve at its September 16-17 meeting. The UK's July Consumer Price Index (CPI) inflation report will be in focus later on Wednesday. Traders are gearing up for the Federal Reserve's annual Jackson Hole meeting on Friday, seeking fresh momentum. However, concerns about political interference in the Fed's independence could weigh on the US dollar and provide support for major currency pairs. Regarding the British pound, an upbeat UK second-quarter GDP report could complicate the Bank of England's path for further interest rate cuts and potentially help limit losses for the British pound. UK GDP growth slowed to 0.3% in the three months to June, down from 0.7% in the first quarter, but stronger than the expected 0.1% growth during the reporting period.
In the short term, GBP/USD resumed its upward trend after breaking through the top trendline of a descending wedge pattern last week, reaching a high since July at 1.3594. However, traders remain reluctant to climb above the psychological 1.3600 level, leading the pair to oscillate slightly below 1.3500. The 14-day Relative Strength Index (RSI) on the daily chart is bullish but slightly weak. Therefore, a pullback is necessary before further gains can be made. If GBP/USD breaks below 1.3500, it is expected to test the 89-day simple moving average at 1.3451, followed by the 1.3423 daily simple moving average. A breakout would put the uptrend at risk, as sellers could challenge the 1.3400 level. Conversely, if GBP/USD holds above 1.3500, it could rise to 1.3594 (last week's high), and above 1.3600, where buyers could push the spot price towards the July 4 high of 1.3565.
Consider a long position on GBP at 1.3480 today, with a stop-loss at 1.3470 and targets at 1.3540 and 1.3550.
USD/JPY
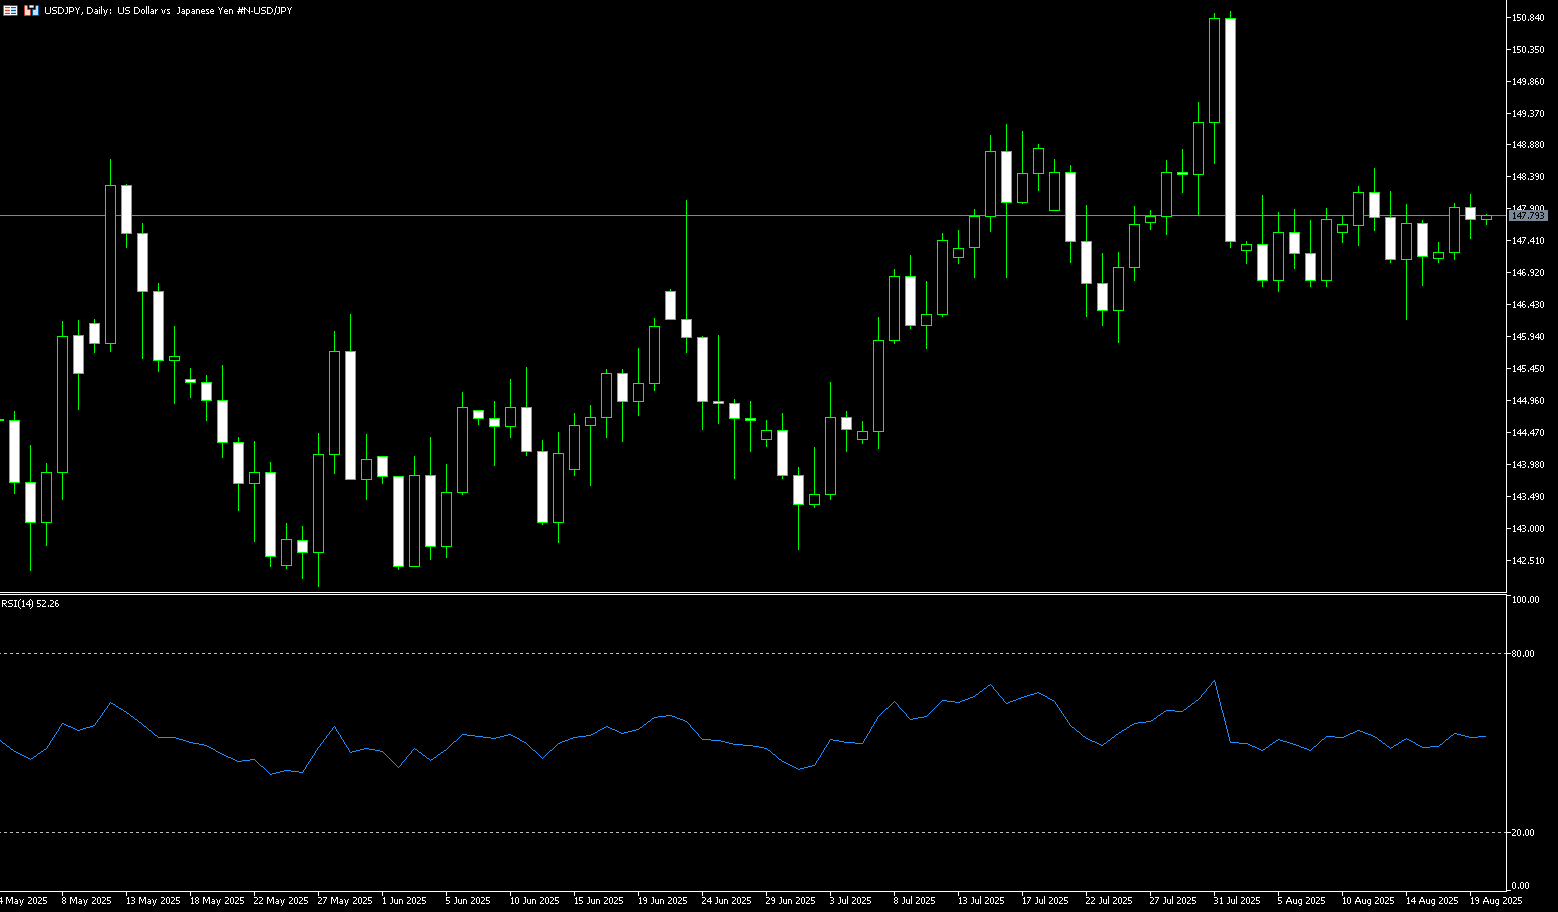
The yen traded near 148 per dollar on Tuesday, after falling about 0.5% in the previous session, pressured by a stronger dollar amid optimism about progress in negotiations to end the war in Ukraine. On Monday, US President Donald Trump met with European leaders to discuss security guarantees for Ukraine and pushed for a direct meeting between Ukrainian President Volodymyr Zelensky and Russian President Vladimir Putin, potentially followed by a trilateral summit involving himself. The yen also came under pressure after Japanese officials downplayed comments from US Treasury Secretary Scott Besant, who suggested the Bank of Japan was "lagging" on policy, which was seen as pressure to raise interest rates. However, Bank of Japan Governor Kazuo Ueda maintained a cautious stance, emphasizing that "underlying inflation" remains below the bank's 2% target.
The range-bound price action in the USD/JPY pair over the past two weeks or so could be categorized as a consolidation phase under neutral technical indicators. Therefore, it would be prudent to await a definitive breakout before positioning for the next directional move. Meanwhile, sustained strength and acceptance above 148.00 would be considered a key trigger for USD/JPY bulls. This would pave the way for a move higher towards the 148.55-148.60 area, or the 50% retracement of the decline from the monthly high, towards the 149.00 round number. Conversely, any corrective decline could find suitable support around the 147.10-147.00 area. A break below this could lead USD/JPY to retest the multi-week low of 146.20 reached last Thursday. A subsequent break below the 146.00 level could shift bearish traders' bias.
Consider shorting the USD at 147.85 today. Stop loss: 148.05, target: 147.00-146.80.
EUR/USD
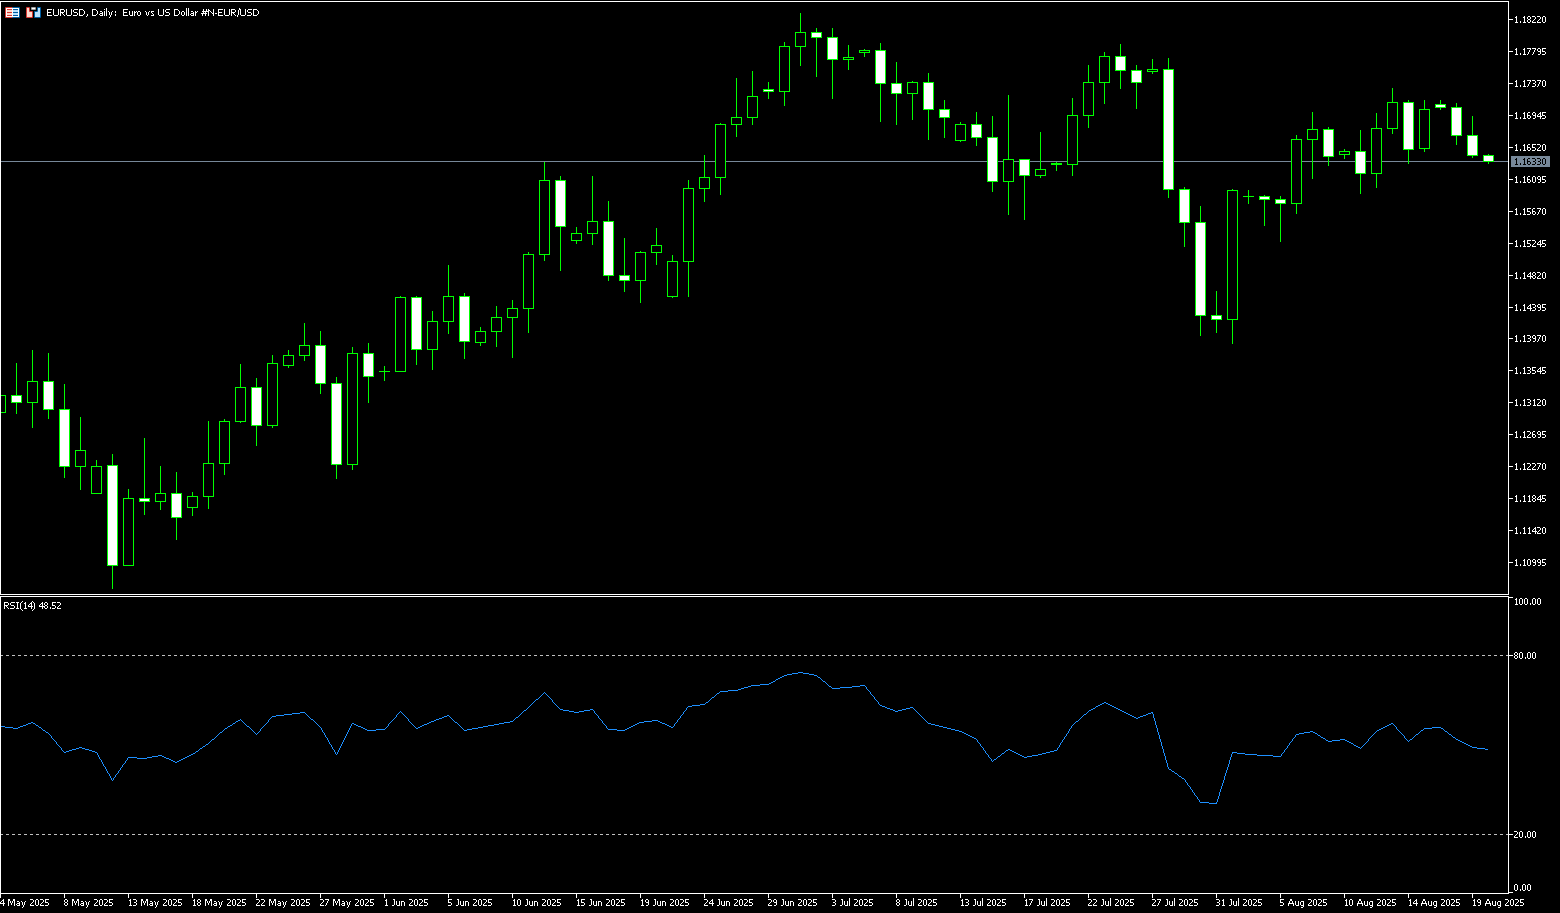
EUR/USD started the week lower as traders awaited the outcome of the meeting between US President Trump and Ukrainian President Zelensky, following Trump's meeting with Russian President Vladimir Putin last Friday. The pair is trading around 1.1650. Positive news emerged from the White House meeting between Trump, Zelensky, and European leaders. Trump stated that today's meeting had been successful so far, as Russia agreed to provide security guarantees, albeit in exchange for some territory. A quick resolution to the war would be positive for the euro, as the EU is a major importer of energy products. This could stabilize oil and gas prices, benefiting the EU as a whole. Traders are also eyeing the release of the latest Federal Reserve monetary policy meeting minutes and Fed Chairman Jerome Powell's opening speech at the Jackson Hole Symposium.
EUR/USD's uptrend has stalled temporarily this week, with traders unable to maintain gains above the 1.1700 level, paving the way for a pullback to 1.1600. If bears break below the 50-day simple moving average at 1.1640, the pair could challenge the 14-day simple moving average at 1.1627. Further weakness could lead to the psychological level of 1.1600. On the other hand, if buyers push the exchange rate higher, a test of 1.1700 is possible. If further strength is seen, key resistance lies above: the July 24 high of 1.1788, the 1.1800 level, and the year-to-date high of 1.1830.
Consider a long position on the euro at 1.1632 today, with a stop loss of 1.1620 and a target of 1.1690 or 1.1700.
Disclaimer: The information contained herein (1) is proprietary to BCR and/or its content providers; (2) may not be copied or distributed; (3) is not warranted to be accurate, complete or timely; and, (4) does not constitute advice or a recommendation by BCR or its content providers in respect of the investment in financial instruments. Neither BCR or its content providers are responsible for any damages or losses arising from any use of this information. Past performance is no guarantee of future results.


ការប្រកាសអំពីហានិភ័យ:ការជំនួញដោយកិច្ចសន្យាផ្សេងៗដោយកម្ចីបង្កើនការហានិភ័យខ្ពស់, ហើយអាចមិនសាកសមសម្រាប់អ្នកវិនិយោគទាំងអស់។ សូមធានាថាអ្នកបានយល់ដល់ហានិភ័យនិងបានពិចារណាស្ថានភាពហិរញ្ញវត្ថុនិងបទពិសោធន៍ជំនួញរបស់អ្នកមុនពេលជំនួញ។ ស្វែងរកការផ្តល់ដំបូន្មានហិរញ្ញវត្ថុឯករាជ្យប្រសិនបើចាំបាច់មុនពេលបើកគណនីជាមួយ BCR។

 English
 简体中文
简体中文
 繁體中文
繁體中文
 Bahasa
Melayu
Bahasa
Melayu
 Tiếng
Việt
Tiếng
Việt
 ไทย
ไทย
 日本語
日本語
 한국어
한국어
 ភាសាខ្មែរ
 español