


0
US Dollar Index
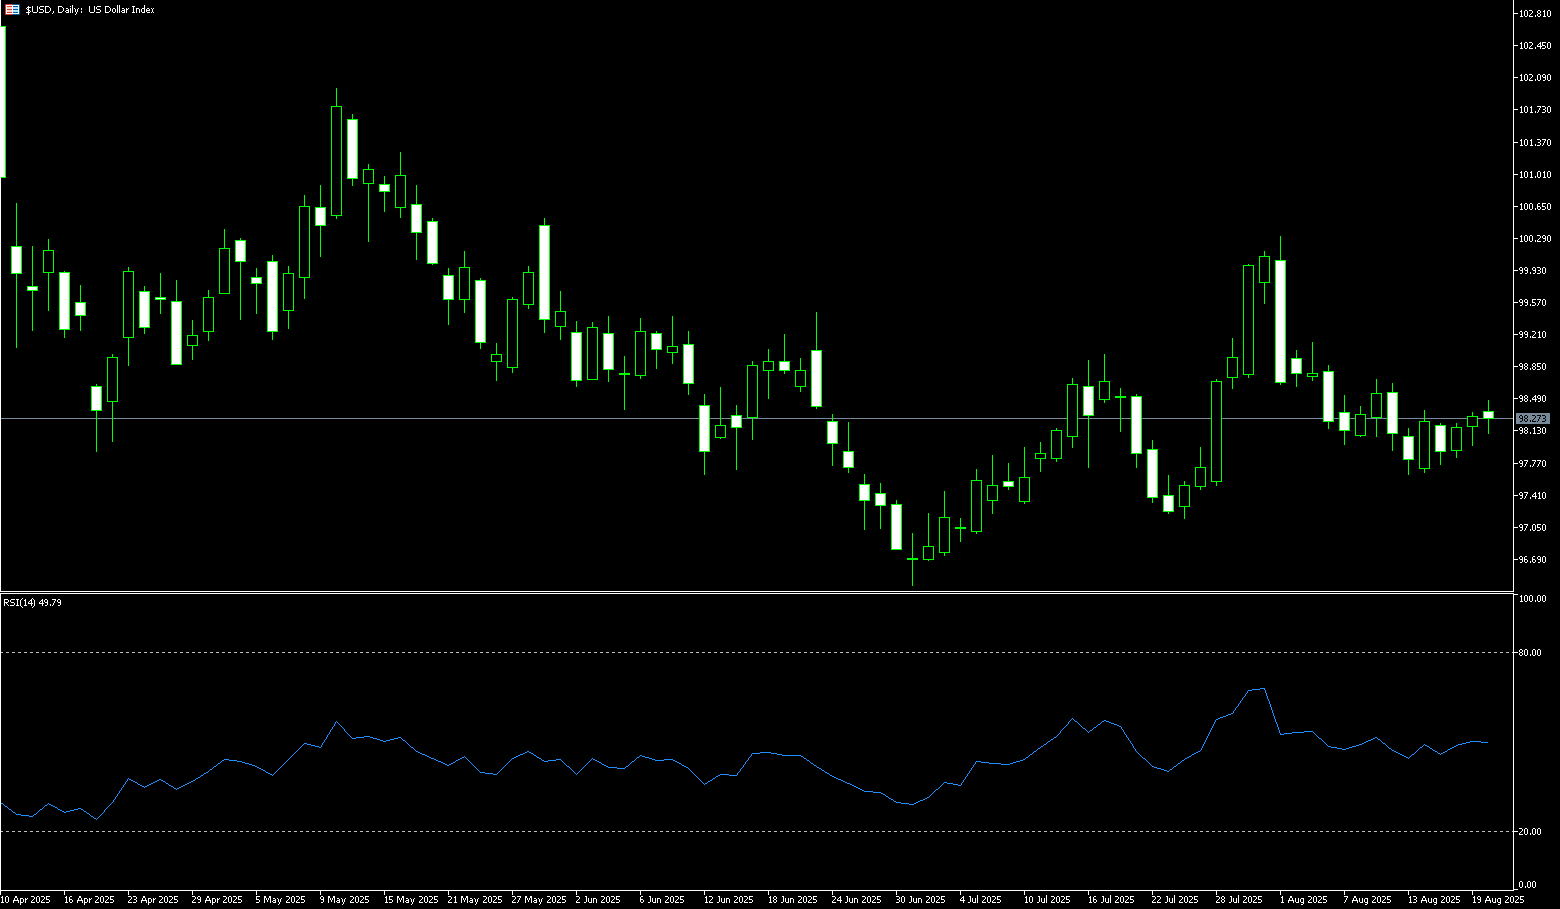
The US dollar index rose above 98.40 on Wednesday, extending its gains for the third consecutive session. Investors awaited the minutes of the Federal Reserve's July meeting for clues on the policy outlook. The meeting saw the first two dissenters since 1993, with Fed Governors Christopher Waller and Michelle Bowman supporting a 25 basis point rate cut rather than holding rates steady. Markets will next focus on Fed Chairman Jerome Powell's speech at the Jackson Hole Symposium to see whether the central bank will counter market expectations of a rate cut. Traders currently see an 85% probability of a September rate cut and expect approximately 54 basis points of cuts by year-end. The US dollar strengthened broadly, with the largest gains against the euro, pound, and Australian dollar.
As the dollar's strength fades and Treasury yields edge lower, the US dollar index has reached a critical juncture. If Powell downplays inflation concerns and agrees with the market's pricing of a rate cut, the US dollar index could decline further, testing key support around 97.00 (round numbers) and 97.11 (24/7 lows). Conversely, if Powell signals a hawkish tone, the US dollar index could retest the resistance zone between 99.00 (round numbers) and 99.04 (100-day moving average). Technically, all eyes are on the 21-day moving average at 98.58. Traders' reaction to this indicator will determine the market's tone heading into the day's close. If the US dollar index breaks above the 21-day moving average, it could strengthen further to 98.67 (August 11 high) and 99.00. However, if it breaks below the 9-day moving average at 98.17 and the recent low of 98.00, and if momentum remains strong, the dollar could continue its weakness toward the "double bottom" at 97.63, where it could find initial support.
Consider shorting the US Dollar Index at 98.36 today, with a stop-loss at 98.50 and a target of 97.95 or 97.80.
WTI Spot Crude Oil
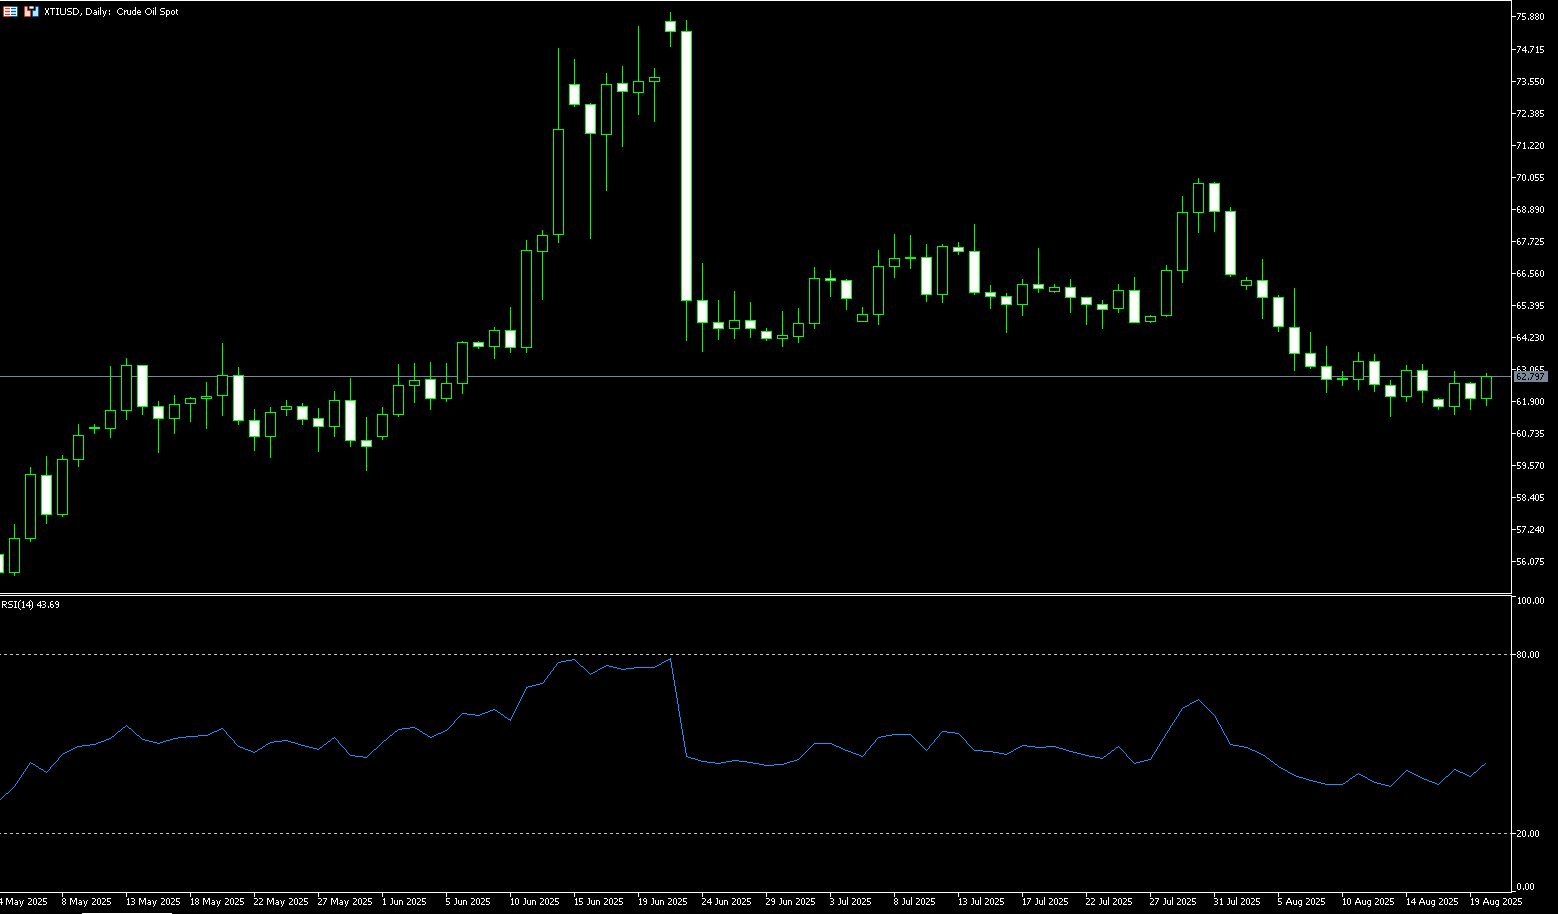
WTI crude oil held near $62.60 per barrel on Wednesday, reversing a drop of over 1% from the previous session after industry data showed a larger-than-expected draw in US crude oil inventories. The API report showed a 2.4 million barrel drop in crude oil inventories last week, exceeding expectations for a 1.2 million barrel drop, indicating strong demand. However, geopolitical developments limited gains. The market is eyeing the possibility of Russia-Ukraine peace talks, which could ease sanctions on Russian crude oil and boost global supply. Meanwhile, Chinese refiners purchased 15 cargoes of Russian crude oil for delivery in October and November, highlighting the resilience of Moscow's exports despite sanctions pressure as Indian demand weakens. The prospect of a Russia-Ukraine agreement, weakening enforcement of secondary sanctions, and rising OPEC+ production have all contributed to recent market weakness, pushing oil prices to a near three-month low and leaving them down over 10% so far this month.
From a technical perspective, WTI crude oil prices are under pressure, hovering around the key $62.60 level and trading below both the 21-day moving average ($64.59) and the 100-day moving average ($63.95). This bearish outlook remains intact. A break below and close below the $62.00 support level could trigger further declines towards the $61.35 (August 13 low) and $61.00 (round-number mark), with the next downside target being the psychological $60 level. Conversely, immediate resistance lies around $63.16 (the 61.8% Fibonacci retracement level from $54.78 to $76.74). A break above this level could potentially challenge the 100-day moving average ($63.95). A break below this level could target the 21-day moving average ($64.59).
Consider going long on crude oil at 62.55 today. Stop-loss: 62.35. Target: 63.80, 64.00.
Spot Gold
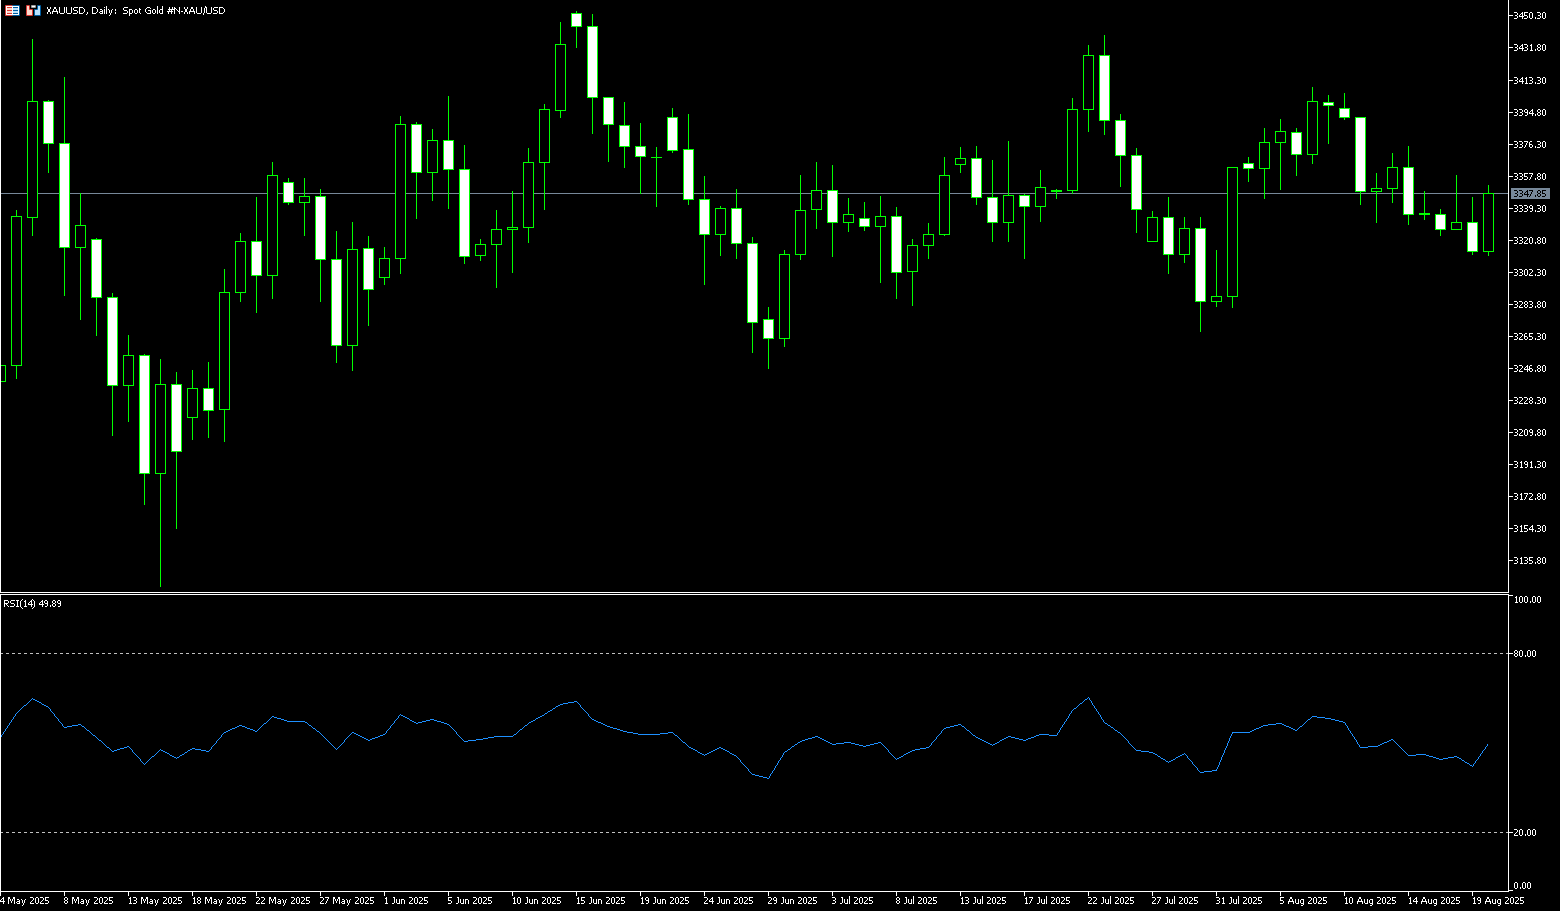
Gold held onto its earlier gains on Wednesday, trading above $3,345 per ounce following the release of the latest FOMC meeting minutes. Expectations of a September rate cut and a weaker dollar boosting global demand supported the market. The minutes from the Fed's July meeting revealed a split among officials, with most believing it was too early to cut rates despite growing concerns about inflation and a sluggish labor market. Two governors dissented, supporting a rate cut, marking the first time in more than three decades that multiple governors dissented from a policy decision. Investors also await Fed Chairman Jerome Powell's upcoming speech at Jackson Hole for signals on future monetary policy. Market expectations currently price in an 85% probability of a September rate cut, further bolstering bullish sentiment for the metal.
Gold prices have fallen for two consecutive trading days this week. With spot gold falling below $3,320 to a near three-week low of $3,311, the precious metal appears likely to challenge the psychological $3,300 level in the short term. The 14-day Relative Strength Index (RSI) on the daily chart has turned bearish after falling below its 50-day neutral line. However, price action suggests that gold needs to recapture the confluence of its 20-day and 50-day simple moving averages in the $33.43-33.48 range. A breakout above this range would clear the way for a test of $3,374.80 (the August 14 high) and $3,400. Further key resistance lies above, including the June 16 high of $3,452. On the downside, a break below the 5-day SMA of $3,327 could trigger a test of the 100-day SMA of $3,311 and the psychologically important $3,300 level, potentially triggering a move towards the July 31 low of $3,274.
Consider a long position in gold at $3,343 today, with a stop-loss at $3,340 and targets at $3,360 and $3,365.
AUD/USD
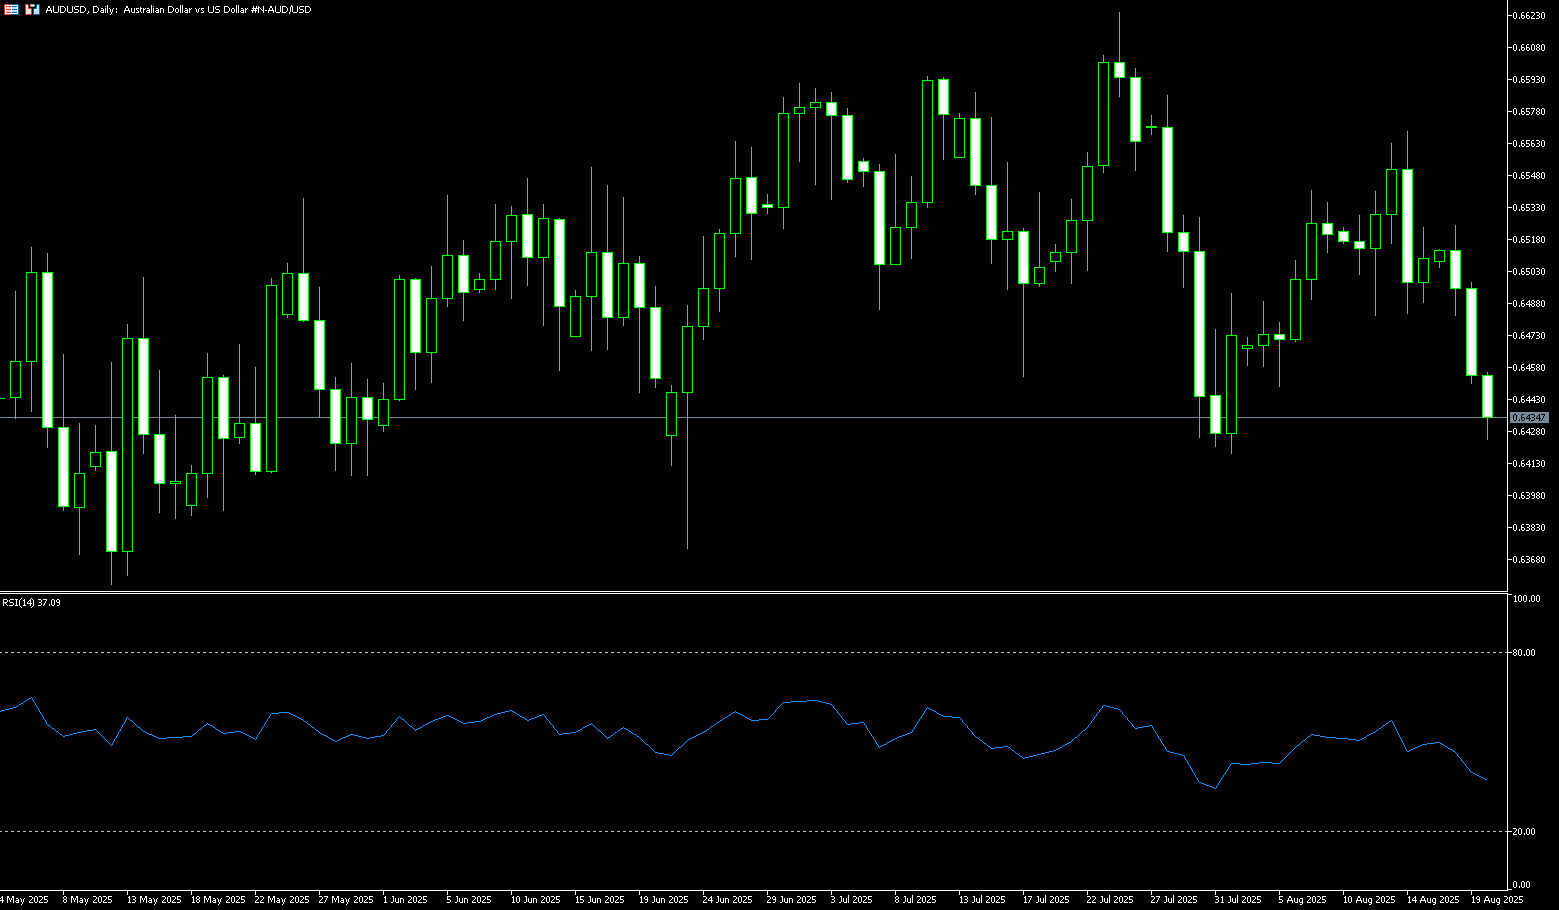
The Australian dollar weakened below $0.6440 on Wednesday, marking its third consecutive day of decline and reaching a near three-week low, as the greenback continued to regain strength ahead of key US events. Ahead of the release of the Federal Reserve's July meeting minutes and Chairman Powell's speech at the Jackson Hole Symposium, the market is turning cautious, with pricing in an 85% probability of a September rate cut and a year-end reduction of approximately 54 basis points. In Australia, consumer confidence surged to its highest level in nearly four years, buoyed by the Reserve Bank of Australia's third interest rate cut by 2025, lowering the cash rate to 3.6%. This surge provided some support to the Australian dollar, although markets continue to price in further easing. Markets now see a high probability of another rate cut in November, potentially lowering rates to around 3.35%, with some forecasts extending bets to two or three rate cuts by the end of the year. Investors now await the upcoming Purchasing Managers' Index data for insights into the Australian economy's momentum.
AUD/USD traded below 0.6440 on Wednesday. Technical analysis on the daily chart suggests weakening short-term price momentum, as the pair remains below its 20-day moving average at 0.6499 and the psychologically important 0.6500 area. Furthermore, the 14-day relative strength index (RSI) is below 50, indicating a bearish market bias. On the downside, the pair could test the two-month low of 0.6419 recorded on August 1st, the 0.6400 (round-number mark), and then the three-month low of 0.6372. On the upside, AUD/USD could target key resistance at 0.6482 (89-day moving average), followed by the 20-day moving average at 0.6499, and the 0.6500 (market psychological level).
Consider going long on AUD at 0.6420 today, with a stop-loss at 0.6410 and targets at 0.6470 and 0.6480.
GBP/USD
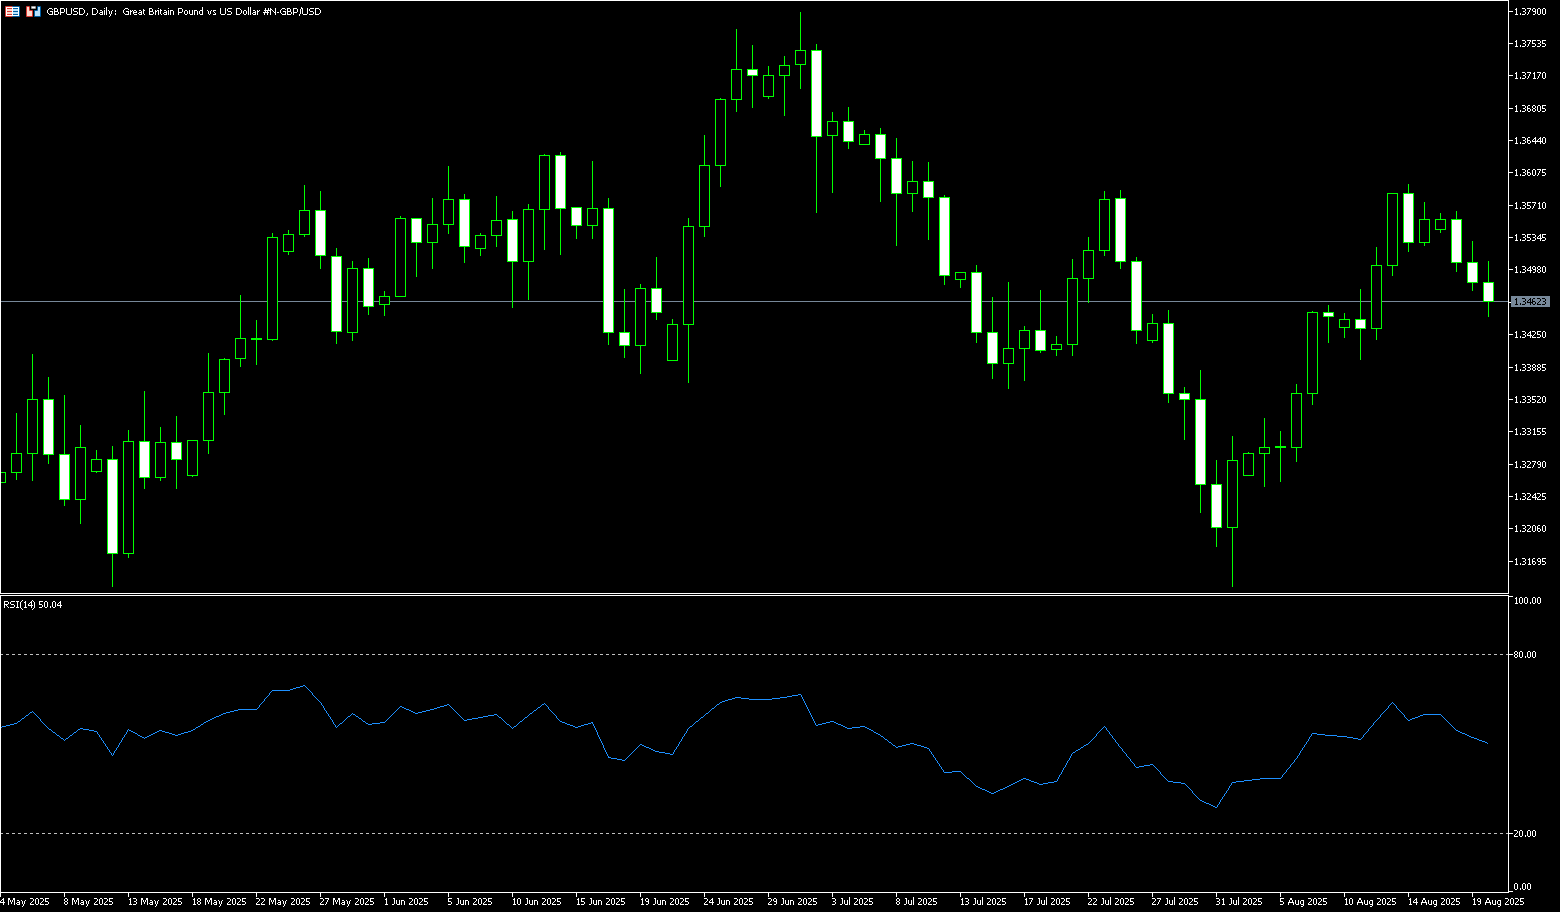
GBP/USD remains below 1.3500 as ceasefire hopes offset risks from the Fed and UK CPI. UK inflation data is likely to support the pound: some sticky UK inflation data for July seems unlikely to change market sentiment regarding the Bank of England in the coming days. This should keep GBP/USD buying strong this week. The Bank of England cut interest rates by 25 basis points to 4% at its August 7th meeting, the first time in its 300-year history that two votes were required. Some policymakers expressed concern about rising inflationary pressures. Against this backdrop, given that the Bank's forecast points to 4% annual inflation in September, these data further reinforce the hawkish stance and cast doubt on the likelihood of further rate cuts. Subsequent data further supports the case for a more hawkish policy stance. Preliminary GDP data showed stronger-than-expected second-quarter growth, while lower-than-expected unemployment claims signaled economic resilience, strengthening support for a more hawkish BoE stance.
This week, GBP/USD's upward trend has temporarily stalled, but remains supported by the 100-day simple moving average of 1.3406 and the 1.3400 (round number) area. The 14-day relative strength index (RSI) on the daily chart is bullish but flat, suggesting the pair may trade sideways. A break above the August 18 high of 1.3565 could lead to a test of 1.3600. Otherwise, if GBP/USD holds above 1.3500, initial support lies at the 100-day SMA at 1.3406 and the 1.3400 (round-number mark) area, followed by the 20-day SMA at 1.3413. A retest of the 110-day SMA at 1.3363 is possible.
Consider a long position on GBP at 1.3442 today, with a stop-loss at 1.3430 and targets at 1.3500 and 1.3510.
USD/JPY
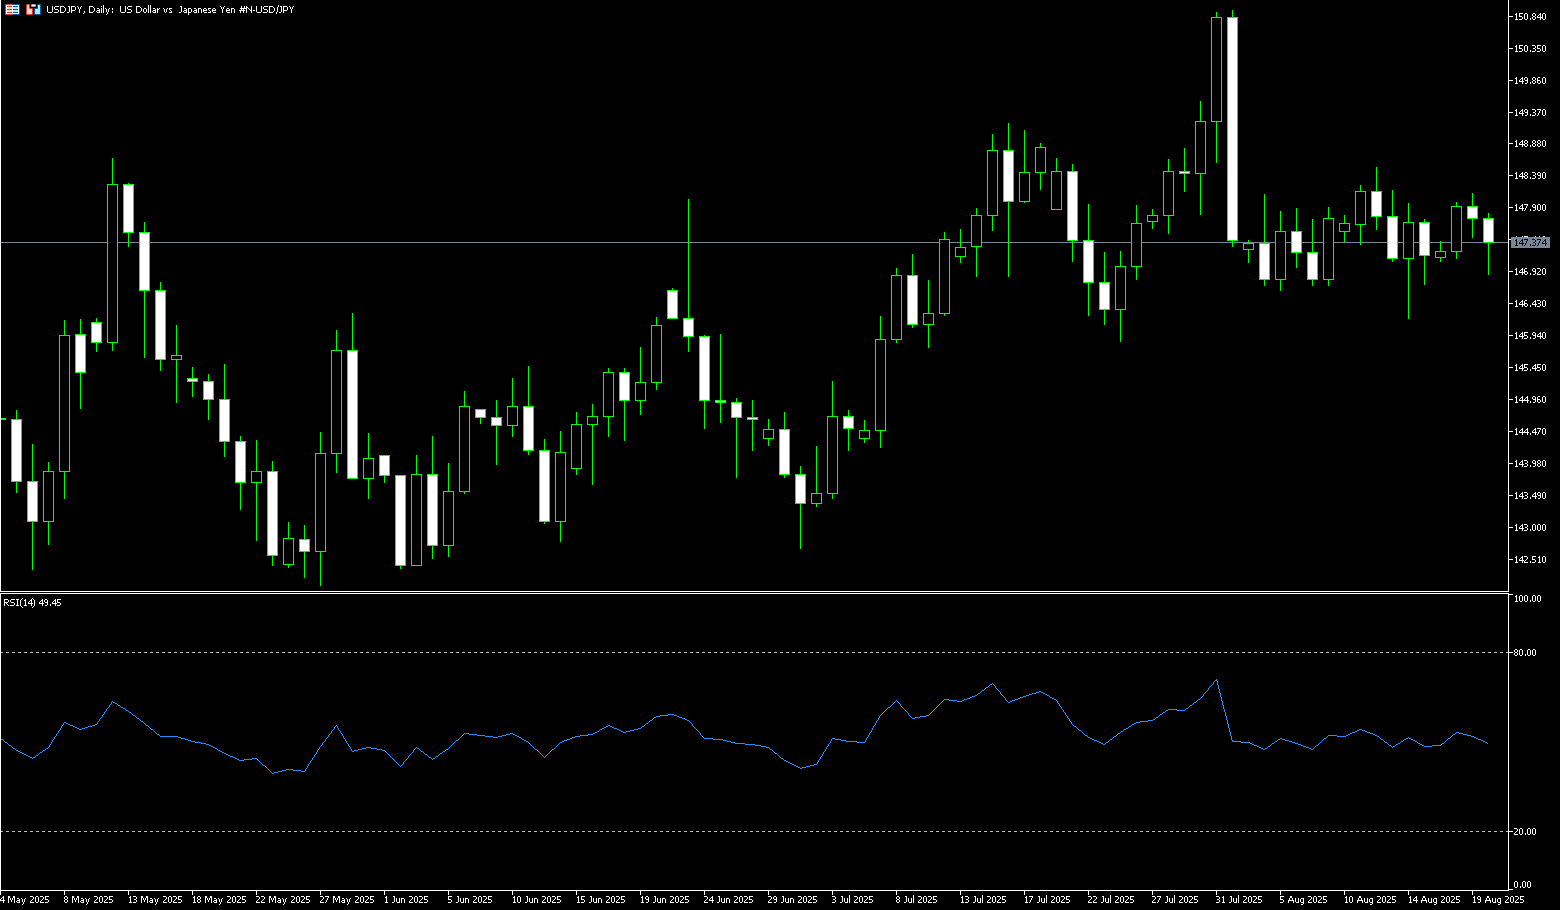
The yen rose to around 147.30 per dollar on Wednesday, extending gains from the previous session despite disappointing trade data. Exports fell 2.6% year-on-year in July, the biggest drop in more than four years, as widespread US tariffs hit overseas demand. Imports also fell 7.5%, the fourth contraction this year, but better than expectations for a 10.4% decline. Separately, data showed that Japan's core machinery orders—a leading indicator of capital expenditure—unexpectedly rose in June after two months of decline. On the policy front, the market remains divided over the Bank of Japan's next move, with officials sending conflicting signals. Governor Kazuo Ueda has maintained a cautious stance, emphasizing that "underlying inflation" remains below the BOJ's 2% target. The BOJ is expected to stick to its policy normalization path and raise interest rates before the end of the year. This, in turn, could limit the dollar's gains and help limit further losses in the low-yielding yen, especially ahead of the release of the FOMC minutes.
From a technical perspective, Tuesday's failure to find support above the 148.00 level appears to favor USD/JPY bears. However, the neutral oscillator on the daily chart warrants some caution. Furthermore, spot prices have been range-bound for the past two weeks or so. This further necessitates waiting for strong follow-through selling before positioning for any further depreciation. Meanwhile, the 147.10-147.00 area may act as immediate support, below which the pair could accelerate its decline, retesting the multi-week low of 146.20 reached last Thursday. Some follow-through selling below the 146.00 mark should pave the way for significant near-term downside. On the other hand, bulls may await sustained strength and confirmation above the 148.00 mark. USD/JPY could then climb to the next relevant resistance in the 148.55-148.60 area, or the 50% retracement of the decline from the monthly high, before aiming to recapture the 149.00 round number.
Consider shorting the USD at 147.55 today. Stop loss: 147.80, target: 146.50-146.40.
EUR/USD
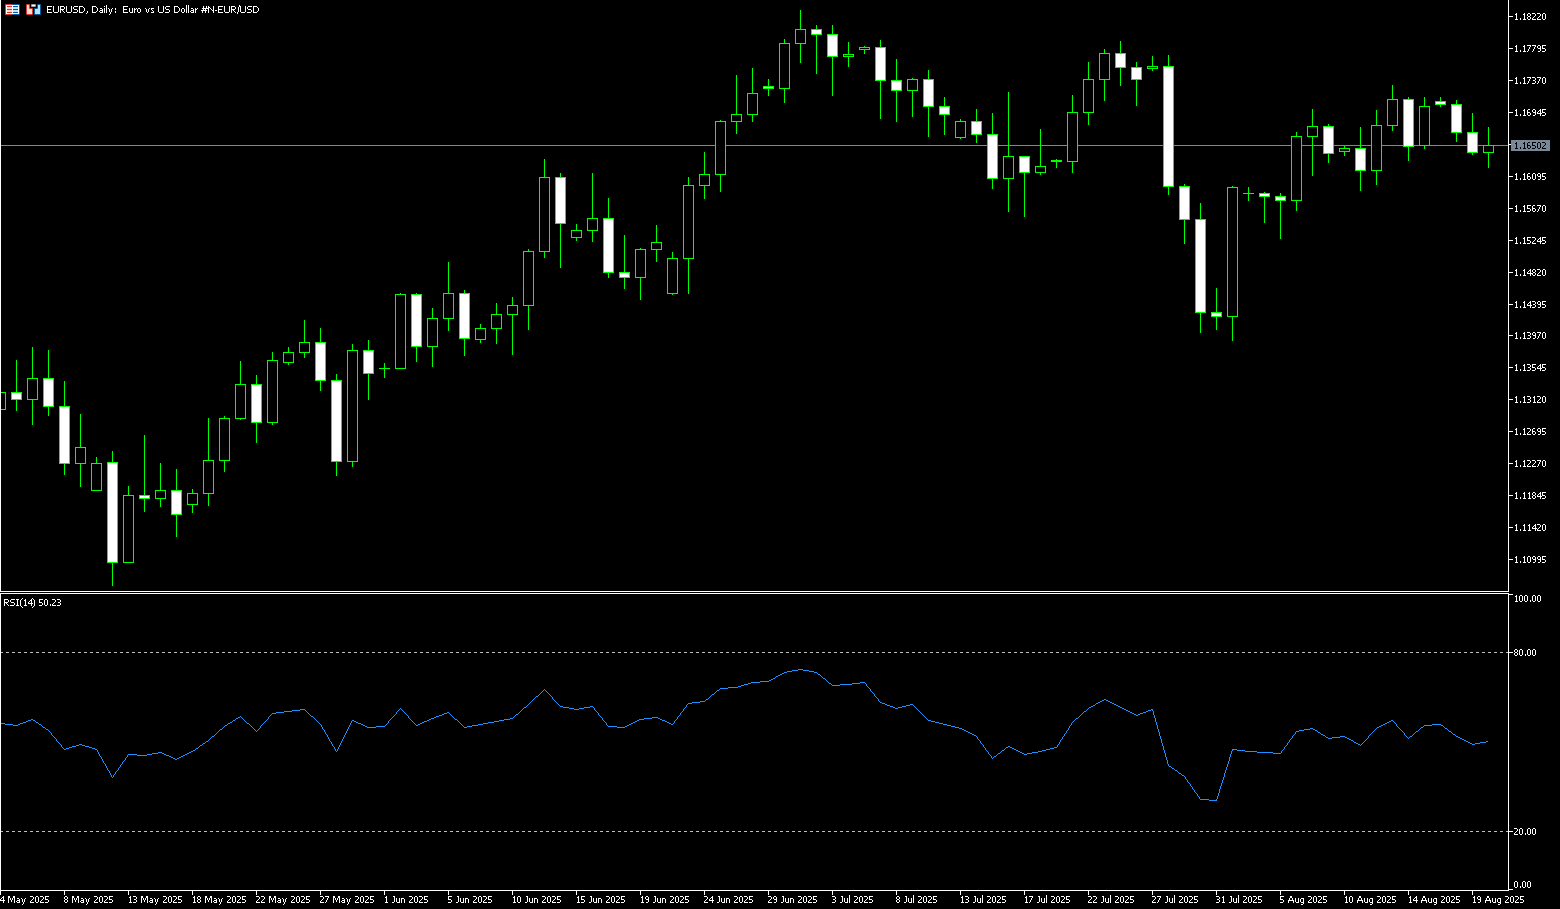
EUR/USD consolidated above 1.1650 during Wednesday's trading session, as investors awaited Federal Reserve Chairman Jerome Powell's speech at Jackson Hole and the outcome of the Ukraine-Russia conflict resolution. The US economic calendar saw the release of housing data on Tuesday, but investors reacted mutedly. Last week's consumer and producer inflation data sparked a two-way pricing in of a Federal Reserve rate cut. Meanwhile, Chairman Powell's speech on Friday could set the tone for the interest rate path in the second half of 2025. Furthermore, positive news regarding a possible de-escalation in the conflict between Ukraine and Russia could boost the euro in the event of a favorable outcome. Meanwhile, US President Donald Trump is pushing for a meeting between Zelensky and Putin to resolve their differences and achieve peace.
From a recent technical perspective, EUR/USD appears to have peaked, having hit a low of 1.1622 over the past three trading days, suggesting that buyers are losing momentum. From a momentum perspective, the 14-day relative strength index (RSI) remains bullish but close to its neutral line. A breakout would indicate that sellers are outperforming buyers. If EUR/USD breaks back above the 9-day SMA at 1.1660, the next resistance level will be 1.1700. A break below this level would target the July 24 high of 1.1788 and the psychologically important 1.1800 high. Conversely, a break below this week's low at 1.1622 and the 1.1600 round-figure area would push the price towards 1.1600, followed by the 70-day SMA at 1.1556.
Consider a long EUR at 1.1642 today, with a stop loss at 1.1630 and a target at 1.1695; 1.1700.
Disclaimer: The information contained herein (1) is proprietary to BCR and/or its content providers; (2) may not be copied or distributed; (3) is not warranted to be accurate, complete or timely; and, (4) does not constitute advice or a recommendation by BCR or its content providers in respect of the investment in financial instruments. Neither BCR or its content providers are responsible for any damages or losses arising from any use of this information. Past performance is no guarantee of future results.
更多報導


 English
 简体中文
简体中文
 繁體中文
繁體中文
 Bahasa
Melayu
Bahasa
Melayu
 Tiếng
Việt
Tiếng
Việt
 ไทย
ไทย
 日本語
日本語
 한국어
한국어
 ភាសាខ្មែរ
 español


