


0
US Dollar Index
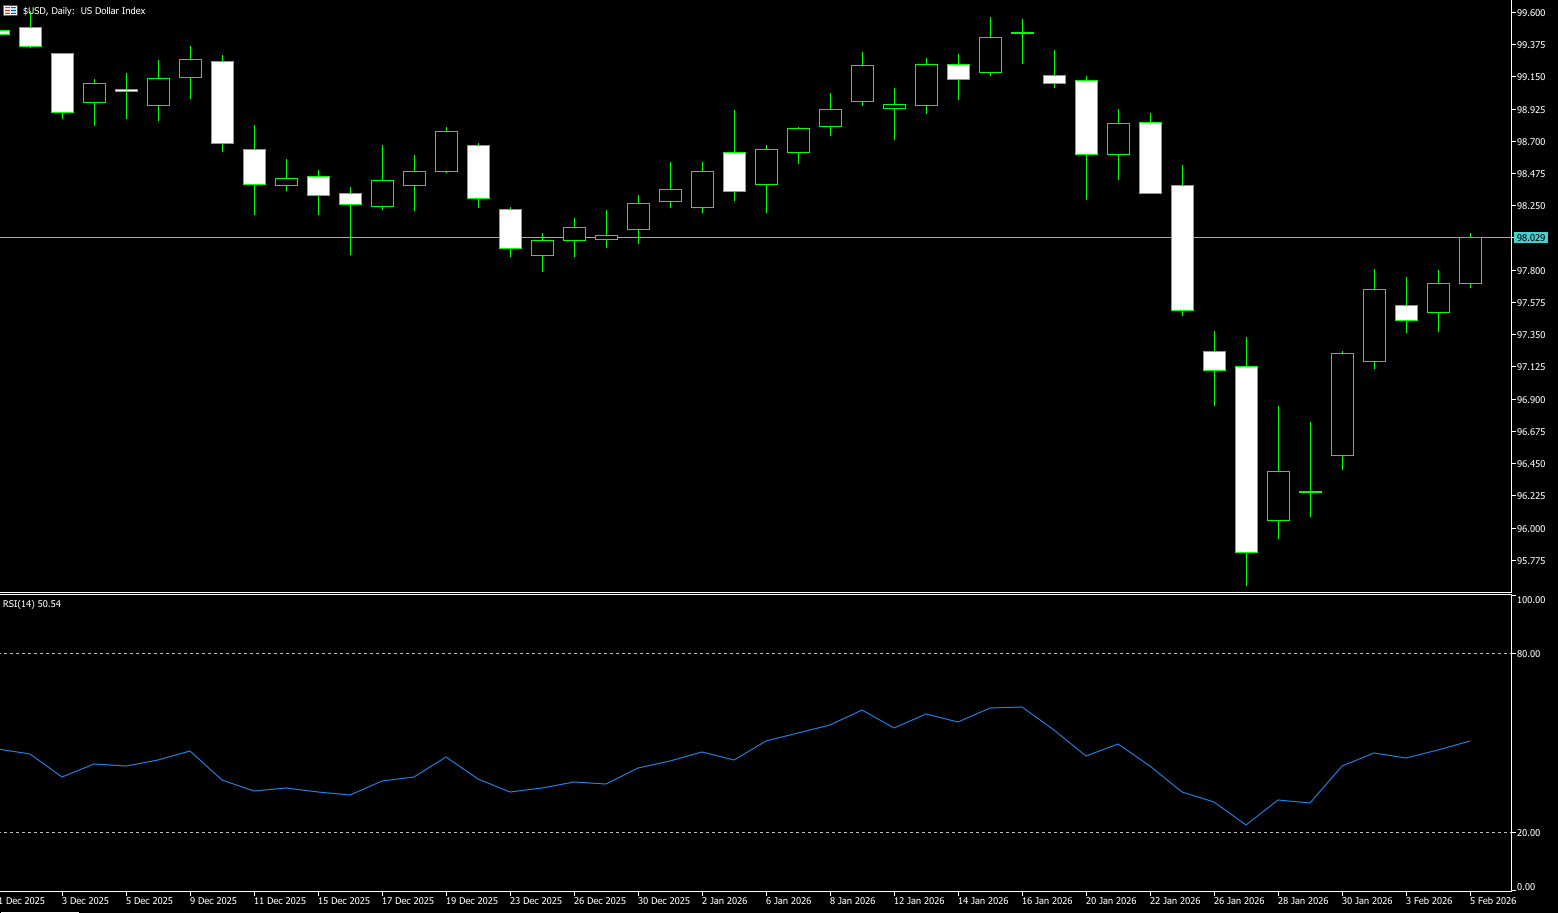
The US dollar index fluctuated slightly on Thursday, trading around 97.90, as renewed concerns about the health of the US economy and labor market, as well as high valuations for artificial intelligence, weighed on market sentiment. Latest data showed job openings unexpectedly fell to a 2020 low, January layoffs were the highest since 2009, and initial jobless claims rose to 231k, the highest level in two months, far exceeding the expected 212k. An ADP report showed private sector job growth was far below expectations, further increasing market caution. This series of weak labor data reinforced market expectations for a Federal Reserve rate cut, with the market still anticipating the first rate cut in June and a second likely in September. Meanwhile, the European Central Bank and the Bank of England kept interest rates unchanged as expected. The dollar rose sharply against the pound as traders interpreted the Bank of England's tone as more dovish. The dollar was little changed against the euro but weakened against the Swiss franc.
For the US dollar index, two key themes need to be focused on: first, the release of employment data; and second, changes in the yield curve and the shape of Treasury auctions. The continued rise in the US 10-year Treasury yield provides significant support for the dollar. Meanwhile, due to the significant volatility in gold, safe-haven funds are currently flowing into the dollar and US Treasuries. However, we must be wary of the risk of weakening momentum after short covering and the potential limits to any rebound under the long-term bearish outlook of institutions. Technically, the dollar's resilience despite negative factors, its position above and far from the upper limit of its trading range, and its position above and far from the 5-day and 10-day moving averages all indicate strong bullish momentum. It is highly likely that after a brief period of consolidation, the dollar will continue to rise. Therefore, upside targets include 98.00 (a psychological level) and 98.33 (the 50-day moving average). Support levels to watch are 97.31 (the low of February 4th) and the 97.00 (a psychological level).
Today, consider shorting the US Dollar Index around 98.03; Stop loss: 98.15; Target: 97.60; 97.50
WTI Crude Oil
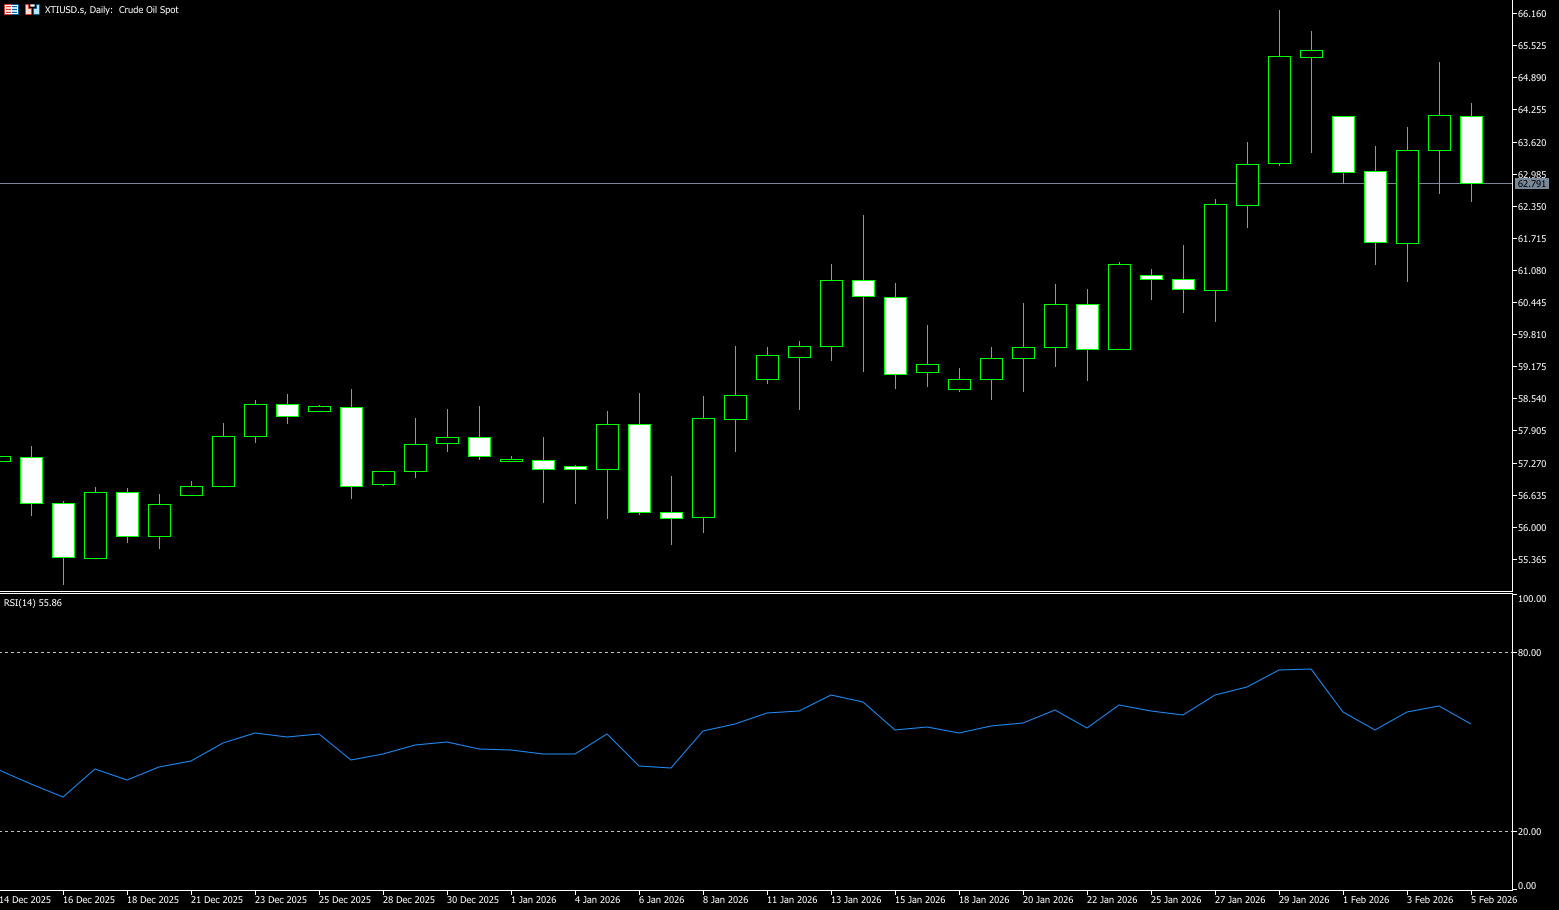
WTI crude oil fell more than 3% on Thursday to around $63 a barrel, ending a two-day winning streak, as easing geopolitical tensions and demand concerns pressured prices. Iran confirmed it would hold talks with the US in Oman on Friday, reducing the immediate risk of military conflict and the risk of potential supply disruptions from major OPEC producers. This news eased some of the geopolitical risk premium associated with the Middle East, which accounts for about one-third of global crude oil supply. Prices were also pressured by weak US private employment data, which reignited concerns about an economic slowdown and weakening fuel demand. Nevertheless, uncertainty remains regarding whether Washington and Tehran can bridge key differences, and some risk premium remains in the market. Traders are also watching developments in Ukraine after Russia escalated its attacks on energy infrastructure again, while the US and Russia have agreed to resume high-level military contacts.
From a daily chart perspective, WTI crude oil found significant support around $61 after a sharp drop at the beginning of the week, forming a fairly typical rebound. The price has climbed back above the $64 mark, indicating that buying interest at lower levels has begun to emerge, and short-term selling pressure has been somewhat released. From a technical perspective, WTI remains within a trading range. The previous rapid decline did not break the overall range structure, and this round of gains is more of a technical correction towards the lower edge of the range. The current area of $65.00 (psychological level) to $65.79 (upper Bollinger Band) constitutes a significant resistance zone for the short-term rebound. This area is both a previous area of concentrated trading and a key position where bulls and bears have repeatedly clashed. The $62.60 (Wednesday low) to $62.23 (14-day moving average) form an important short-term support zone, followed by the $61.41 (20-day moving average) level.
Today, consider going long on crude oil around 62.70; Stop loss: 62.55; Target: 63.90; 64.30
Spot Gold
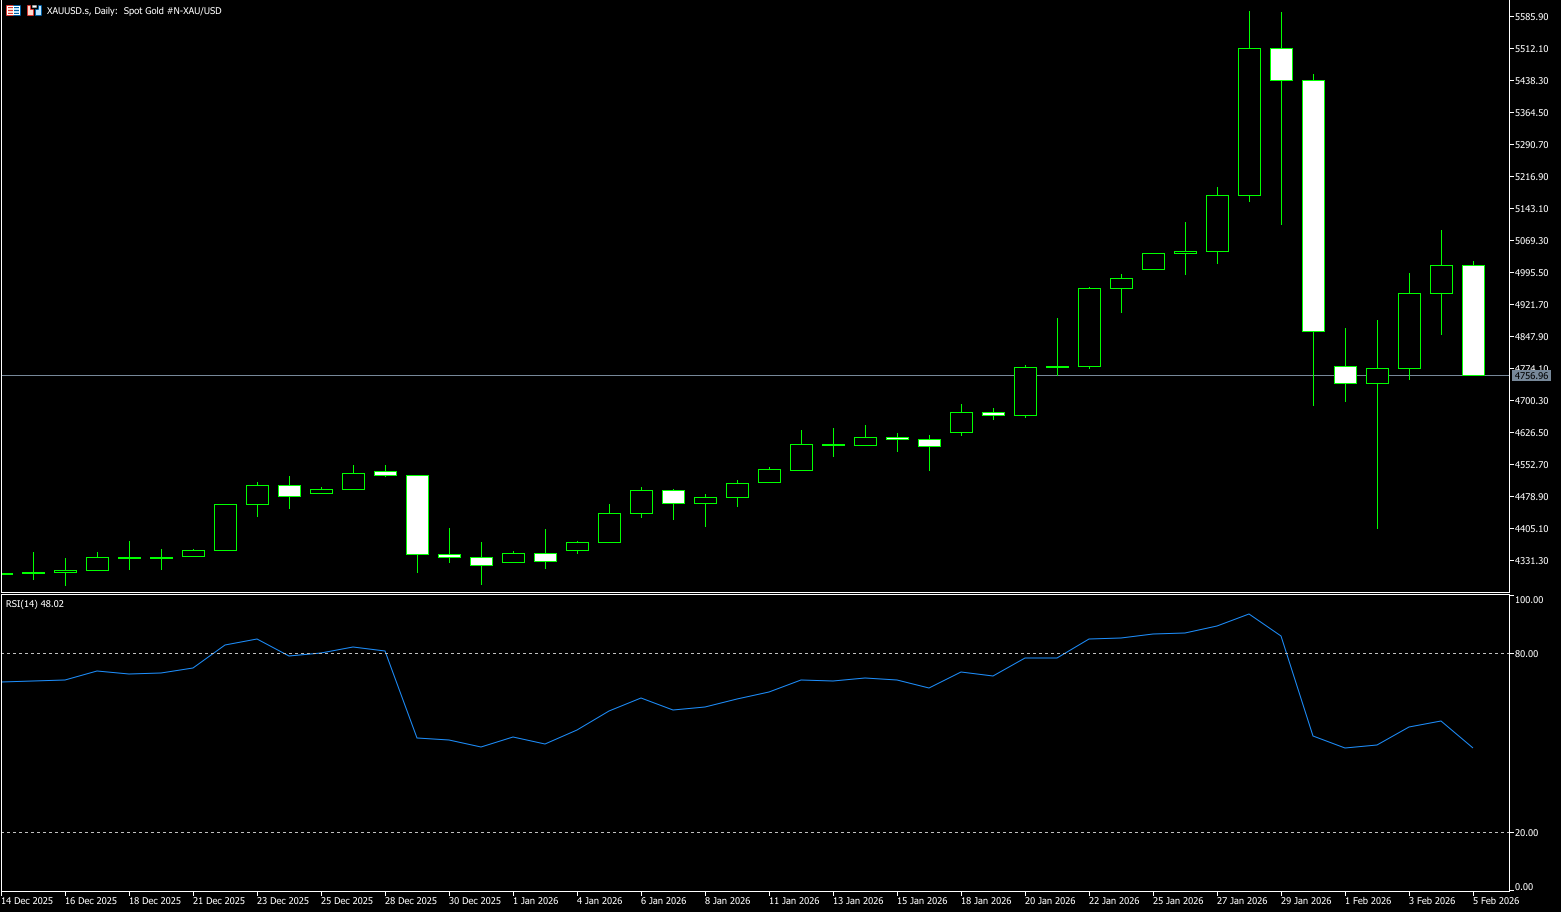
On Thursday morning, spot gold traded around $5,015 per ounce. Prices subsequently retreated after an initial surge, influenced by a strengthening US dollar index near a one-week high and profit-taking after the recent record rally. Amid increased volatility, gold and silver prices plummeted from record highs, but as market conditions stabilized and the dollar weakened, investors resumed buying these metals. This price decline was primarily driven by the unwinding of crowded speculative positions and forced liquidations, rather than a deterioration in macroeconomic or precious metal fundamentals. As market risk aversion eased, gold prices rebounded strongly: spot gold rebounded by over 6%, recovering some of its previous losses. This rebound indicates that the previous sell-off contained oversold components, and momentum trading and leveraged funds further amplified the decline. From a medium- to long-term perspective, this round of correction has completed position reallocation and squeezed out the excessive speculative bubble in the market.
Technically, last week gold formed a clear bearish "key reversal" pattern on the daily chart. This chart pattern suggests the market has reached a top. Gold prices formed an inverted hammer bearish candlestick pattern, which could turn into a "shooting star" pattern if the price action this week is bearish. Momentum measured by the 14-day Relative Strength Index (RSI) shows that although the index is in bullish territory, buyers are losing momentum. If gold closes below $4,900 on the daily chart, traders may expect a test of the $4,700 (psychological level) and $4,695 (30-day moving average), followed by the $46,900 level. Once the "shooting star" pattern is cleared, the bearish bias for gold in the short term will be confirmed. On the other hand, if gold prices break through the key resistance levels of $5,092.00 (Wednesday's high) and $5,100 (the psychological level), buyers may retest the $5,200.00 level.
Consider going long on gold today around 4,760; Stop loss: 4,750; Target: 4,850; 4,900
AUD/USD
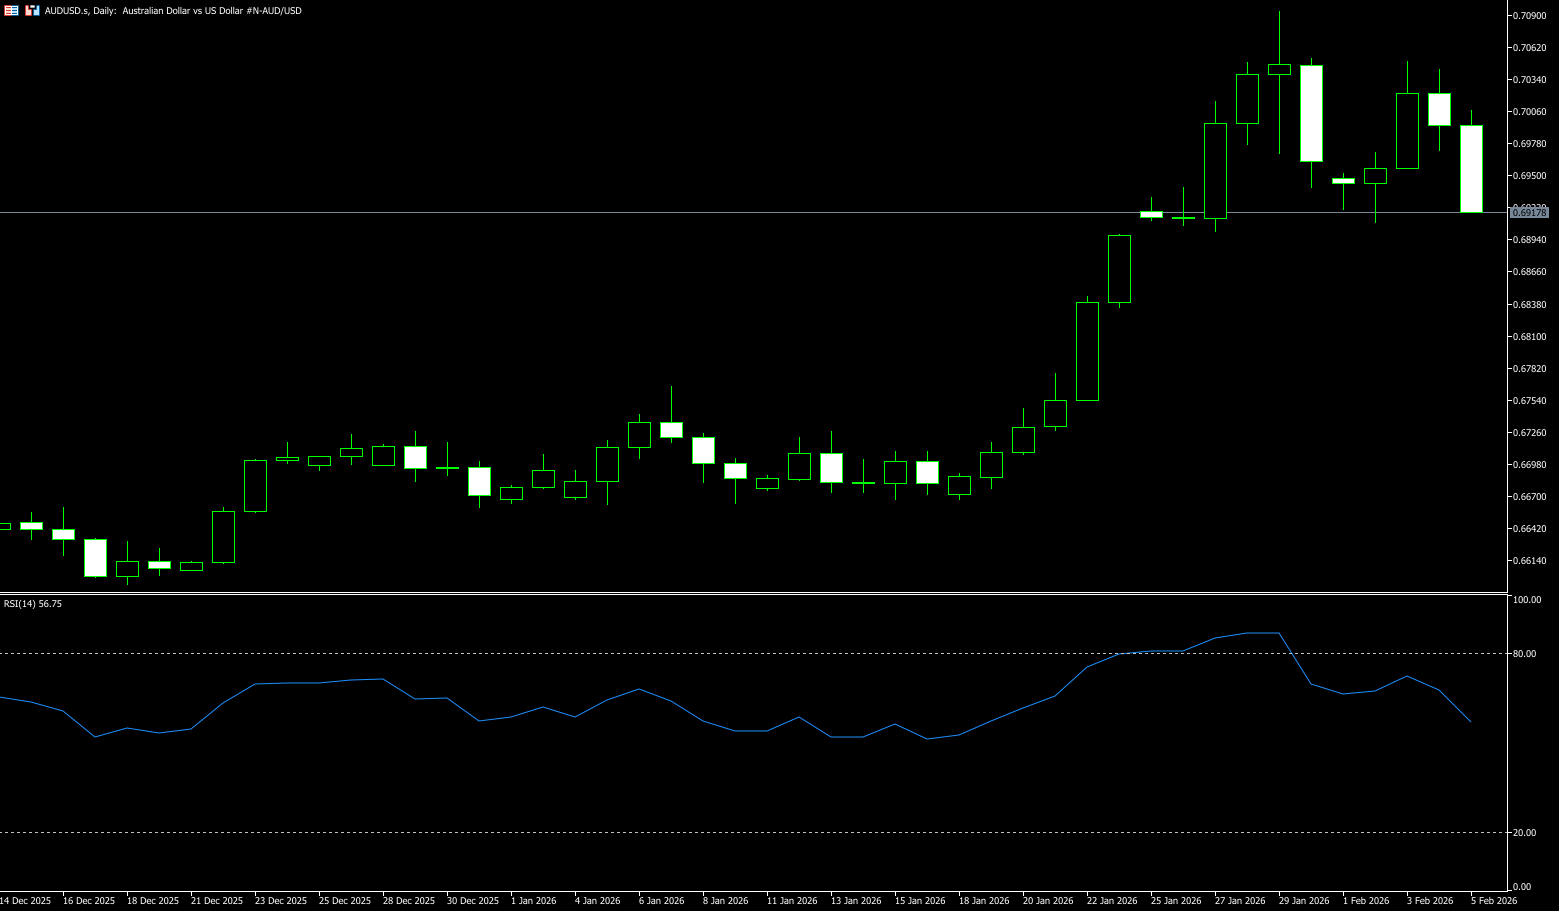
The Australian dollar held steady around US$0.6940 on Thursday, near a three-year high, supported by the Reserve Bank's hawkish policy outlook and strong trade balance data. Data showed the country's trade surplus widened to A$3.37 billion in December 2025, up from a three-month low in November and slightly above market expectations. The improvement was driven by a rebound in exports, strong year-end shipments of metal ores and minerals, and imports falling to a three-month low. The Australian dollar has also been supported since the central bank raised interest rates by 25 basis points to 3.85% at its February meeting, with the possibility of further tightening remaining. The market anticipates an 80% probability of an interest rate hike at the May policy meeting, and a 50% probability of rates reaching 4.35% by the end of the year. Furthermore, the Australian dollar rose to a 35-year high against the Japanese yen, while the US dollar generally strengthened as the market anticipates the Federal Reserve may slow its pace of rate cuts.
The Australian dollar/US dollar pair traded slightly weaker on Thursday. The pair lost ground as market expectations for Fed policy shifted following US President Donald Trump's nomination of former Fed Governor Kevin Warsh as Fed Chair last week, leading to a stronger US dollar. If data is better than expected, the Australian dollar could rise, with the first upside resistance level at the February 3 high of 0.7050. The next resistance level is at the January 29 high of 0.7094, with further resistance targeting the January 26, 2023 high of 0.7142. On the downside, the February 3 low of 0.6900 will provide some support for buyers. Further declines could lead to a drop to the January 23 low of 0.6834.
Consider going long on the Australian dollar around 0.6920 today; Stop loss: 0.6910; Target: 0.6970; 0.6980
GBP/USD
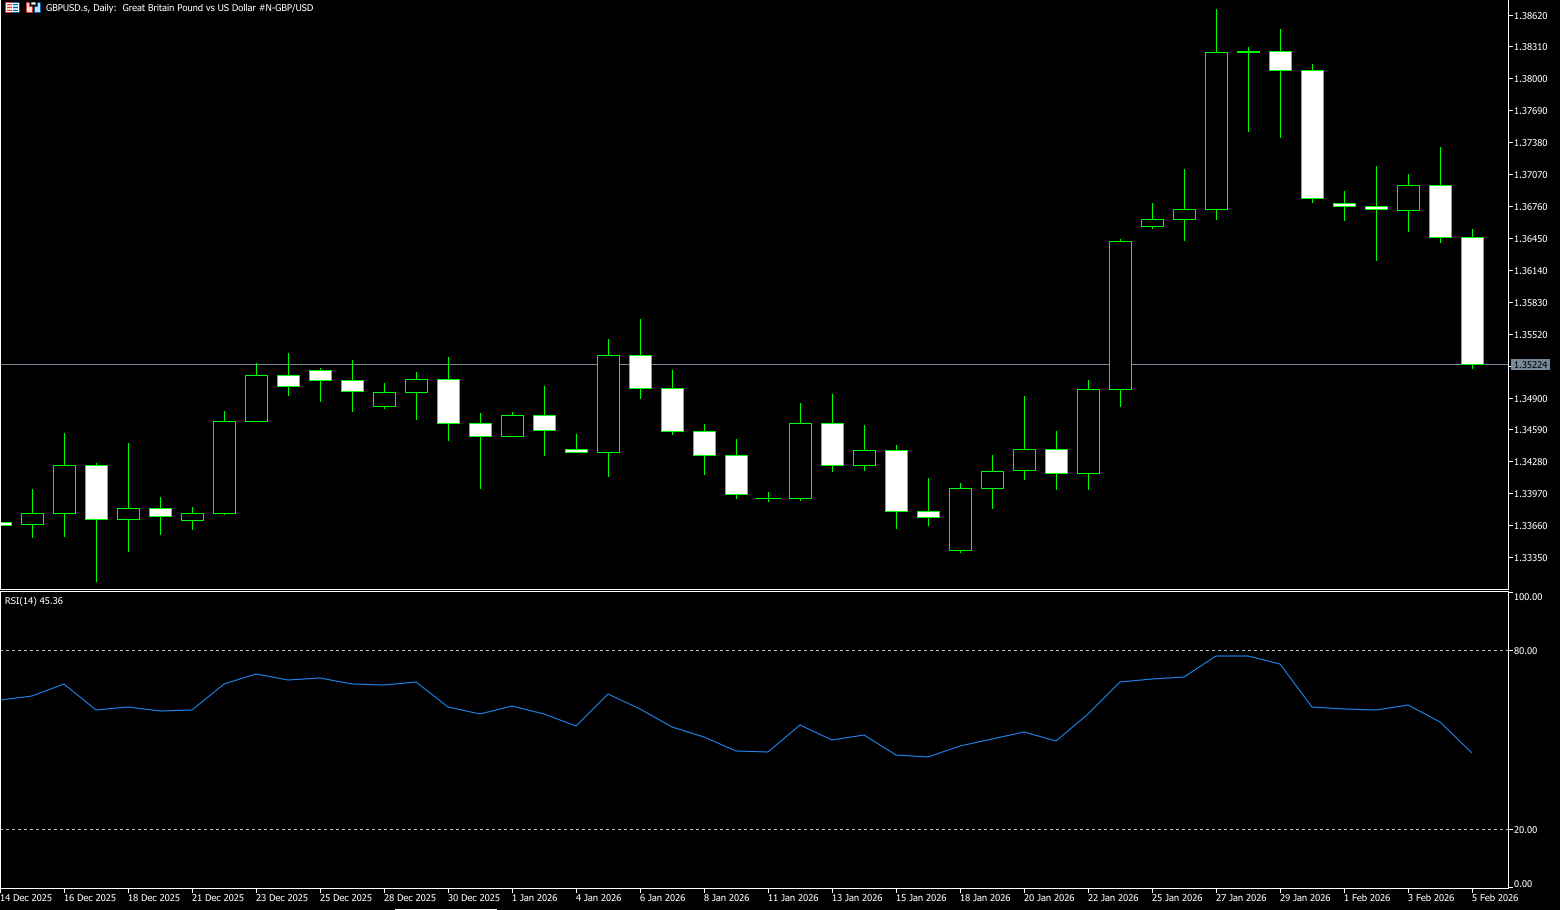
The pound fell sharply against the dollar on Thursday after the Bank of England decided to keep interest rates unchanged but opened the door to further easing, a move seen as a "dovish stance." Weaker-than-expected US jobs data failed to prevent the pound/dollar from falling, trading at 1.3529, down 0.90%. However, with the dollar's recent corrective rebound, the pound's upside potential is being squeezed. The market's focus is now shifting from simple exchange rate fluctuations to the cross-validation of a series of key economic data and central bank policy moves. In particular, marginal improvements in a series of US economic indicators have fueled market expectations that the Federal Reserve will maintain higher interest rates for a longer period, providing support for the dollar. In the UK, although the composite forward-looking economic index performed strongly, fueling speculation that the Bank of England might take a hawkish stance, overall inflation and employment data did not deviate significantly from expectations, limiting the room for policy adjustments. Therefore, whether the pound can maintain its strength increasingly depends on changes in the external environment.
From a technical chart perspective, the pound/dollar pair previously surged to a high of 1.3867, but failed to hold and quickly retreated, indicating strong resistance above. The current price is in the middle range after the previous high and subsequent pullback, a typical battleground between bulls and bears. Strong resistance lies around 1.3645 (the 5-day moving average) and 1.3600 (a psychological level). Without strong fundamental catalysts, a breakout could be a false breakout. On the downside, the key level to watch is 1.3500, which has shown strong support during multiple pullbacks and is a crucial dividing line for determining whether the trend has reversed. If 1.3500 (the psychological level) is effectively broken, the short-term price may further decline to the structural support zone near the 50-day moving average low of 1.3468, and market sentiment will likely turn pessimistic.
Consider going long on GBP/USD around 1.3523 today; Stop loss: 1.3510; Target: 1.3580; 1.3590
USD/JPY
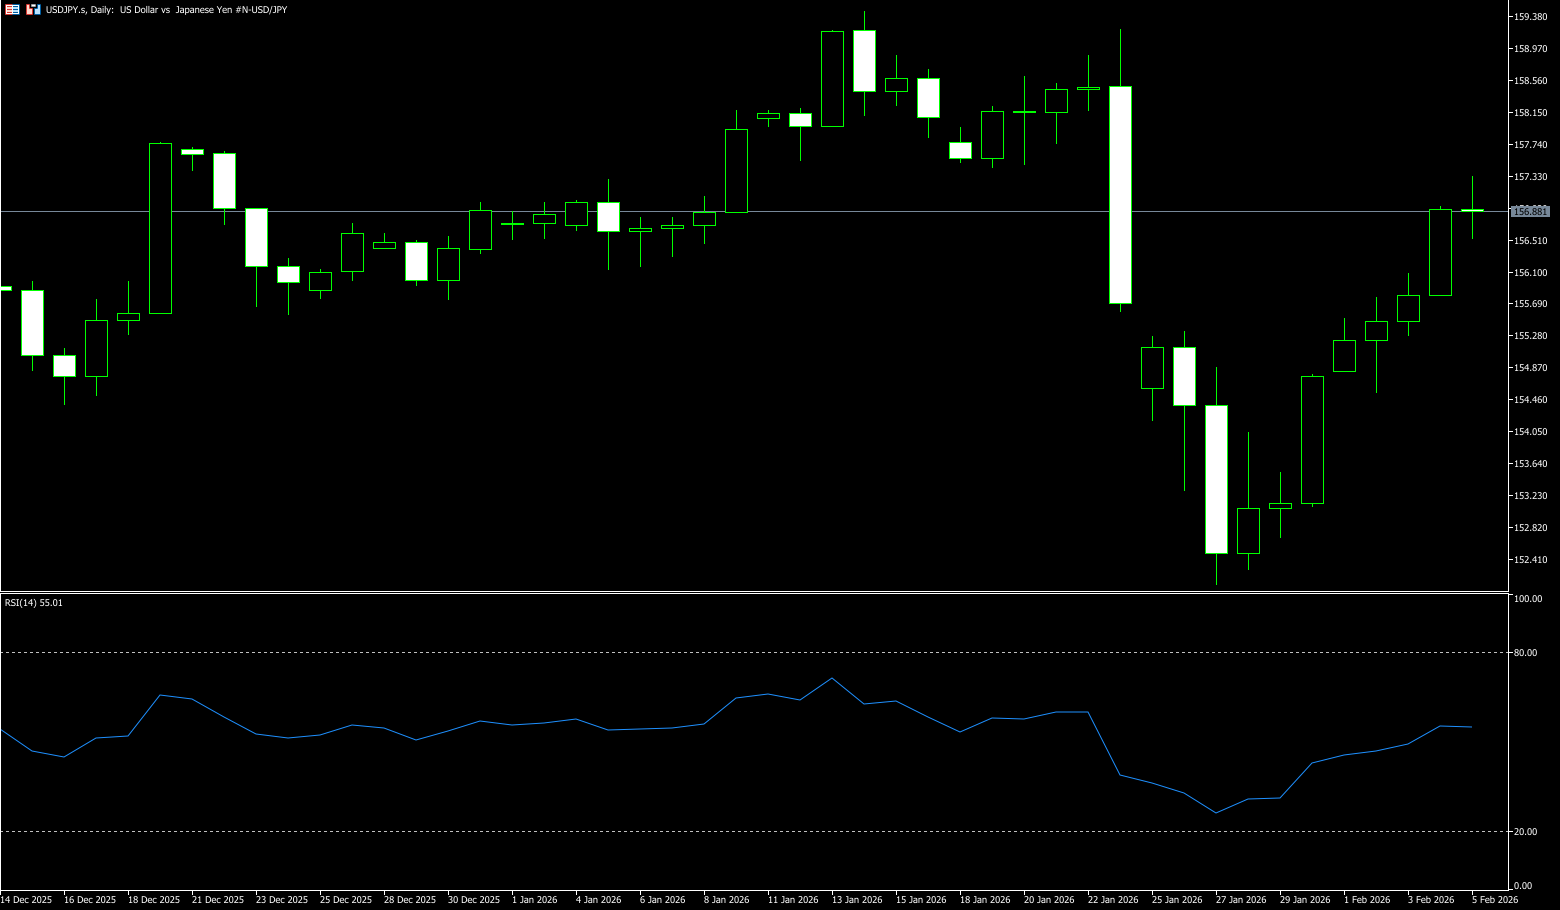
USD/JPY extended its rebound on Thursday above 157. The yen weakened to a two-week low against the dollar due to concerns about the fiscal health under Japanese Prime Minister Fumio Kishida's expansionary spending policies. Traders will be closely watching Japan's provisional election scheduled for Sunday. His expansionary fiscal policies have sparked concerns about Japan's fiscal outlook, as worries about debt financing spending have weakened the yen and created a tailwind for the pair. Markets remain wary of potential intervention by Japanese authorities. Japanese Finance Minister Katayama said on Tuesday that she will continue to coordinate closely with US authorities in accordance with the joint statement issued last September and respond as appropriate. Intervention concerns could boost the yen in the short term and act as resistance for the pair. On the dollar side, market expectations that Trump's nominee for Federal Reserve chairman will favor maintaining high interest rates could boost USD/JPY in the short term.
The USD/JPY pair extended its winning streak, rising to near the 157 level for the fourth consecutive trading day. Short-term bulls are strong, but overbought risks are high. The medium-term upward trend remains intact, but a pullback from higher levels should be watched for, as the battle between bulls and bears intensifies. The daily chart broke through the 20-day moving average at 156.62, indicating a technical rebound after the previous correction, but it hasn't fully turned into a strong trend. The 157.50-157.74 level (the high from last December) is a key resistance, representing a previous area of dense trading. A decisive break above this level on the daily chart is needed to open up further upside potential to the psychological level of 158. The RSI is rising but not extremely overbought, indicating that bullish momentum remains but its strengthening is slowing, suggesting a potential period of consolidation. Short-term bulls have the upper hand, but consolidation at higher levels may digest the gains. The battle between bulls and bears focuses on the 157.00 level; a break and hold above 157.00 on the daily chart is needed to confirm a trend reversal. USD/JPY is expected to continue its technical correction after remaining below 157.00. A break above 156 would likely see a test of 155.30 (the low at the beginning of the week).
Consider shorting USD around 157.20 today; Stop loss: 157.40; Target: 156.20; 156.30
EUR/USD
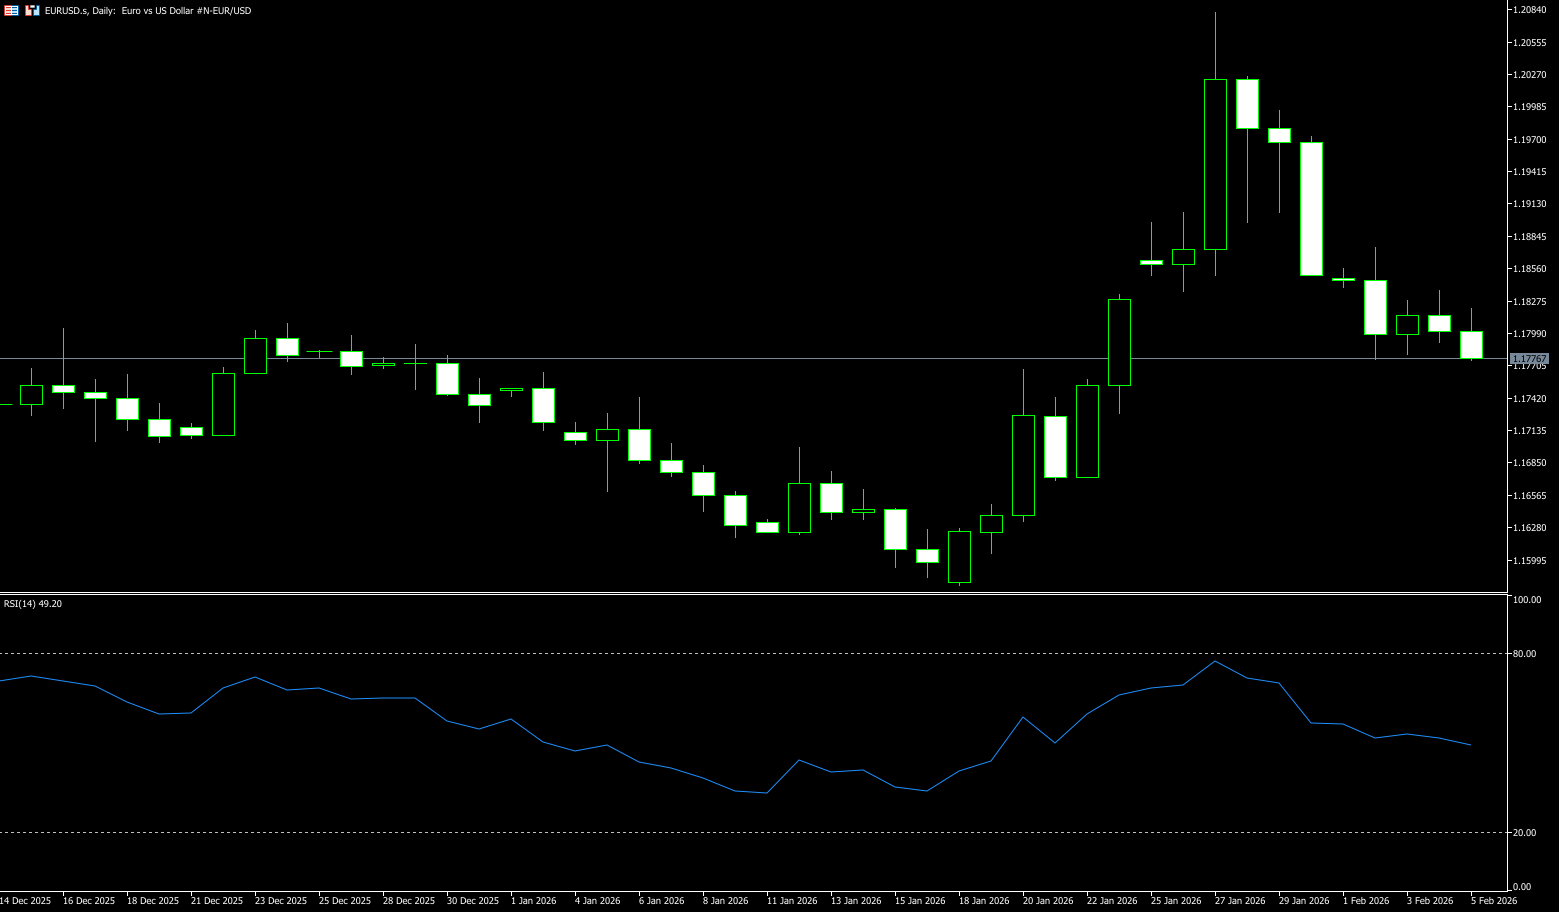
EUR/USD remained slightly below 1.1800 during Thursday's trading session. The pair is awaiting new momentum from the European Central Bank's interest rate decision after Eurozone inflation fell significantly below the central bank's 2% target. The current steepening yield curve in the European bond market directly impacts euro trading strategies: short-term yields have risen slightly with expectations of economic recovery, while long-term yields have risen sharply due to rising expectations of increased German bond issuance, creating a widening spread between short and long-term yields. The strength of external bonds will also indirectly boost risk appetite for the euro. Furthermore, the prevalence of a steepening yield curve strategy will provide short-term support for the euro through yield spreads. Regardless of short-term fluctuations or a medium-term recovery, euro trading needs to be wary of three major downside risks: firstly, a renewed escalation of trade conflicts will suppress the euro; secondly, vulnerabilities in the financial sector could trigger risk aversion, leading to a sell-off of the euro; and thirdly, further appreciation of the euro would be the biggest potential pitfall for its medium-term trend.
Since the dollar has recently largely priced in the end of the government shutdown, and the hawkish Fed chair successor's announcement that the dollar may begin to decline, the euro has seen a slight rebound. Technically, the euro has recently undergone a significant correction, once pulling back to 1.1765 (the 20-day simple moving average), which is considered a weak correction. Currently, it is relying on the original upward trend line, but the euro may find it difficult to maintain its recent high exchange rate. Therefore, the ECB is likely to keep interest rates unchanged, as if the exchange rate cannot remain high for an extended period, there will be no deflationary pressure. The euro/dollar pair is expected to fluctuate between 1.1765 and 1.1850 this week. The upside resistance level to watch is 1.1830, and a breakout above 1.1880 with significant volume would increase the probability of a stronger move towards the 1.1900 level. Conversely, a break below 1.1765 (the 20-day simple moving average) would present a further downside. The next key support level is at 1.1700 (the psychological level).
Consider going long on the Euro today near 1.1765; Stop loss: 1.1750; Targets: 1.1820, 1.1830
Disclaimer: The information contained herein (1) is proprietary to BCR and/or its content providers; (2) may not be copied or distributed; (3) is not warranted to be accurate, complete or timely; and, (4) does not constitute advice or a recommendation by BCR or its content providers in respect of the investment in financial instruments. Neither BCR or its content providers are responsible for any damages or losses arising from any use of this information. Past performance is no guarantee of future results.
Lebih Liputan


Pendedahan Risiko:Instrumen derivatif diniagakan di luar bursa dengan margin, yang bermakna ia membawa tahap risiko yang tinggi dan terdapat kemungkinan anda boleh kehilangan seluruh pelaburan anda. Produk-produk ini tidak sesuai untuk semua pelabur. Pastikan anda memahami sepenuhnya risiko dan pertimbangkan dengan teliti keadaan kewangan dan pengalaman dagangan anda sebelum berdagang. Cari nasihat kewangan bebas jika perlu sebelum membuka akaun dengan BCR.
BCR Co Pty Ltd (No. Syarikat 1975046) ialah syarikat yang diperbadankan di bawah undang-undang British Virgin Islands, dengan pejabat berdaftar di Trident Chambers, Wickham’s Cay 1, Road Town, Tortola, British Virgin Islands, dan dilesenkan serta dikawal selia oleh Suruhanjaya Perkhidmatan Kewangan British Virgin Islands di bawah Lesen No. SIBA/L/19/1122.
Open Bridge Limited (No. Syarikat 16701394) ialah syarikat yang diperbadankan di bawah Akta Syarikat 2006 dan berdaftar di England dan Wales, dengan alamat berdaftar di Kemp House, 160 City Road, London, City Road, London, England, EC1V 2NX. Entiti ini bertindak semata-mata sebagai pemproses pembayaran dan tidak menyediakan sebarang perkhidmatan perdagangan atau pelaburan.

 English
 简体中文
简体中文
 繁體中文
繁體中文
 Bahasa
Melayu
Bahasa
Melayu
 Tiếng
Việt
Tiếng
Việt
 ไทย
ไทย
 日本語
日本語
 한국어
한국어
 ភាសាខ្មែរ
 español