


0
US Dollar Index
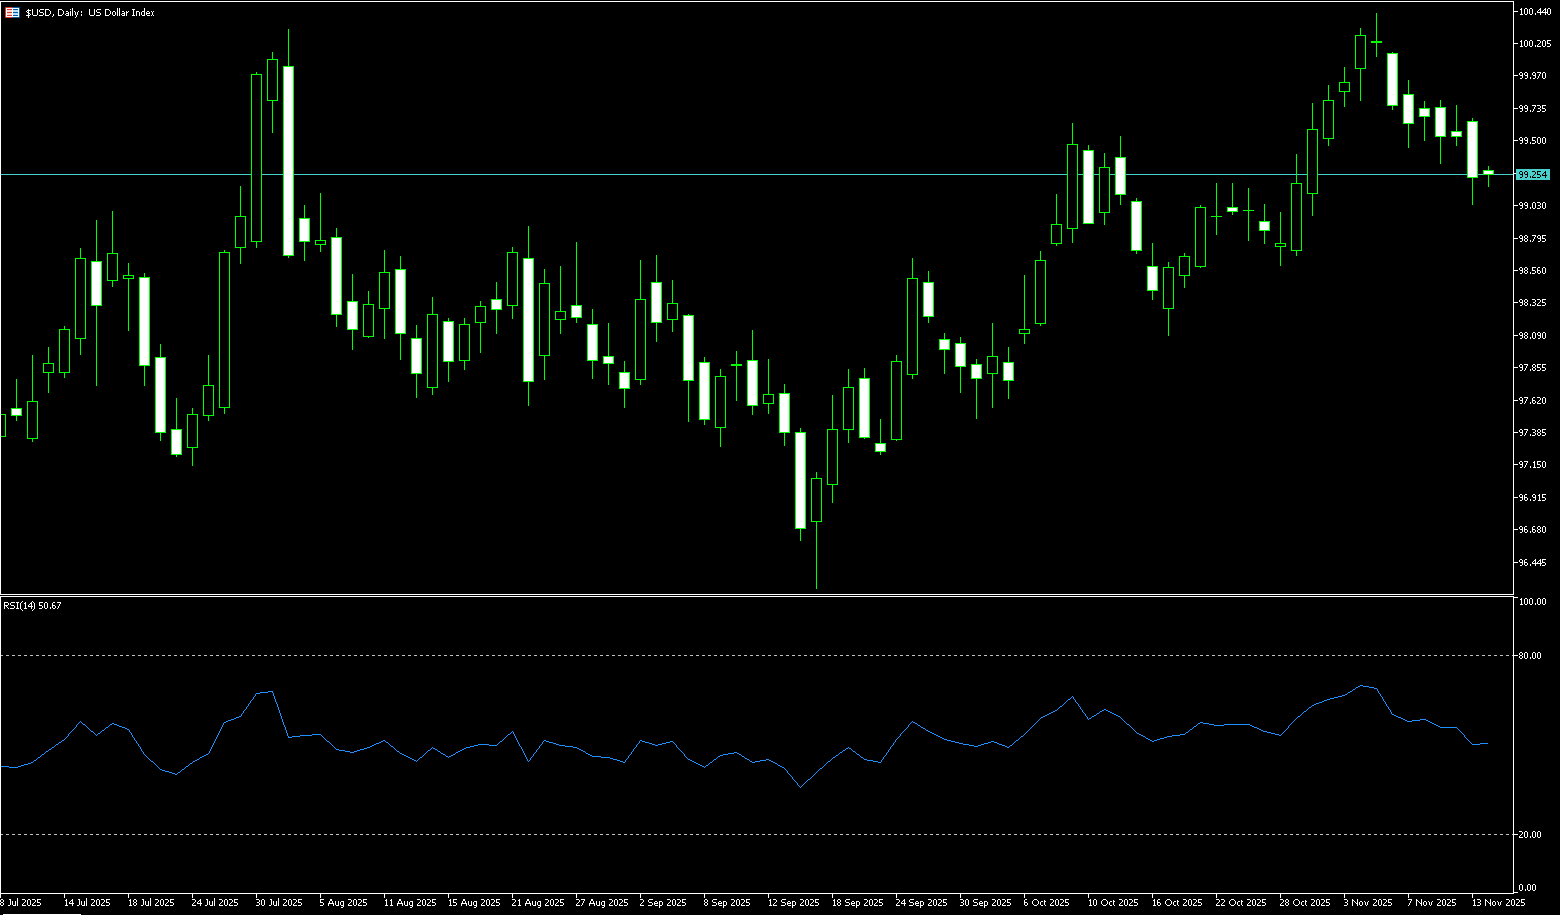
The US dollar index hovered above 99.40 on Monday, marking its second consecutive weekly decline, amid concerns that a backlog of data following the reopening of the US government could reveal an economic slowdown. The weak performance of the US economy also provided strong support for non-dollar currencies. Despite statements from senior Federal Reserve officials, including St. Louis Fed President Mossalim and Cleveland Fed President Hammark, indicating that inflation risks remain and hinting that the Fed may maintain high interest rates, the dollar failed to receive significant support. With the US data release window temporarily closed, the market remains cautious about the dollar's direction. The dollar index has declined for several consecutive days, and some analysts believe this weakness may continue until the end of the year, further boosting the euro. However, due to the continued uncertainty surrounding the Fed's policy direction, market sentiment towards the dollar remains complex, and the long-term trend of the dollar remains unclear.
Given the uncertainty surrounding upcoming US economic data and the conflicting signals from Fed officials, the dollar index is likely to continue its short-term oscillation within the range of 98.58 (50-day simple moving average) and 99.74 (last week's high). The 14-day Relative Strength Index (RSI) on the daily chart is slightly above 50, indicating a lack of clarity in the short-term direction. Trend assessment: Currently, there is no clear trend direction; the market is in a range-bound state and may be influenced by data release risks and speculation about the Fed's interest rate path in the short term, exhibiting a consolidation trend. Support levels: The first target is the psychological level of 99, while key support lies at the 50-day moving average of 98.58. A sustained break below this level could trigger a deeper correction. Resistance levels: The key short-term pivot point is 99.74 (last week's high). A successful retest of this level could trigger a short-term rebound, targeting the psychological level of 100.
Today, consider shorting the US Dollar Index around 99.65; Stop loss: 99.77; Target: 99.15; 99.05
WTI Crude Oil
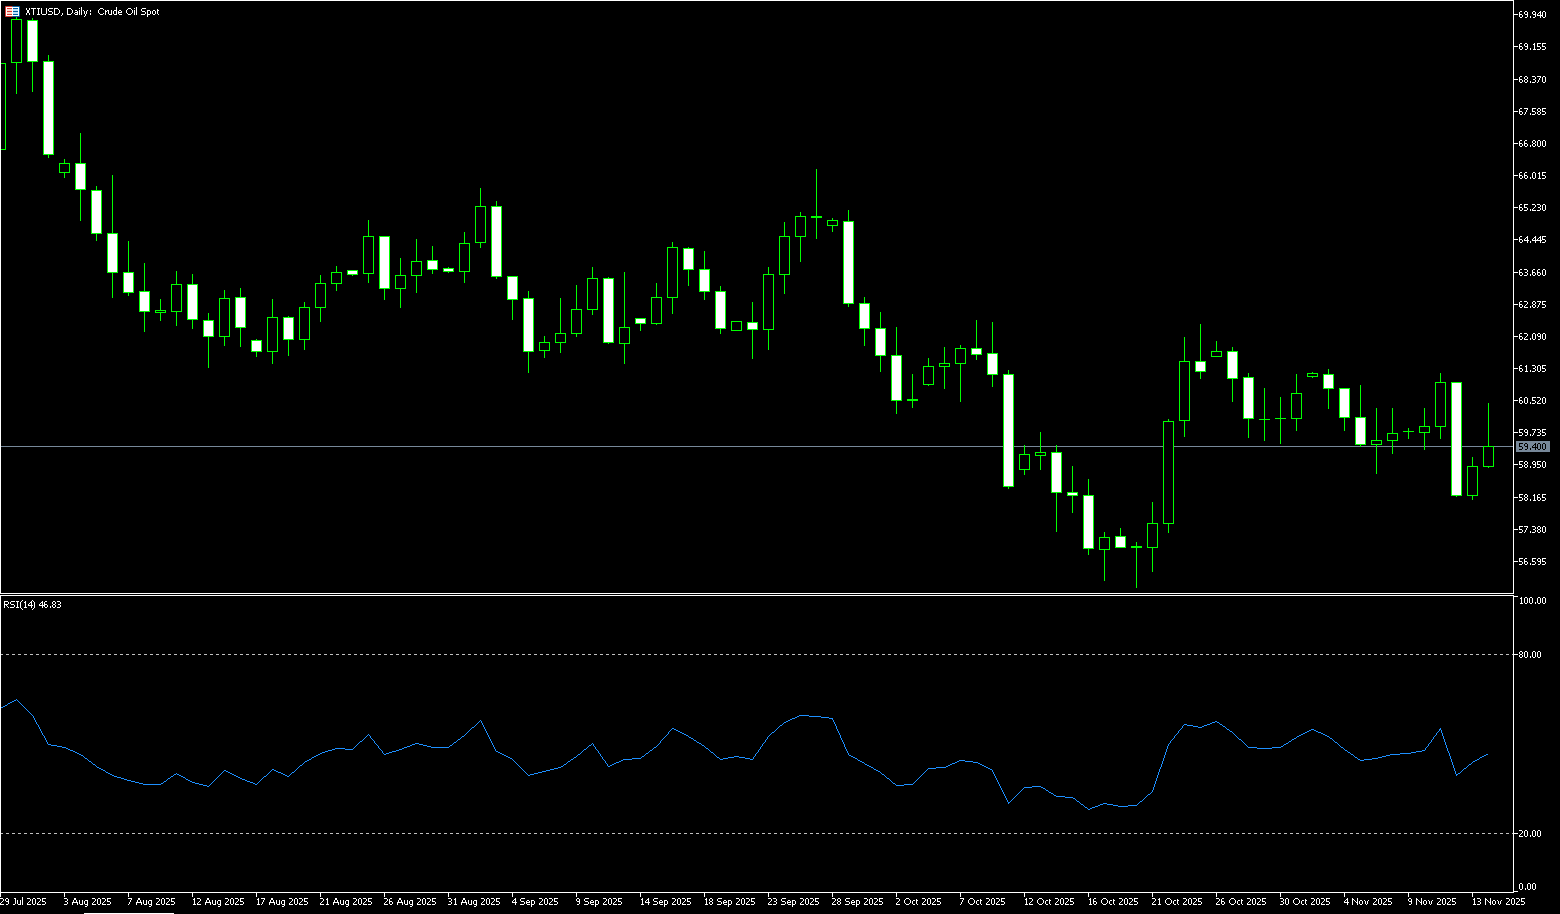
WTI crude oil traded around $59.60 per barrel on Monday. Influenced by geopolitical risks, international oil prices surged by over 2% on Friday after Russia stated that Russia and the US remained in contact regarding a summit. The main driver of this price increase was the Ukrainian drone attack on Russian energy infrastructure. The attack forced the port of Novorossiysk to suspend oil exports, which amount to 2.2 million barrels per day, accounting for 2% of global supply. Market analysts assessed the attack as large-scale and far-reaching, significantly exacerbating market concerns about supply disruptions. Furthermore, investors are closely watching the impact of Western sanctions on Russian oil supply and trade flows. The US has imposed sanctions to pressure the Kremlin, prohibiting transactions with Lukoil and Rosneft. On the other hand, data shows an increase in the number of US oil drilling rigs, indicating a potential rise in future US crude oil production, which could limit oil price increases to some extent.
Looking at the overall structure of the daily chart, US crude oil has been in a substantial downtrend since its September high of $66.19. The price action clearly outlines a bear-dominated market pattern, with consecutive bearish candlesticks and progressively lower highs and lows forming a typical descending channel. This pullback stabilized temporarily after touching the October low of $55.97, followed by a corrective rebound, and is currently trading slightly below $60. Examining the support and resistance levels, oil prices are currently sandwiched between several key price levels. The recent low of $55.97 forms the primary support level, which has been tested multiple times without a decisive break, demonstrating strong support. Before this level, the previous low of $58.12 should be monitored. On the upside, the psychological level of $60.00 is the first resistance level that must be broken in the near term. If the price can hold above this level, then $61.49 (65-day simple moving average) will strengthen the short-term bullish bias and push oil prices to challenge the key resistance zone of $62.38 (October 24 high) and the $62.36 level where the 85-day moving average is located.
Today, consider going long on WTI crude oil around $59.55; Stop loss: $59.40; Target: $60.70; $61.00
Spot Gold
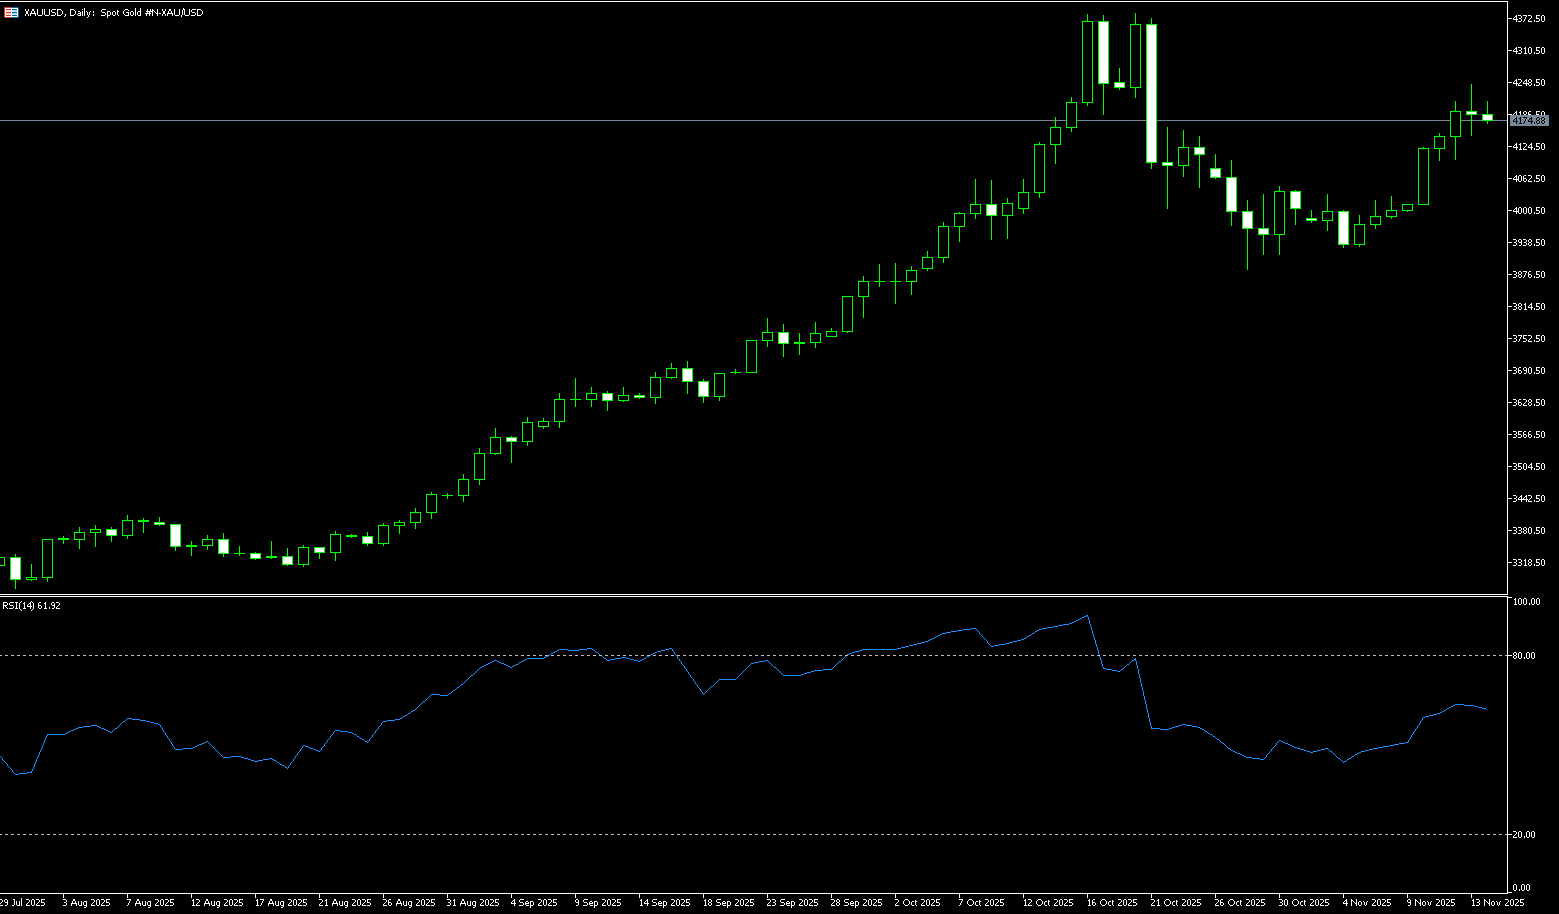
During the US session on November 17th, spot gold traded around $4,050 per ounce. Gold prices were weighed down by hawkish comments from Federal Reserve officials, significantly reducing the probability of a December rate cut. However, geopolitical tensions early this week may boost gold prices, as the US Army Secretary stated that preparations are made for military action against Venezuela. Last week's "thrills" in the gold market were essentially a double "stress test" of Fed policy uncertainty and a data vacuum. From the optimistic bottoming out at the beginning of the week to the 2% plunge last Friday, gold prices, while holding onto a 2% gain, are now far from last month's record high. The "chill" of hawkish rhetoric has halved the probability of a December rate cut, and the interconnected effects in the bond and currency markets have further amplified the risks. Meanwhile, the lingering effects of the government shutdown have made this week's data a "Sword of Damocles" hanging over the bulls. However, as analysts have said, this is merely a "breathing room" in a long bull market. Gold's structural appeal—continuous central bank hoarding, geopolitical concerns, and the essential need for global diversification—is far from being shaken by short-term fluctuations. Investors should remain calm, buy on dips, and wait for this week's "data feast" to clear the clouds.
Earlier last week, gold prices consolidated around the psychological level of $4,000, then broke out of the previous consolidation range and surged. However, the rally was capped at the $4,200-$4,250 resistance zone, where bears re-entered and took control of the short-term trend, pushing prices back above $4,000 in the latter half of the week. However, it's now far from last month's record high of $4,381. Momentum indicators on the daily chart show signs of cooling, with the 14-day Relative Strength Index (RSI) falling back to near 50, indicating a weakening of bullish momentum after the recent surge. On the downside, the psychological level of $4,000 provides immediate support; a sustained break below this level could trigger a pullback towards the $3,950 level. On the upside, a decisive break above $4,078 (the 9-day simple moving average) is needed to restart bullish momentum, while the $4,100 (psychological level) acts as a short-term bottleneck.
Consider going long on spot gold today around $4,038; Stop loss: $4,033; Target: $4,070; $4,080
AUD/USD
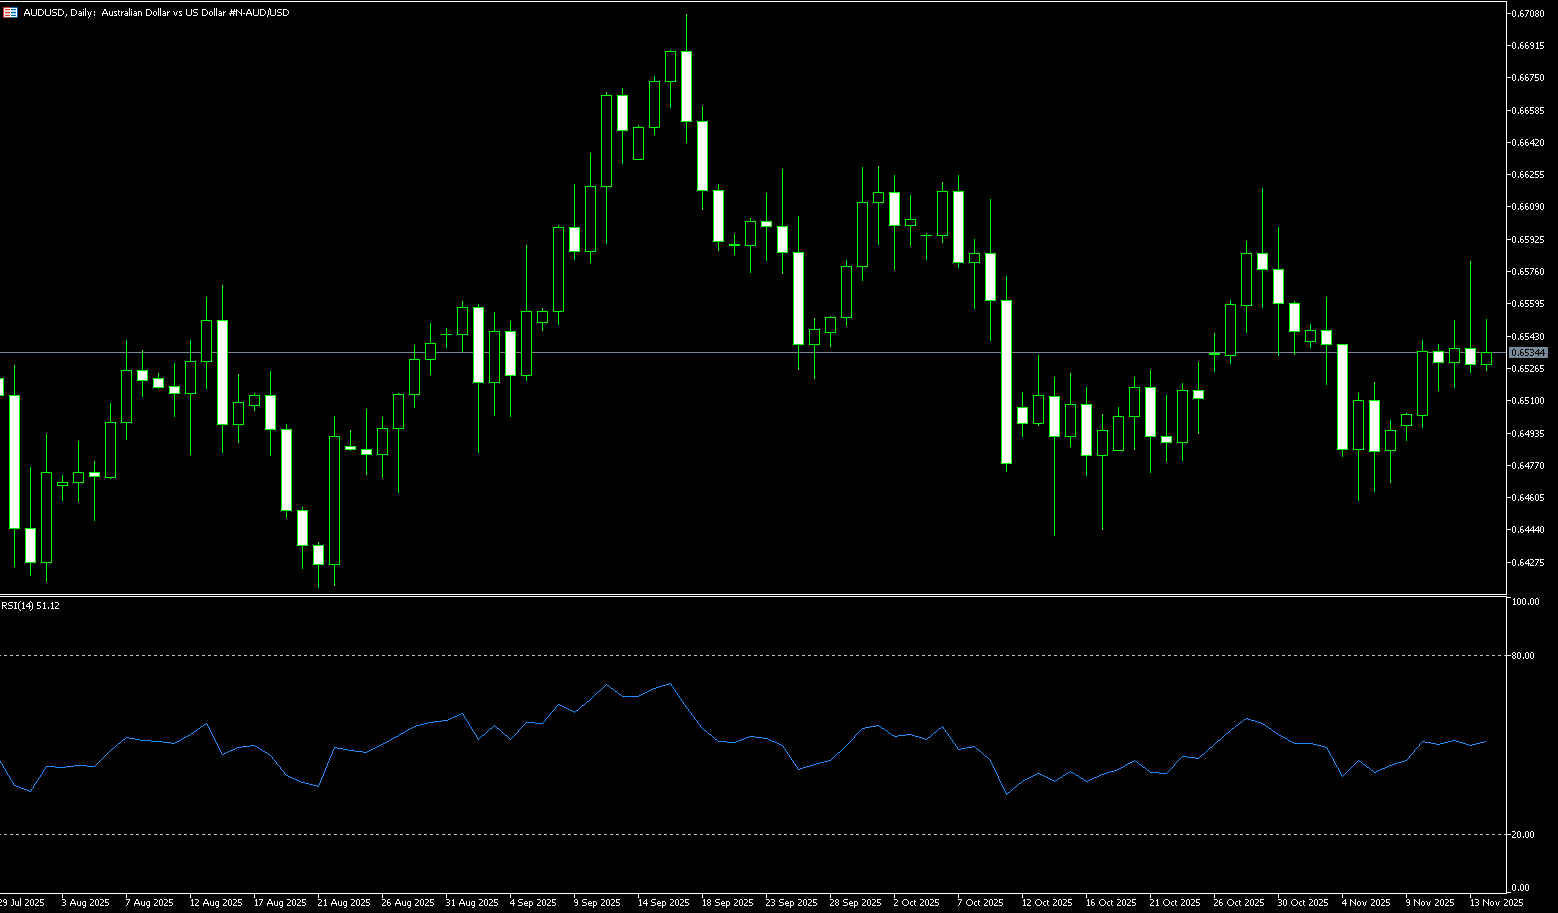
The Australian dollar weakened on Monday, falling slightly below $0.6500, reversing last week's gains, as a stronger US dollar put pressure on the currency. The US dollar strengthened as Federal Reserve officials expressed skepticism about the necessity of a December rate cut, with some investors outright rejecting the possibility. The market now rates at approximately 46% probability of a 25 basis point cut next month, significantly lower than the previous level of around 88%. In Australia, investors have also reduced their expectations for monetary easing. They have essentially abandoned the possibility of a rate cut by the Reserve Bank of Australia (RBA) this year, as recent economic indicators have failed to provide sufficient justification. Notably, stronger-than-expected employment data has recalibrated expectations, with swaps now showing only a 43.9% probability of a rate cut in May 2026, a sharp decline from nearly 70% previously. Investors are turning their attention to tomorrow's RBA meeting minutes for further clues about future policy moves.
The Australian dollar traded slightly below 0.6500 against the US dollar on Monday. Daily chart analysis shows the pair trading in a narrow range below 0.6500, reflecting a sideways trend. The 14-day Relative Strength Index (RSI) is around 48-46, indicating continued sideways consolidation. The pair is currently hovering around 0.6500, indicating stabilizing momentum. AUD/USD may attempt to approach the 50-day simple moving average around 0.6558. A break above this level would be a bullish signal, potentially paving the way for a move towards last week's high of 0.6580, with a further break targeting 0.6630 (October 1st high). On the downside, key support lies at 0.6480 (yesterday's low), followed by 0.6457 (200-day simple moving average), and the four-month low of 0.6414 from August 21st.
Consider going long on AUD/USD around 0.6480 today; Stop loss: 0.6470; Target: 0.6530; 0.6540
GBP/USD
The GBP/USD pair fell to near 1.3150 during Monday's Asian session. The pound weakened against the dollar amid concerns about UK fiscal debt and weak economic data. The pound lost some support after reports that British Prime Minister Keir Starmer and Chancellor of the Exchequer Rachel Reeves abandoned plans to raise income tax rates, a dramatic shift that occurred just before the November 26 budget. Furthermore, recent UK economic data, including slowing wage growth and weak GDP figures, further fueled economic concerns and increased bets on a December rate cut by the Bank of England. According to Reuters, the probability of a 0.25 percentage point cut has surged to nearly 80%. On the other hand, traders are bracing for a backlog of US data following the government's reopening, expecting it to point to economic weakness. This could drag down the dollar and create tailwinds for major currency pairs.
Before the end of last week, the pound fell to near the 1.3100 level against the dollar. The overall trend for the pair remains bearish, as it is trading below its 200-day simple moving average of around 1.3286. The 14-day Relative Strength Index (RSI) remains around 40.00. If the RSI resumes its downward trend, new bearish momentum will emerge. On the downside, the 1.3100 (psychological level) - 1.3084 (November 12 low) area could act as immediate support; a break below this area could see the pair retest the psychological level of 1.3000. On the other hand, it would be prudent to wait for further buying near last week's high, around 1.3215, before taking further profits. The GBP/USD pair could move towards a challenge of the 200-day simple moving average at 1.3286.
Consider going long on GBP around 1.3140 today; Stop loss: 1.3130; Target: 1.3180; 1.3200

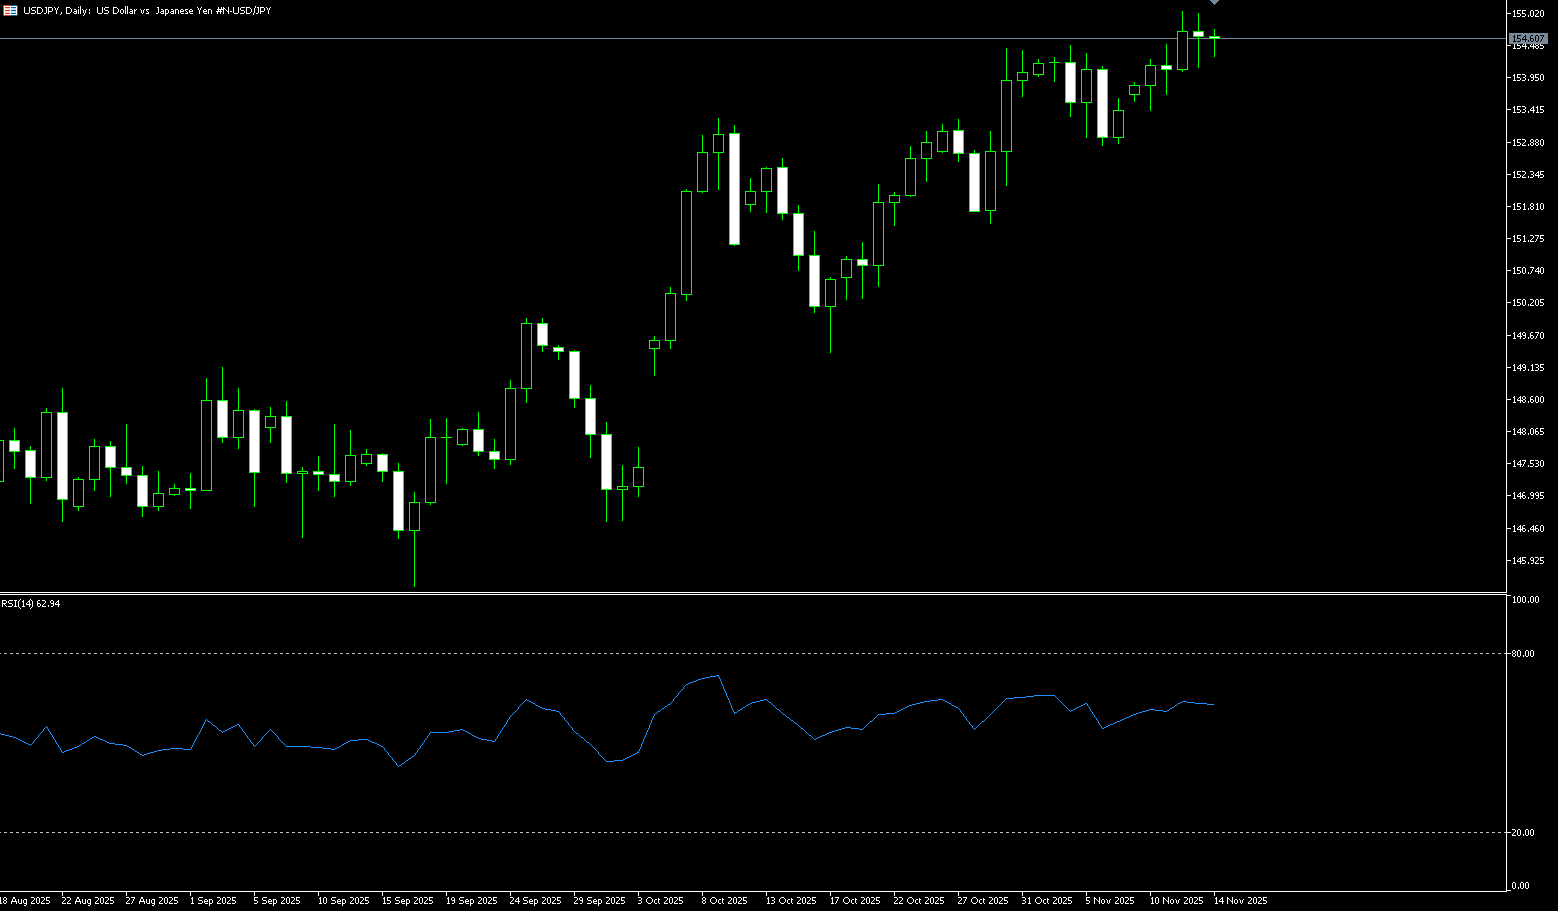
USD/JPY
The USD/JPY pair showed little change after data released during the Asian session showed that the Japanese economy contracted less than expected in the third quarter. While concerns about intervention weighed on the pair, uncertainty about the timing of the Bank of Japan's next rate hike supported spot prices amid a slight rise in the US dollar. The yen fell to around 155.30 yen per dollar on Monday, near its lowest level since January, despite stronger-than-expected growth data. Japan's economy contracted 0.4% quarter-on-quarter in the three months to September, reversing the 0.6% expansion in the second quarter, but exceeding market expectations of a 0.6% decline. Amid this, Prime Minister Sanae Takaichi urged the Bank of Japan to maintain low interest rates, emphasizing that monetary policy should support strong economic growth and stable price increases. Meanwhile, Bank of Japan Governor Kazuo Ueda stressed that consumption remained resilient, driven by rising household incomes and a strengthening labor market, noting that underlying inflation was gradually approaching the Bank of Japan's 2% target and leaving room for an upcoming interest rate hike.
From a technical perspective, the strong rebound of USD/JPY from the 153.60 support level over the weekend, and its close above the 154.45-154.50 resistance level, is bullish for USD/JPY bulls. Furthermore, oscillators on the daily chart remain comfortably within positive territory and are still far from overbought zones. If further buying and acceptance can be achieved above the psychological level of 155.00, the positive outlook will be reaffirmed, pushing the spot price towards the intermediate resistance level of 155.60-155.65, and then towards the psychological level of 156.00. Conversely, a break below the immediate support of 154.00 may continue to attract some buyers, finding good support in the 153.60-153.50 area. Below this area, the pair could slip to the psychological level of 153.00. The latter should be considered a key turning point; a decisive break could shift the short-term bias to bearish traders and drag the spot price towards the next relevant support level in the 152.15-152.10 area.
Consider shorting the US dollar around 155.45 today; Stop loss: 155.65; Target: 154.50; 154.30
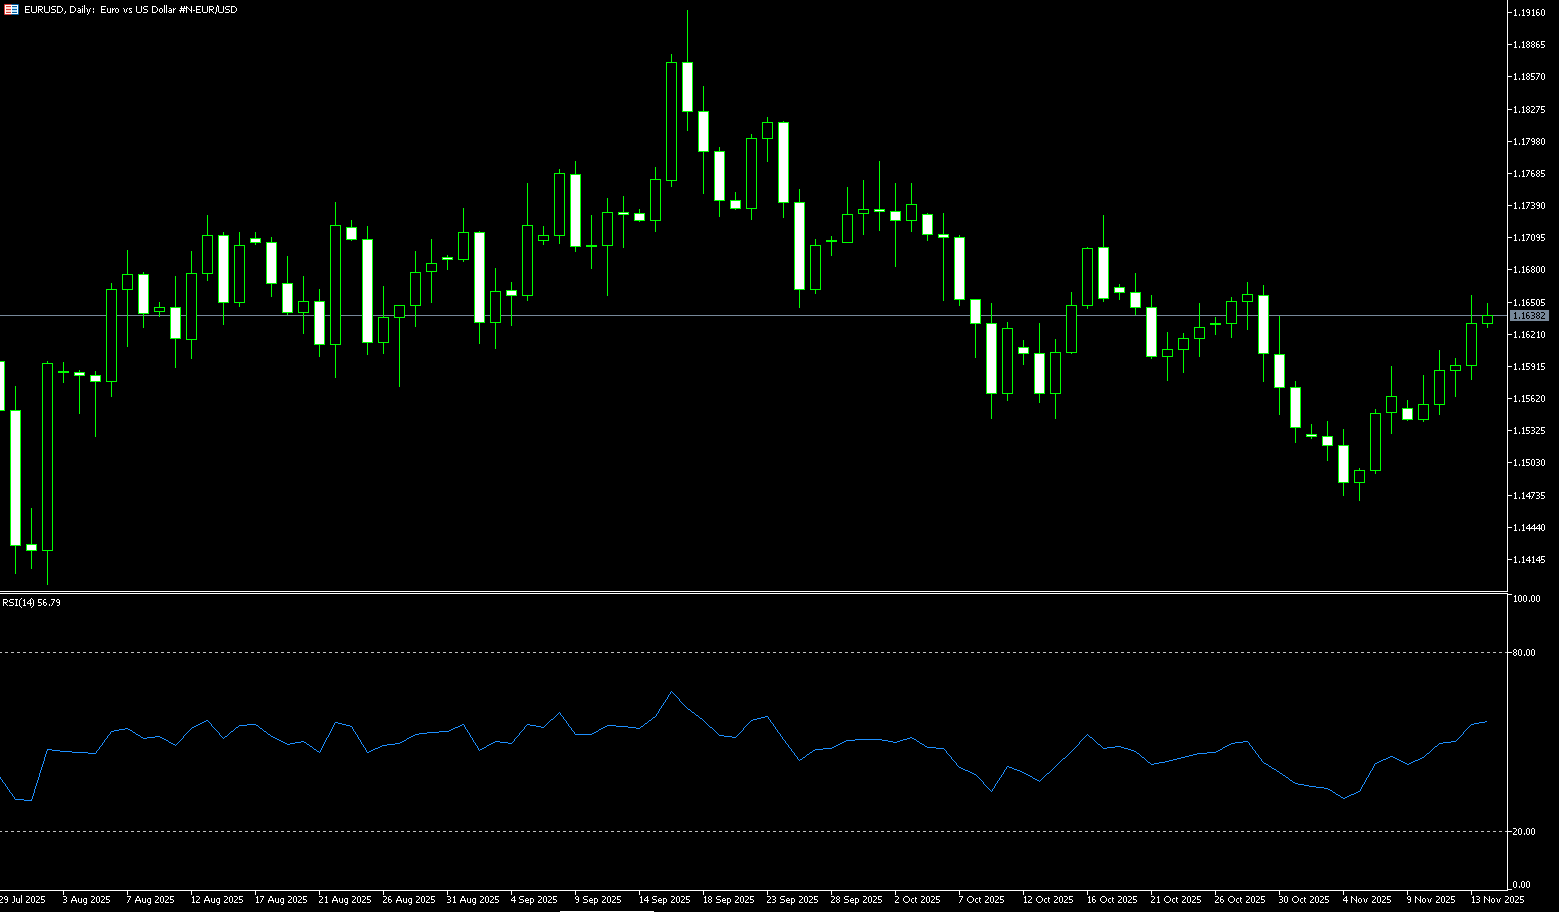
EUR/USD
The euro/dollar pair continued its decline for the second consecutive trading day on Monday, trading around 1.1600. The pair's depreciation reduced the likelihood of a December rate cut as cautious comments from Federal Reserve officials supported the dollar. The dollar also received support as market sentiment improved after US President Donald Trump signed a funding bill last week to reopen the US government, ending the longest shutdown in history at 43 days. Federal employees were instructed to return to work on Thursday. Bloomberg reported on Saturday that European Central Bank Governing Council member Olli Rehn warned that the risk of slowing inflation should not be ignored, although upside risks remain. Rehn noted that despite disruptions caused by the Trump administration's tariff policies, the eurozone economy is still growing steadily, albeit slowly.
The daily chart shows that EUR/USD maintains a short-term bearish trend, with buyers failing to decisively break through 1.1655 (the November 13 high) and the 50-day simple moving average area of 1.1657. Short-term momentum has improved somewhat, while the 14-day Relative Strength Index (RSI) has risen (currently around 48.70), indicating increasing bullish pressure. A decisive break above the 1.1657 simple moving average would expose the 1.1700 psychological level. Conversely, if EUR/USD breaks below 1.1600, and the support area near the 20-day simple moving average at 1.1582, followed by last week's low of 1.1541, a break below these levels would expose the 1.1500 level as the next bearish target.
Today, consider going long on EUR/USD near 1.1580; Stop loss: 1.1570; Target: 1.1640; 1.1650
Disclaimer: The information contained herein (1) is proprietary to BCR and/or its content providers; (2) may not be copied or distributed; (3) is not warranted to be accurate, complete or timely; and, (4) does not constitute advice or a recommendation by BCR or its content providers in respect of the investment in financial instruments. Neither BCR or its content providers are responsible for any damages or losses arising from any use of this information. Past performance is no guarantee of future results.
Lebih Liputan


Pendedahan Risiko:Instrumen derivatif diniagakan di luar bursa dengan margin, yang bermakna ia membawa tahap risiko yang tinggi dan terdapat kemungkinan anda boleh kehilangan seluruh pelaburan anda. Produk-produk ini tidak sesuai untuk semua pelabur. Pastikan anda memahami sepenuhnya risiko dan pertimbangkan dengan teliti keadaan kewangan dan pengalaman dagangan anda sebelum berdagang. Cari nasihat kewangan bebas jika perlu sebelum membuka akaun dengan BCR.
BCR Co Pty Ltd (No. Syarikat 1975046) ialah syarikat yang diperbadankan di bawah undang-undang British Virgin Islands, dengan pejabat berdaftar di Trident Chambers, Wickham’s Cay 1, Road Town, Tortola, British Virgin Islands, dan dilesenkan serta dikawal selia oleh Suruhanjaya Perkhidmatan Kewangan British Virgin Islands di bawah Lesen No. SIBA/L/19/1122.
Open Bridge Limited (No. Syarikat 16701394) ialah syarikat yang diperbadankan di bawah Akta Syarikat 2006 dan berdaftar di England dan Wales, dengan alamat berdaftar di Kemp House, 160 City Road, London, City Road, London, England, EC1V 2NX. Entiti ini bertindak semata-mata sebagai pemproses pembayaran dan tidak menyediakan sebarang perkhidmatan perdagangan atau pelaburan.

 English
 简体中文
简体中文
 繁體中文
繁體中文
 Bahasa
Melayu
Bahasa
Melayu
 Tiếng
Việt
Tiếng
Việt
 ไทย
ไทย
 日本語
日本語
 한국어
한국어
 ភាសាខ្មែរ
 español