


0
Currency & Commodity Analysis:
US Dollar Index
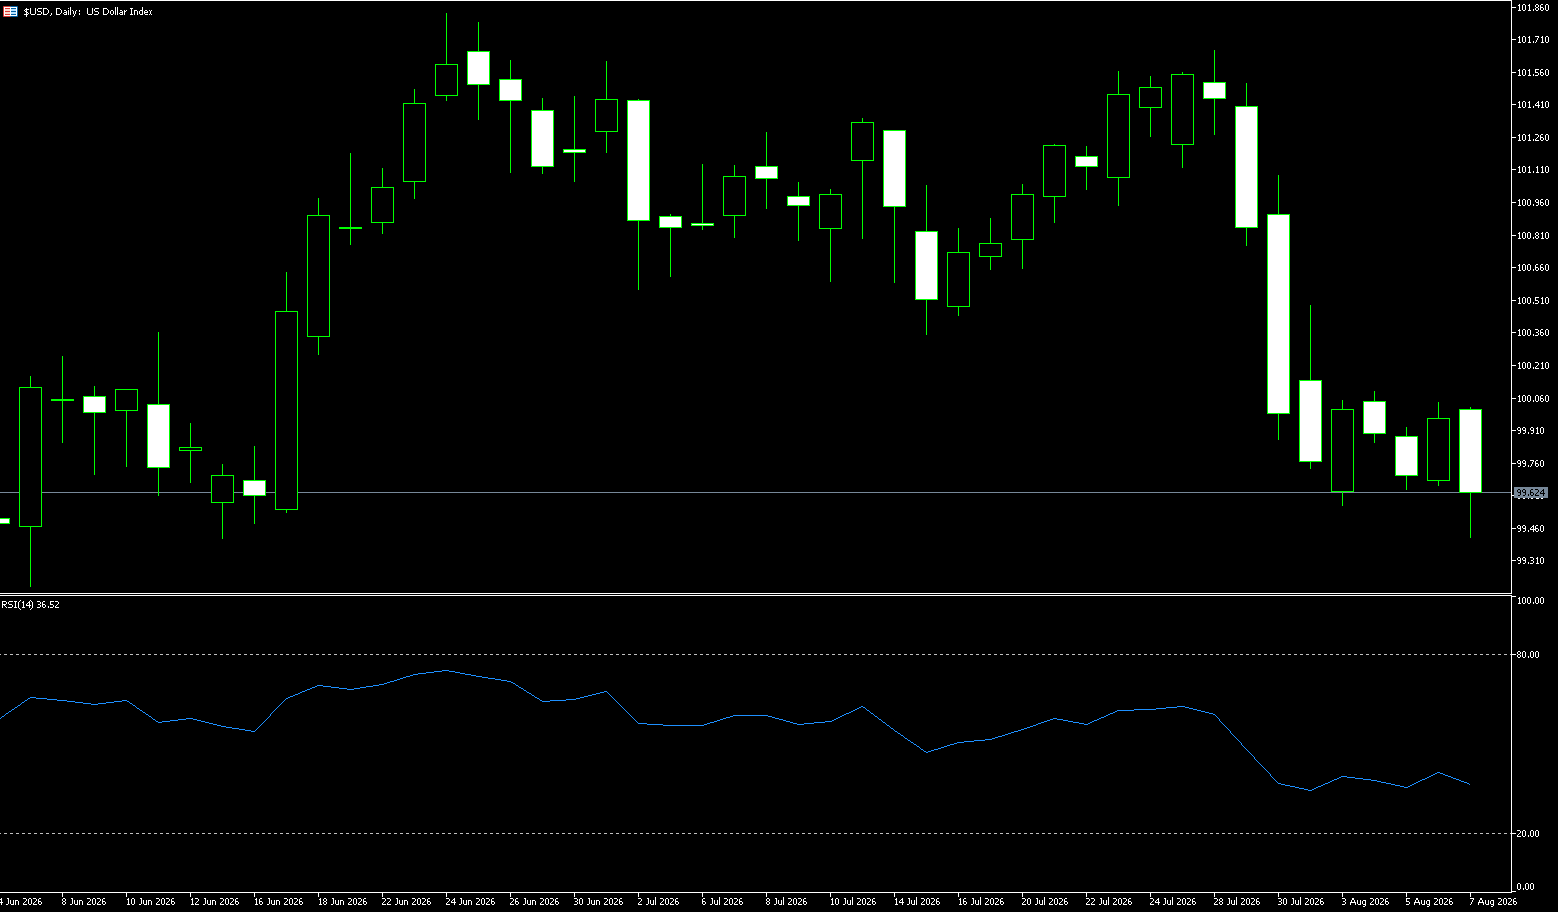
Conflicting signals from the US-Iran negotiations boosted safe-haven demand, coupled with hawkish comments from Kansas City Fed President Schmid, who emphasized that AI investment is driving inflation. ADP employment increased by only 44,000, but wage data leaned hawkish, causing the market to price in a September rate hike probability down to 55%. The US Dollar Index traded in a narrow range around 100. The high degree of uncertainty surrounding the US-Iran negotiations provided safe-haven buying support for the dollar, while hawkish comments from Fed officials also boosted the dollar to some extent. Conflicting signals from the US-Iran negotiations are providing intermittent support for the dollar. Iranian Deputy Foreign Minister Gharibabadi stated that Iran and Oman are close to finalizing a framework agreement for commercial shipping in the Strait of Hormuz, but emphasized that the agreement would not automatically reopen this key waterway. This contrasts sharply with Trump's previous optimistic statements that the negotiations were "very productive." Conflicting comments between US and Iranian officials exacerbated market concerns about the prospects of the agreement, prompting safe-haven funds to flow back into the dollar.
The dollar index edged lower at around 99.60 before the weekend, after rebounding in the previous session, as investors cautiously awaited the closely watched July jobs report for new signals on the strength of the labor market and the outlook for Federal Reserve monetary policy. Fed officials have increasingly indicated they are prepared to raise interest rates as soon as possible should inflationary pressures mount, with the market anticipating a 25-basis-point hike in September. The Financial Times reported that Chairman Kevin Warsh would be willing to raise rates next month if inflation data remains high in the coming weeks. Despite criticism from financial markets, the Fed chairman is expected to maintain a simplified communication style. Meanwhile, the dollar received additional support from a rebound in oil prices, and renewed tensions in the Strait of Hormuz fueled concerns about the inflation and interest rate outlook.
Currently, the dollar index is trading in a narrow range around 99.60-99.80, with safe-haven buying driven by geopolitical uncertainty and hawkish comments from Fed officials providing support. However, weak ADP employment data but hawkish wage signals, and Schmid's emphasis on AI investment driving inflation—signals suggest the Fed still faces a complex situation in balancing inflation and employment. Market pricing in a September rate hike probability has fallen to around 55%. From a chart perspective, the US dollar index broke through the 100-day simple moving average of 99.75, and MACD momentum strengthened, indicating increased imbalance between buying and selling after the data release. The weekly RSI has fallen from its high to around 41, moving out of overbought territory and into a neutral-to-weak range, but has not yet entered oversold territory; however, volatility typically increases after the index deviates from the Bollinger Band midline. The more meaningful variables to observe now are whether subsequent non-farm payrolls, average hourly earnings, unemployment rate, and service sector employment sub-indices can form a consistent signal. Last week's range: high of 100.06, low of 99.42, erasing the gains of the previous two weeks' rebound. The price effectively broke below the short-term weekly moving average, invalidating the previous bullish flag pattern, turning it from support to resistance; the weekly RSI has fallen from its high to around 41, moving out of overbought territory and into a neutral-to-weak range, but has not yet entered oversold territory.
Next Week's Outlook: Weekly Chart: If the price fails to recover above 100.06 next week, the weekly chart will likely continue its weak consolidation; a direct break below 99.42 would confirm the downtrend. Daily Chart: The MACD is near the zero line. If a bullish divergence appears in the 99-98.5 support zone, it will trigger a rebound; if there is no divergence and the price breaks down directly, the downtrend will continue. Three possible scenarios for next week: Scenario A (Base scenario, higher probability): The price consolidates in the support zone, first testing the 99.30-99.00 support. If it doesn't break down effectively, it will oscillate in the 99.00-100.20 range. The non-farm payroll data will determine the upper and lower limits of this range; this is a corrective consolidation after a sharp drop. Scenario B: A reversal and strengthening occurs. Non-farm payrolls significantly exceed expectations, leading to a strong rebound in the US dollar, stabilizing above 100.20, and further challenging 100.60-100.80. Only by breaking above this range will this round of correction end, and the price will return to an upward channel. Scenario C: A further significant decline is expected, with non-farm payrolls significantly weaker than anticipated. Coupled with falling US Treasury yields, a decisive weekly close below 99.00 would open up further downside potential, with the next target around 98.50.
Today, consider shorting the US Dollar Index at 99.75, with a stop-loss at 99.85 and targets at 99.30 and 99.20.
WTI Crude Oil
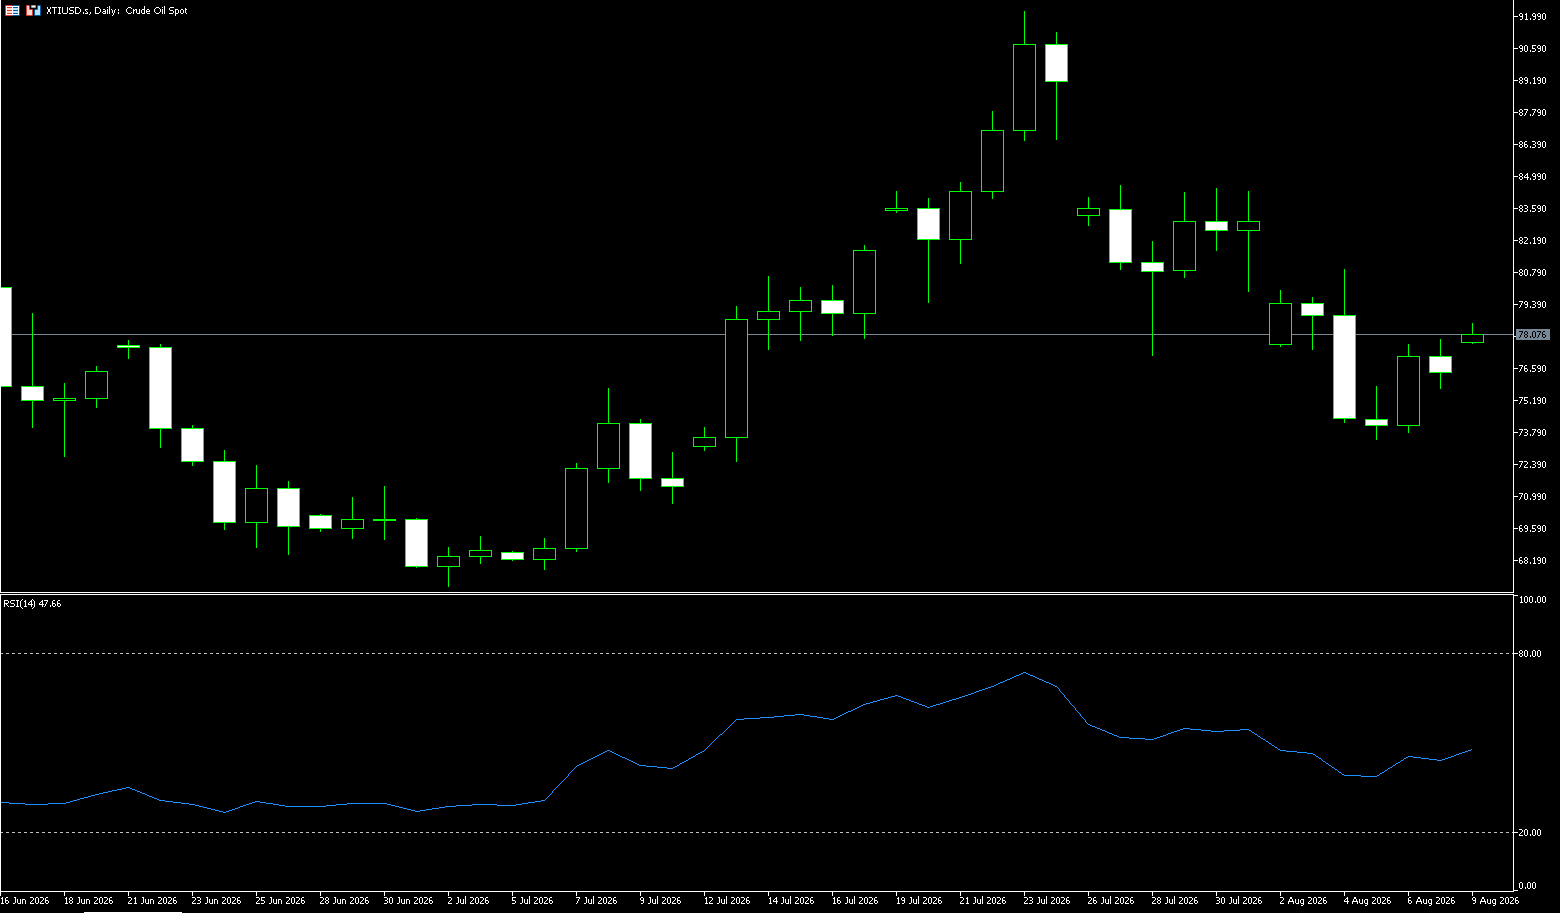
Crude oil prices remained slightly above $76 per barrel before the end of last week, as renewed tensions in the Strait of Hormuz fueled market unease and cast new doubts about efforts to fully reopen this vital shipping lane. Reports indicate that Iran struck what it called “hostile targets” in the Strait of Hormuz, following reports of an explosion near Kesh Island. Under the proposed Iran-Oman agreement, Tehran seeks to ban US and Israeli ships from passing through the Strait of Hormuz and demands compensation from countries considered hostile until granted passage. Iran has also proposed fines equivalent to 20% of the cargo value for vessels violating the rules and stated that the strait will only be fully reopened after the US lifts its maritime blockade. The Iranian parliament is currently reviewing the draft bill, which imposes stricter conditions than the market expected for commercial shipping through the Strait of Hormuz.
Geopolitical risk premiums are being reinjected into oil prices. Saudi Arabia warned of an imminent coordinated attack from the north and south, while the Houthi rebels escalated their operations on two fronts in Yemen and the Red Sea. Trump stated the war would "end soon" but acknowledged strained weapons stockpiles. The high volatility in oil prices is expected to continue until the Hormuz agreement is finalized. While the market focuses on geopolitical risks, commercial signals from the supply side are also worth noting. Saudi Aramco slightly lowered its official selling price for "Arab Light" crude oil for the Asian market in September, marking the first reduction after several months of premiums for Asian customers. This move may reflect Saudi Arabia's cautious assessment of Asian demand prospects or an attempt to gain market share. However, Gulf countries' crude oil and condensate exports in July were still about 40% lower than pre-war levels, indicating that global supply has not yet returned to normal.
Last week, WTI crude oil experienced a dramatic V-shaped rollercoaster ride, primarily driven by fluctuating expectations surrounding US-Iran negotiations, with the geopolitical risk premium being quickly squeezed out and then partially recovered. Three technical characteristics of WTI crude oil warrant attention. First, the price has fallen back below the Bollinger Band midline of $81.10, indicating that the short-term moving average structure formed by the previous rapid rebound has been broken. Second, the Bollinger Band width remains relatively large, suggesting that historical volatility has not yet been fully digested, and the current narrow range trading cannot be simply equated with a low-volatility environment. Third, the MACD indicator shows the DIFF at approximately -0.39, the DEA at approximately 0.80, and the histogram at approximately -2.39, reflecting that after the decline in upward momentum, the price is still in the process of re-establishing equilibrium. Currently, oil prices are trading below the 50/100-day moving averages, with the 200-day moving average around $75.54, serving as a short-term dividing line between bullish and bearish sentiment; the RSI has rebounded from the oversold zone to a neutral position of 45-50.
Looking at the daily chart, WTI crude oil previously rose rapidly from a low of around $67.08 in July to $92.25, followed by a sharp pullback. The current price is around $76. The overall pattern for next week is expected to be characterized by wide-range fluctuations, with geopolitical news dominating gaps and rapid price breaks. The battle between bulls and bears will be concentrated in the large range of 74.5-80.6, with no clear one-sided trend yet established. Key technical levels include: Resistance at 79.0-79.20: the 38.2% Fibonacci retracement level on the 4-hour chart and the previous neckline, the first test of any rebound; a break above this range would open up further upside potential. Resistance at 80.5-80.80: the 50% Fibonacci retracement level, a strong supply zone; failure to break above this level could lead to renewed downward pressure. Support levels are as follows: Support at 74.5-75.0: this week's low, the core of the bulls' defense; holding above this level would maintain the current oscillating structure with a slight upward bias. Support at 72.0-72.5: the medium-term demand zone; a break below this level would restart the downtrend, targeting a further decline to around 70. Next week's price action scenario: Bullish scenario (baseline upward oscillation): Holding the 74.5-75 support level, the price will test 79-80.6; only a daily closing price firmly above 80.8 confirms a strengthened rebound, targeting 83-84. Bearish scenario: The rebound encounters resistance at 79-80.6 and falls back, retesting lower levels; a decisive break below the 74.5 support zone opens up downside potential, targeting 72, and further down to 70.
Today, consider going long on crude oil at 76.15, with a stop loss at 76.00 and targets at 78.00 and 80.00.
Spot Gold
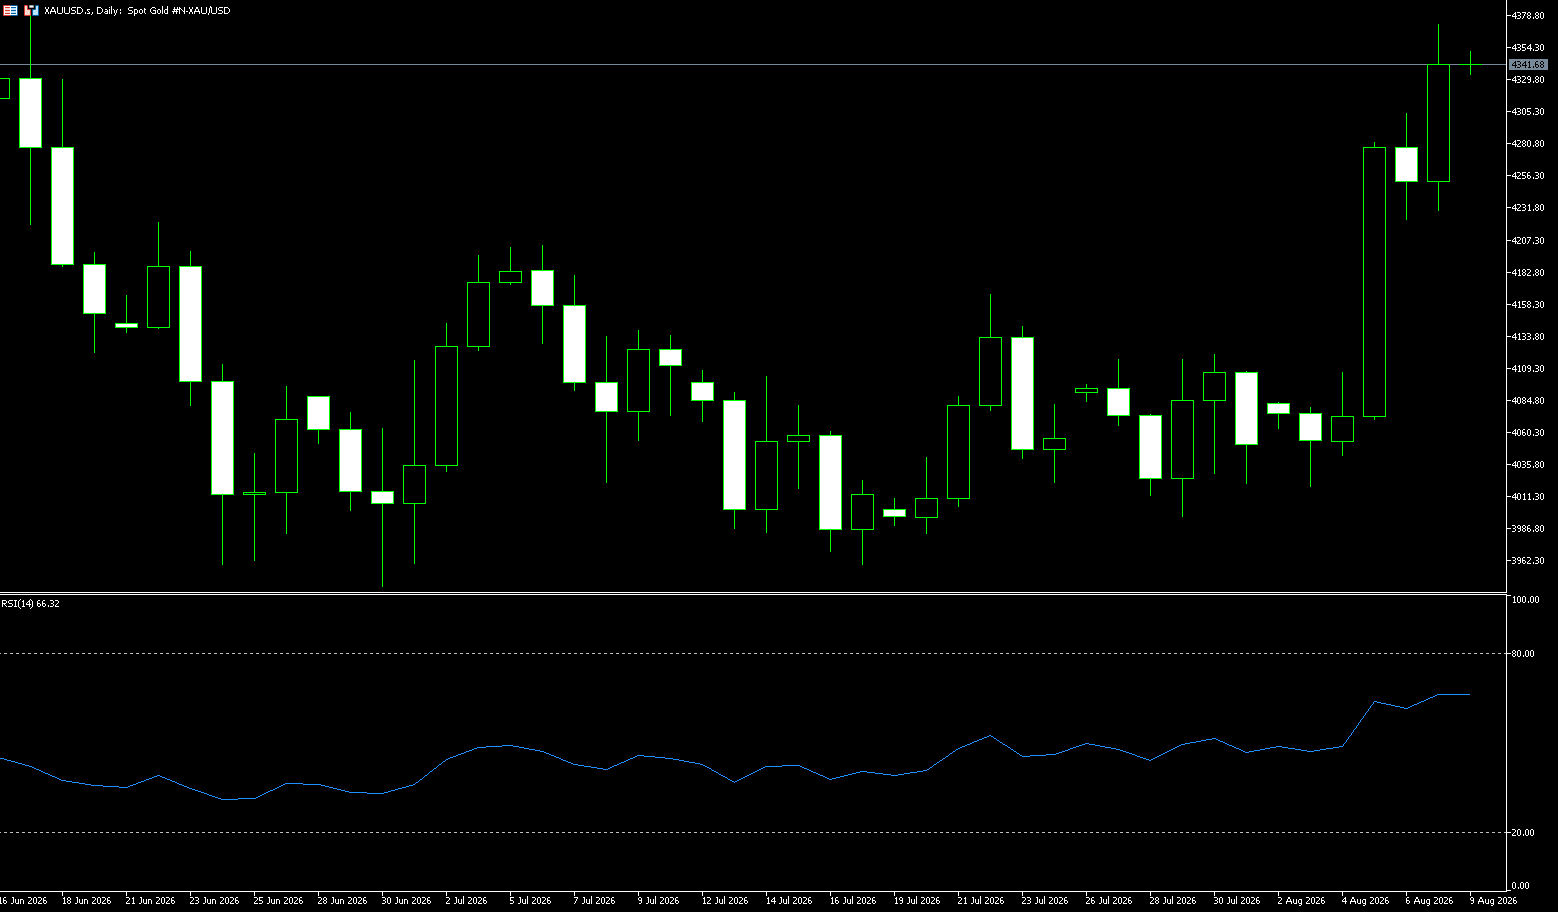
Last week, gold prices surged over 7% to above $4,350. After recording its largest single-day gain since February (+4.05%) on Wednesday, gold prices retreated on Thursday as oil prices soared by over $3 due to the Iranian parliament's review of a bill banning "hostile" vessels from the US and Israel from entering the Strait of Hormuz. Renewed inflation concerns and rising expectations of a Fed rate hike caused gold prices to fall back to around $4,240. On Friday, it climbed back above $4,300, which will influence the path of interest rates and the medium-term trend of gold prices. Geopolitical risks and policy expectations are fiercely intertwined. This surge and subsequent pullback is not a simple technical correction, but rather the result of a fierce collision of geopolitical, energy market, and Fed policy expectations. The market is at a critical juncture: the Iranian parliament's deliberation on a bill to ban "hostile" vessels from the Strait of Hormuz has directly pushed up oil prices and reignited inflation concerns; meanwhile, Friday's upcoming US non-farm payroll report will be a key variable determining the Fed's interest rate path and even the medium-term direction of gold.
The core catalyst for this round of gold price increases stems from the sharp escalation of tensions in the Middle East. According to Iran's semi-official Fars News Agency, citing lawmakers, a committee in the Iranian parliament is reviewing a preliminary bill to ban vessels from the US, Israel, and other countries considered "hostile" from passing through the Strait of Hormuz, with fines of up to 20% of the value of the goods to be imposed on violators. Against this backdrop, the recent surge and subsequent pullback in gold prices can be interpreted as a temporary shift in market sentiment from "safe-haven dominance" to "interest rate dominance." Last Wednesday's surge in gold prices reflected more of an immediate reaction to escalating geopolitical risks; Thursday's pullback reflects investors' repricing of renewed inflation and the increased probability of interest rate hikes. The US dollar index rose 0.3% to 99.95 on Thursday, further confirming this logic—a strong dollar further increases the holding cost of dollar-denominated gold.
Considering current factors, gold is currently in a typical phase of bullish-bearish tug-of-war. On the one hand, geopolitical risks in the Middle East are far from resolved. On the other hand, the long-term value of gold ultimately depends on the direction of real interest rates. In the current environment, the upside risk of real interest rates outweighs the downside risk, which determines that gold prices are unlikely to repeat the one-sided upward trend seen at the beginning of the year. Last week, gold ended its long period of range-bound trading and broke out violently, with a weekly gain of over 7%, recording its largest weekly gain since January of this year, reaching a high of $4371.80 during the session. On the weekly chart, the weekly candlestick is a large bullish candle, with the price above the 5-week and 10-week moving averages, while also breaking through the 60-week moving average resistance; the weekly KDJ is showing a golden cross upwards, and the MACD bearish histogram is clearly contracting, officially shifting the weekly chart from a range-bound to a bullish structure. Key Bottom Confirmation: 4,000 was a strong structural support level last week, repeatedly tested without breaking through, becoming the platform for this round of upward movement. Last Wednesday saw the largest single-day gain since February {+4.05%}, closing with a large bullish candlestick, directly breaking through the upper edge of the previous consolidation range at 4,200, completing a top-to-bottom reversal, with the former resistance at 4,200 now becoming a significant support.
Next Week's Key Event: Tuesday evening's US July CPI inflation data is the core data determining whether gold can continue its rebound. The data will amplify volatility, and the technical structure will be rewritten by the data's impact. Currently, the larger cycle has turned bullish, and the main direction is expected to be a pullback to confirm support before continuing upwards; however, given this week's significant gains, next week will likely see consolidation to digest profit-taking, with a low probability of a direct, continuous surge. The bullish scenario for next week: If the 4,200 support holds, the bullish pattern will be maintained, with another attempt to break through 4,300, and a subsequent target of the 4,390-4,400 psychological level. This will further test the $4,546 level (June 1st high); a weaker scenario would be a break below $4,200 within the week, closing below it, indicating a false breakout and a return to the large trading range, retesting support near $4,152 (50-day moving average) and the $4,100 level.
Today, consider going long on gold at $4,335, with a stop loss at $4,330; targets: $4,395 and $4,400.
AUD/USD
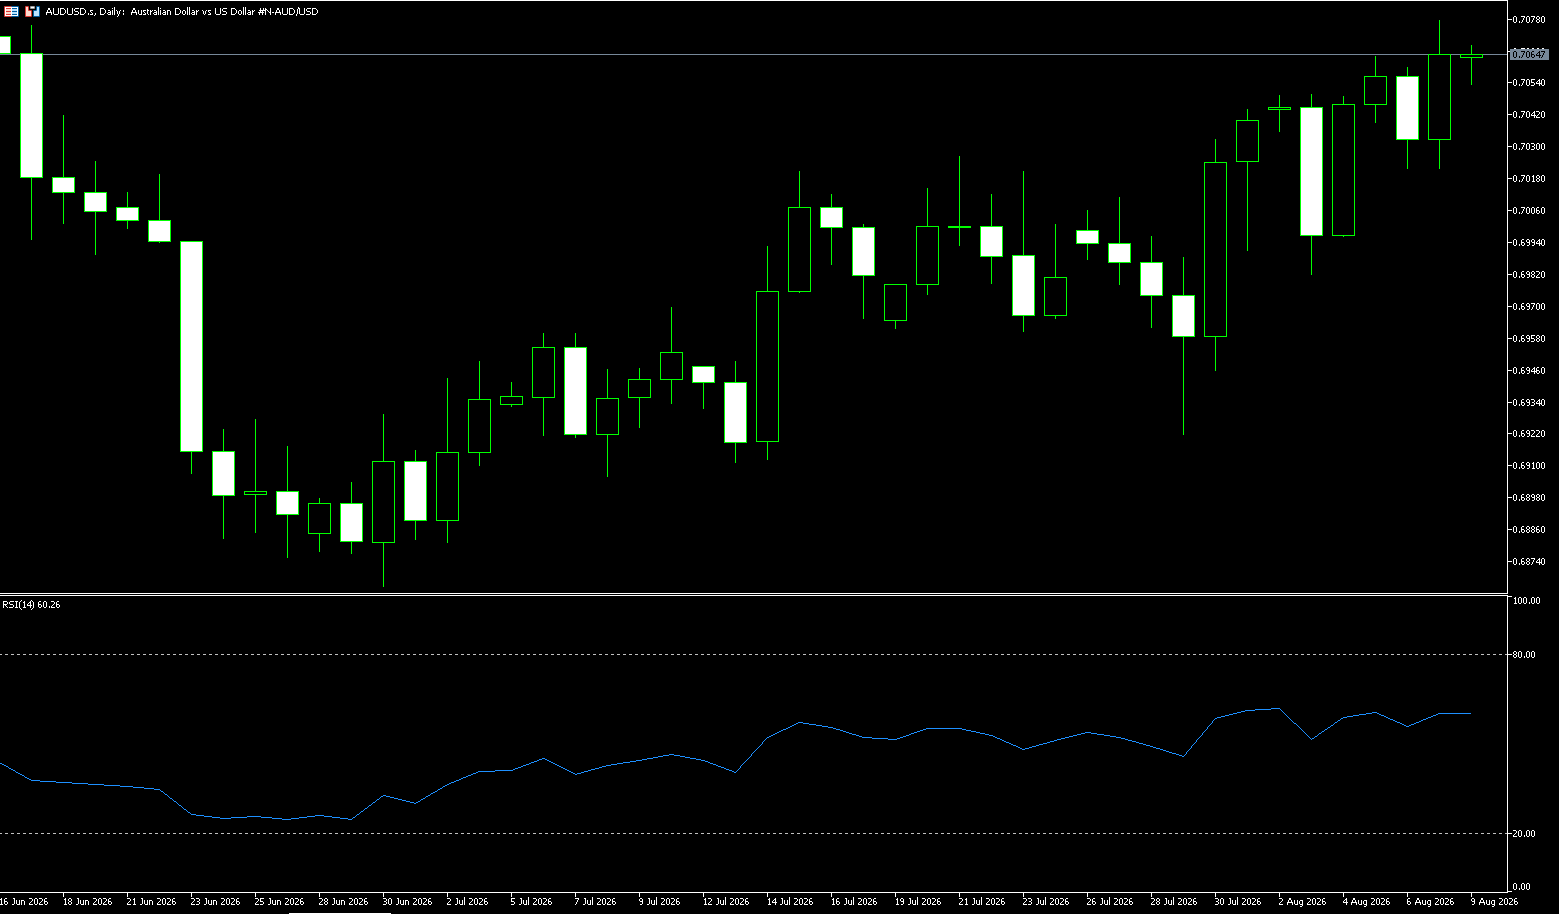
The AUD/USD pair rose to approximately 0.7077 from a low of 0.6984 last week and is expected to rise 0.65% this week as renewed tensions in the Middle East dampened risk sentiment. The US dollar strengthened, while oil prices rose due to reports of Iranian attacks in the Strait of Hormuz and a lack of clarity regarding an agreement to reopen this vital waterway. Rising energy prices have reignited inflation concerns and reinforced expectations that global interest rates may remain high. In Australia, after three rate hikes this year, the market has little expectation of a rate increase at next week's Reserve Bank of Australia monetary policy meeting, given lower-than-expected second-quarter inflation data. Investors have little expectation of a September rate hike, while the market is pricing in a roughly 60% probability of a November rate hike should third-quarter inflation data be stronger than expected.
The prospect of a resumption of navigation in the Strait of Hormuz has driven the Australian dollar significantly higher against the US dollar. This week, ongoing negotiations between Iran and Oman fueled market expectations for the resumption of navigation through the Strait, causing international oil prices to fall. The next few days will be a crucial window for this currency pair. Meanwhile, the Australian dollar's performance will also be influenced by the Reserve Bank of Australia's (RBA) interest rate decision next week. Market economists are divided: some believe the RBA will raise rates to 4.60%, marking the fourth consecutive month of rate hikes. Other analysts predict the RBA will maintain rates but retain policy space for further rate hikes later this year.
The Australian dollar remains constructive in the broader context, but further upside is becoming more difficult. Australia's domestic environment continues to be more favorable than many developed economies, and the RBA is not in a hurry to abandon its dovish hawkish stance. However, this support is being offset by a resilient US dollar, ongoing geopolitical tensions, and a Chinese economy that is only stabilizing rather than accelerating. The daily chart shows the Australian dollar has strengthened against the US dollar in recent weeks, reaching 0.7077, its highest level since June 17. The pair has now risen above the 50-day simple moving average of 0.6997 and is testing the 100-day simple moving average of 0.7052. The pair is retesting the upper edge of an ascending channel, which is a bearish flag pattern formed over the past few months. The Relative Strength Index (RSI) has risen above the 50 level. The Average Directional Index (14) is close to 13, suggesting a relatively weak underlying trend, reinforcing the view of a gradual upward move rather than a sharp rise. Therefore, the pair is likely to continue its slight upward movement until it enters overbought territory; a pullback is then possible before or after the RBA's decision next week. On the upside, immediate resistance lies at last week's high of 0.7077; a sustained break above this level would target the higher resistance zone around 0.7180 (the June 3rd high), followed by the psychological level of 0.7200. On the downside, initial support is found at the 55-day simple moving average of 0.7012, with the psychological level of 0.7000 and the 200-day simple moving average at 0.6922 providing broader support for a constructive structure; deeper support lies at the psychological level of 0.6900.
Consider going long on the Australian dollar at 0.7053 today, with a stop loss at 0.7040 and targets at 0.7100 and 0.7120.
GBP/USD
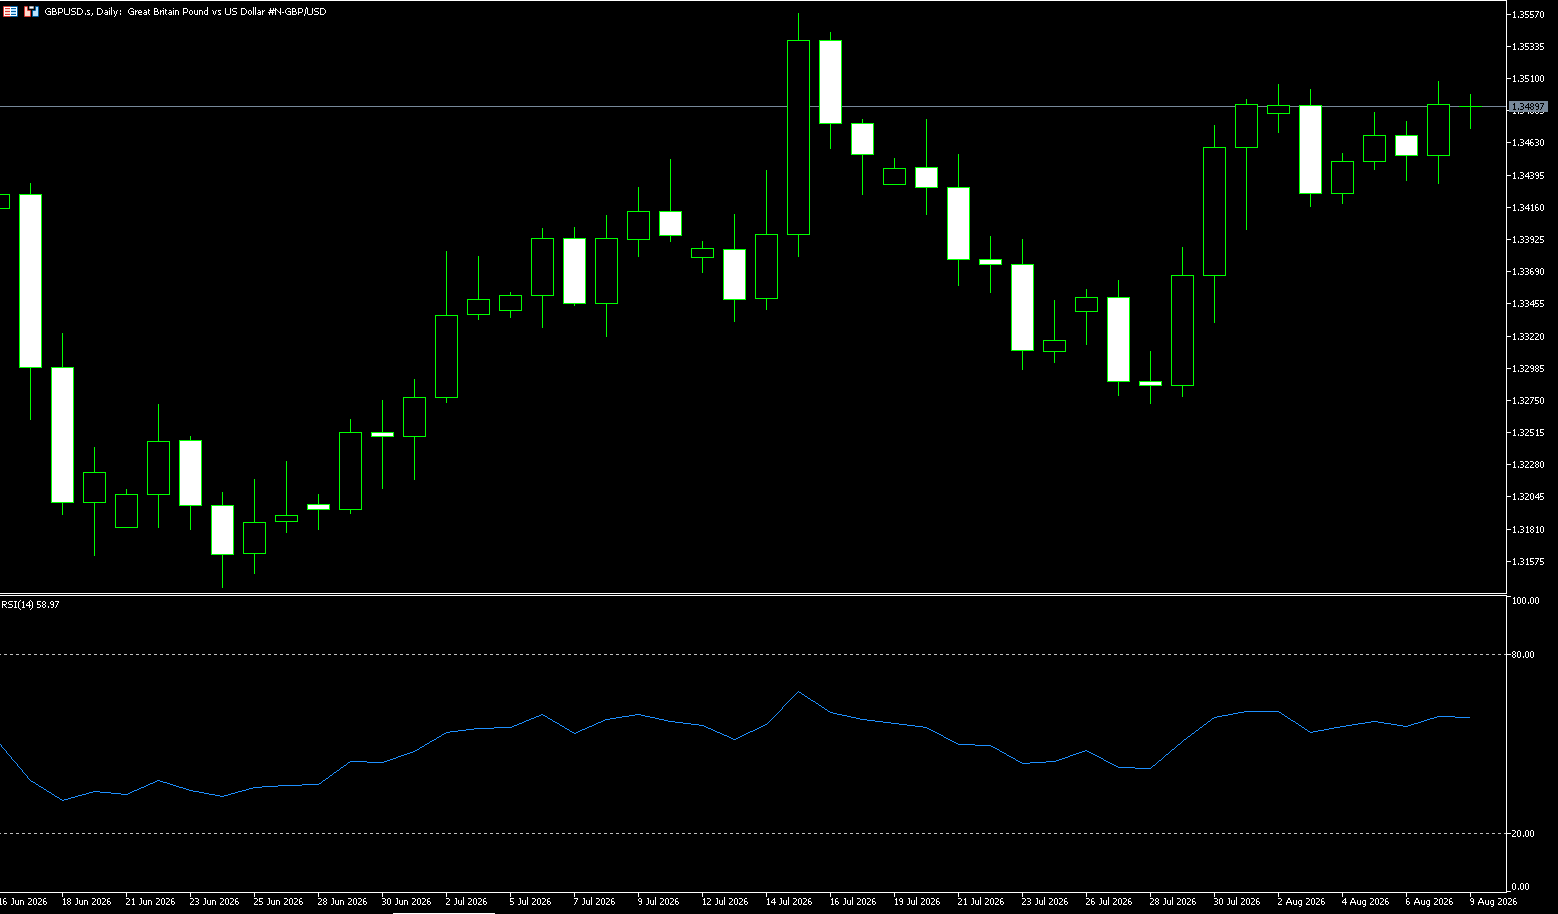
The pound remains slightly below $1.3500 as investors remain cautious about the outcome of negotiations between Iran and Oman, and uneasy about whether these talks will lead to a resumption of energy flows through the Strait of Hormuz. Iran has stated that it has reached an agreement with Oman on a proposed shipping route through this strategic waterway, boosting hopes for improved oil supplies and lower energy prices. However, a broader US-Iran agreement remains uncertain, with President Trump stating he will “see what happens in the ongoing negotiations.” The prospect of lower energy costs has eased concerns about inflation and slowing economic growth, reinforcing market expectations that the Bank of England will maintain a gradual monetary policy. This view was reinforced at last week’s Bank of England meeting, where policymakers kept interest rates unchanged, and Governor Andrew Bailey downplayed the need for further tightening, suggesting that the deinflation process remains on track despite persistent external uncertainties.
With yield spreads narrowing again, fundamental support for the pound appears to have weakened, weighing on the currency's short-term outlook. However, market sentiment continues to improve as participants downplay politically driven concerns following the recent political transition and the inauguration of Prime Minister Burnham. The new prime minister's commitment to fiscal responsibility appears much stronger than expected, helping to offset the drag from weaker yield spreads and providing a more constructive tone for the pound. GBP/USD is under downward pressure due to a stronger dollar, driven by renewed safe-haven demand from global investors. Escalating tensions in the Strait of Hormuz have disrupted market stability and cast serious doubt on the reopening of this crucial shipping route. Caution remains high as the Iranian parliament considers a draft proposal seeking to ban US and Israeli vessels, impose a 20% fine on cargo from hostile nations, and maintain restrictions on the strait until the US blockade is lifted.
Fundamentals and technicals are currently presenting similar signals. Lower UK inflation is providing some constraint on the pound, but the Bank of England's decision to maintain a 3.75% interest rate limits a rapid narrowing of yield spreads. Meanwhile, if the scale of active quantitative tightening is reduced in September, the upward pressure on UK long-term government bond yields from additional supply may decrease. The pound's reaction will depend on whether the market interprets this change as an adjustment to the operational framework or a shift towards overall policy easing. Looking at the daily chart, the pound/dollar pair rebounded rapidly after forming a low of 1.3273 and is currently trading between the Bollinger Band's middle band at 1.3411 and the upper band at 1.3552. The MACD fast line is above the slow line, and the histogram remains positive, indicating that short-term momentum is still biased towards correction, but incremental momentum has not expanded significantly. The high of last Friday's rebound is at 1.3509, while 1.3558 corresponds to the previous high, forming a dense resistance zone. If the exchange rate remains below 1.3500 for an extended period, the market can still be interpreted as a correction within the range rather than a complete reversal of the trend structure.
The weekly chart shows that the pound/dollar pair has maintained a narrow trading range in recent months. Trading before the weekend, the pair was near 1.3500, slightly above the 50-week exponential moving average (1.3405). The pair is slowly forming a symmetrical triangle pattern, with the upper and lower sides of the triangle about to converge. The Average Directional Movement Index (ADX) continues its downward trend, reaching its lowest level since January. Based on this, the pair is likely to continue its range-bound trading pattern in the coming days, with key levels to watch: 1.3300 and 1.3600. The weekly chart remains within a medium-term upward correction channel; the large-scale bullish structure is intact, but the upward momentum has clearly slowed. Next week, the overall direction is likely to be range-bound, awaiting data to determine the direction. Range-bound trading is preferred, with a low probability of a unidirectional trend. Next week's scenario – bullish scenario: Holding the 1.3400 support, reclaiming 1.3500, targeting the 1.35558 resistance level (last week's high). Prerequisites: A weaker US dollar and weaker-than-expected non-farm payroll data. Range-bound scenario (high probability): The price will oscillate within a large range of 1.3350-1.3500, repeatedly testing the upper and lower limits. Range trading is suitable; avoid chasing highs and lows. Bearish scenario: A decisive break below 1.3400 on the daily chart would lead to further declines towards 1.3340-1.3300; if 1.3300 is breached, the pullback will deepen.
Today, consider going long on GBP at 1.3480, with a stop-loss at 1.3470 and targets at 1.3550 and 1.3560.
USD/JPY
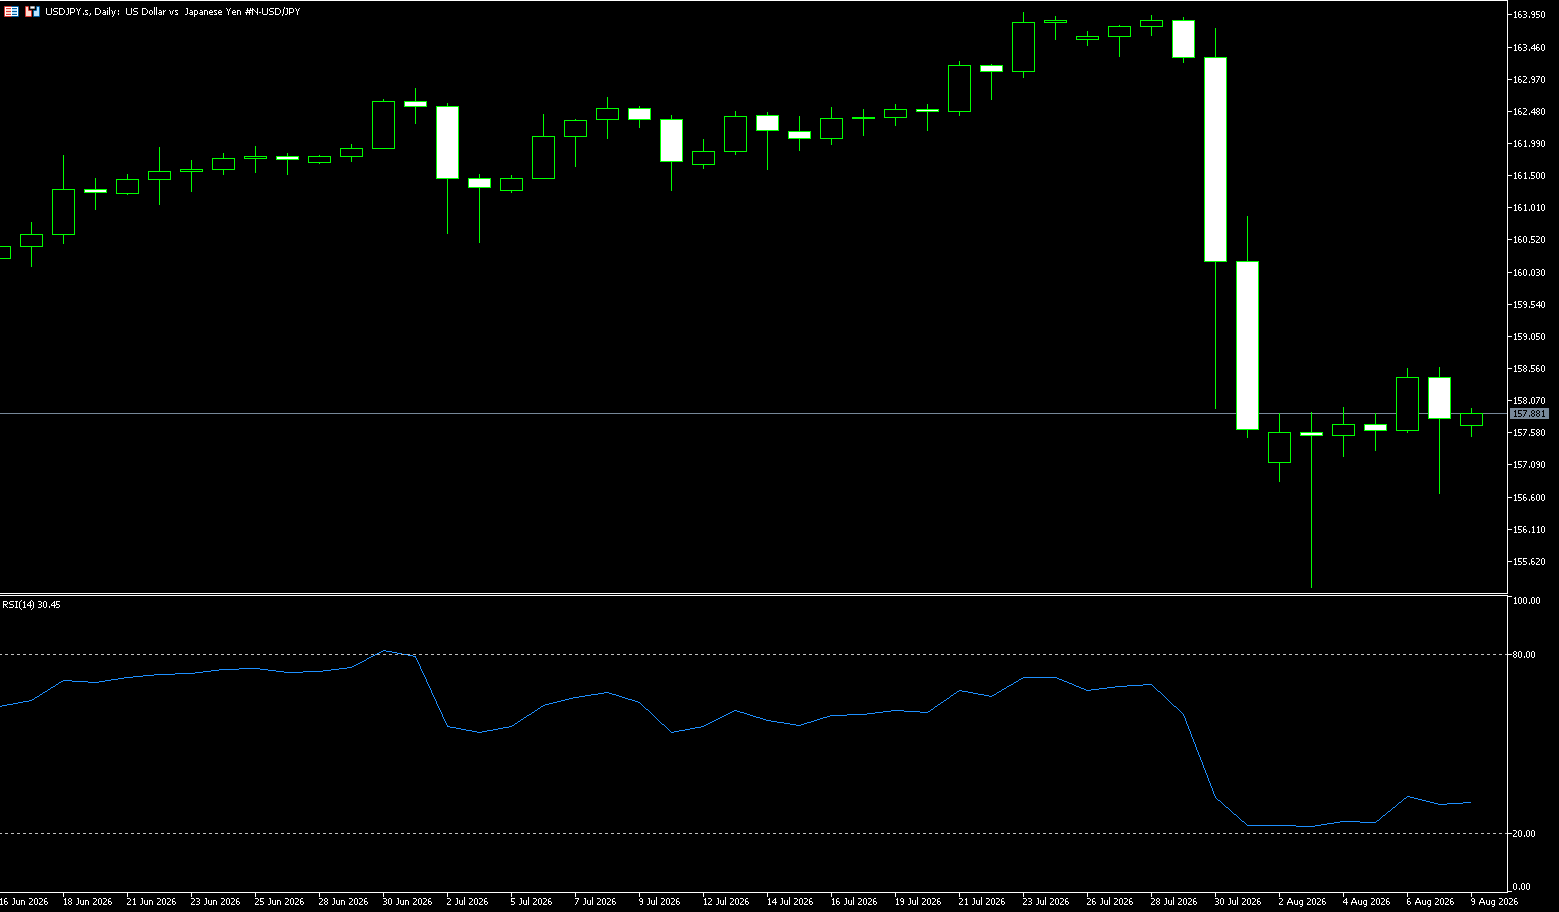
Last week, USD/JPY experienced unusually rapid volatility and is currently hovering around 158.30. The exchange rate had previously risen to around 164 before quickly falling back to around 155.23 following news of joint US-Japan intervention, with daily fluctuations significantly exceeding normal levels. This movement was not solely driven by interest rate differentials. The US provided dollar liquidity to Japan through the Federal Reserve's repurchase agreement (repo) arrangement with foreign official institutions, allowing Japan to reduce its need to directly sell US Treasury bonds to raise funds for intervention. While this financing method avoids impacting the US Treasury market, it also complicates the boundaries between foreign exchange intervention, balance sheet management, and monetary policy. Traditional yen-buying intervention typically requires Japan to sell some dollar assets and then convert the proceeds back into yen. This repo financing method, using US Treasury bonds as collateral to obtain short-term dollars, and then using those dollars to buy yen, reduces the immediate impact on the secondary market for Japanese government bonds.
Over the past two years, the Bank of Japan has raised interest rates five times, while the Federal Reserve has cut rates six times, narrowing the policy rate differential between the two countries from approximately 5.6 percentage points to 2.75 percentage points. Simultaneously, the 10-year government bond yield spread has fallen from a high of over 4 percentage points in 2023 to less than 2 percentage points. According to general interest rate differential logic, rising yen financing costs and declining dollar asset yield advantages should weaken the attractiveness of carry trades. However, market pricing is gradually shifting towards the 2-year yield. Because the Bank of Japan remained cautious about further tightening, and US inflation stickiness led the market to re-priced in the possibility of interest rate hikes, short-term interest rate spreads did not narrow as continuously as long-term spreads. In addition, the yen had previously exhibited low volatility and a one-sided depreciation characteristic, allowing investors to continuously profit from interest rate differentials while bearing relatively limited volatility risk, resulting in a rapid accumulation of short positions. This means that the yen issue has evolved from simply weak valuations to a market structure problem caused by the combined effects of interest rate differentials, volatility, and crowded positions. Intervention can force some short positions to be closed in the short term, but it cannot automatically change the interest rate environment upon which carry trades depend.
Last week, dominated by joint US-Japan intervention, the market exhibited a volatile structure of "sharp drop → rapid rebound and recovery." On the daily chart, Monday's intervention caused the exchange rate to quickly fall from its high to 155.23 (this week's low), a sharp short-term sell-off. The RSI briefly fell into oversold territory, and the MACD histogram expanded, indicating a concentrated release of short-term bearish momentum. Before the weekend, the price rose above the 200-day moving average at 158.06, recovering most of the losses after intervention, shifting from a sharp one-sided decline to a range-bound trading pattern. The weekly candlestick closed with a long lower shadow, indicating strong buying support below, but significant resistance was seen at the psychological level of 160 and the intervention warning zone, preventing a return to the previous one-sided upward channel. Looking at the daily chart, USD/JPY fell rapidly from around 163.98, reaching a low of 155.23, before consolidating in a narrow range around 158.00-158.50. The Bollinger Bands' middle line is at 161.28, and the lower band is around 156.35. The price quickly crossed the middle band from the upper band and approached the lower band, causing a significant expansion of the channel. The MACD indicator shows that the previous rapid decline is still dragging down the trend indicators. Going forward, it's crucial to observe whether three variables re-establish a stable relationship: the USD/JPY short-term interest rate differential, exchange rate volatility, and speculative positions. If the exchange rate continues to deviate from the interest rate differential, it indicates that the market is still assessing the credibility of policy and the sustainability of intervention. If volatility remains high for an extended period, the risk-reward ratio of carry trade strategies will fundamentally change.
Next week's core technical trend: a neutral-to-bullish consolidation pattern. The key focus is whether the price can hold above the 200-day moving average at 158.06. However, the 160 level presents a risk of intervention, and the upside is not limitless. On the downside, 155.23 (last week's low) and 155.00 (a psychological level) are crucial support levels. First resistance: 158.80-159.00, this week's rebound high; a break above this level would open up further upside potential. Strong resistance: 160.00, a psychological level and a warning sign of intervention; near this level, the willingness to short the yen will significantly decrease, and a pullback to support is highly probable. Meanwhile, the first support level is 157.40-157.20, the consolidation zone; a pullback to this level is a crucial defense for the bulls. Key support is 155.20-155.00, the low point of this week's intervention. If the daily chart breaks below 155, the rebound structure is destroyed, and the market reverts to a bearish trend, targeting the 154.10/153 area.
Next week's scenario—bullish scenario (baseline scenario): The exchange rate holds the 157.20 support and stabilizes above 158; it tests 158.8-159.0; it is likely to encounter resistance and pull back near 160, making a one-time strong breakout unlikely. Conditions: No further large-scale intervention; US Treasury yields remain strong. The bearish scenario resulted in a weak rebound and a renewed decline. A break below 157.20 and a close below this level would retest the key support at 155.20. Once 155 is breached on the daily chart, the post-intervention rebound will be over, with a downside target of 154.00-153.90.
Today, consider shorting the US dollar at 158.00, with a stop-loss at 158.20 and targets at 157.10 and 157.00.
EUR/USD
Market downward revisions to Fed rate hike expectations, declining energy prices, and pressure on the dollar from Japanese market intervention have combined to push the euro/dollar pair upward. However, can this upward momentum continue? For most of this year, the euro/dollar has been pressured by a downward trendline, but it has finally broken through. Whether this rally is short-lived or a confirmed trend will likely depend on subsequent US economic data and developments in the Gulf region. One of the key changes over the past week has been the outlook for US interest rates. Despite the latest US economic data still demonstrating overall economic resilience, traders have become more conservative in their assessment of the extent to which the Federal Reserve needs to tighten monetary policy to combat inflation. Even with strong economic data, the market has lowered its expectation for a rate hike before the Fed's June 2027 meeting to approximately 42 basis points. Correlation analysis shows that the euro/dollar exchange rate has been highly correlated with US short-term interest rates over the past week, which can partially explain the recent upward trend in the euro/dollar exchange rate.
Another major positive factor for the euro is market optimism regarding the possibility of a lasting peace agreement in the Middle East. While significant uncertainty remains about whether such an agreement will materialize, this expectation has led to a further decline in energy prices. This is significant for the Eurozone, a major net energy importer. The US, as the world's largest energy producer, enjoys a significant advantage in energy security; in comparison, the decline in oil and natural gas prices has a much stronger positive impact on the Eurozone economy. The easing of energy pressures has weakened a major headwind that has weighed on the euro in recent months. Simultaneously, inflationary pressures from supply shocks have eased, and the European Central Bank no longer needs to take aggressive interest rate hikes, thus avoiding further amplifying the risk of economic downturn. The Japanese market intervention also indirectly benefited the euro. It is extremely rare for the US Treasury to support another country's currency unless against the backdrop of a financial crisis or disorderly market volatility.
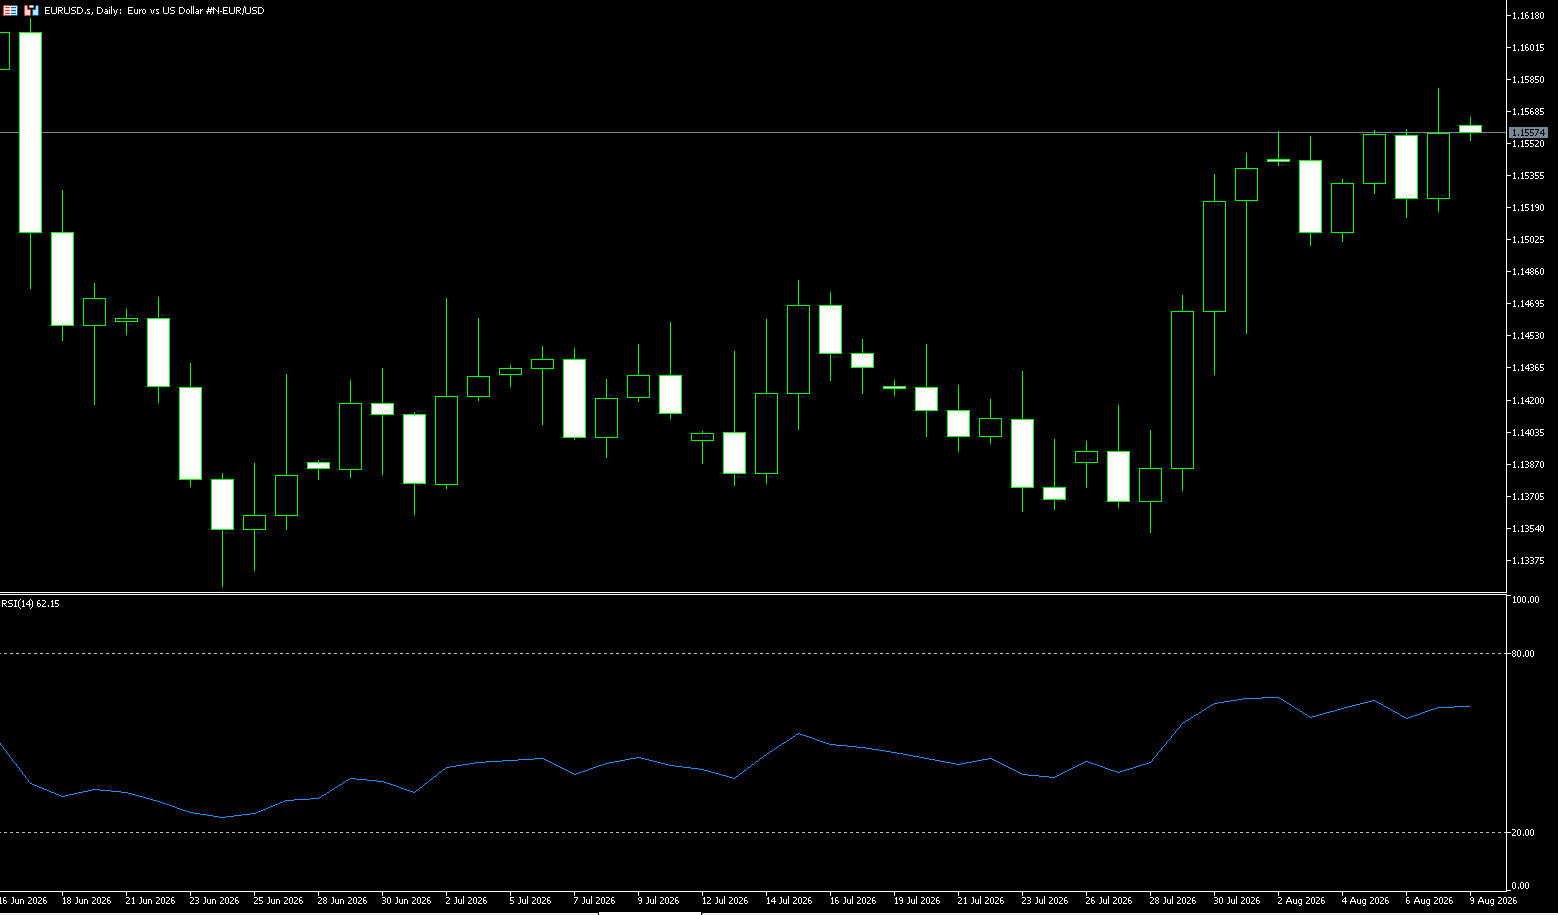
Last week, the exchange rate rebounded from a low of around 1.1450, testing the strong resistance at 1.1581 (last week's high) but failing to break through effectively. It then entered a high-level range-bound trading pattern, with the overall trend upward throughout the week. On the daily chart, the price has stabilized above the 1.1500 (psychological level) mark, indicating a short-term bullish structure. However, it encountered resistance at key levels, and bullish momentum has weakened. Oscillators suggest a continuation of the breakout trend. The daily RSI remains in the 55-60 range, not overbought, indicating some bullish momentum, but the upward slope is slowing, suggesting consolidation to digest the current pressure. The daily MACD histogram remains positive, but the red bars are shortening, indicating weakening upward momentum and a risk of a pullback due to high-level consolidation.
Technically, the short-term downtrend established after the Fed meeting in mid-July has been broken upwards. The price subsequently continued its upward trend, reaching a high of 1.1581 above the 1.1500 (psychological level) and testing the long-term downtrend line that began at the end of January. A false breakout occurred on Monday, with the price falling back to a low of 1.1500; now, the price has rebounded again, closing above this downtrend line, suggesting further upside potential. The 1.1550 level and 1.1558 (last week's high) are key short-term levels and the areas where Monday's price action encountered resistance. If these levels hold, the exchange rate could test the 1.3600 (psychological level) and the 1.1644 (June 5th high) area. However, if the support zone around last week's low of 1.1500 is breached, the exchange rate will likely retrace significantly to the 1.1480 (previous resistance) level, where the support zone coinciding with the 50-day moving average at 1.1470 will also be tested. A break below this support zone would lead to a deeper pullback, heading towards the July low of 1.1353.
Today, consider going long on the Euro at 1.1545, with a stop-loss at 1.1535 and targets at 1.1590 and 1.1600.
Stock Analysis:
Australian ASX 200 Stock Index
Basic Market Overview:
The Australian Securities Exchange (ASX) 200 index fell 0.1% on Friday to close at 9,264 points, ending a five-day winning streak as traders took profits after the index hit two new highs this week. Weakness in US stock index futures also weighed on market sentiment, fueled by reports that Iran might restrict “hostile” vessels in the Strait of Hormuz. Business services, healthcare, technology, and financial sectors declined, but resilience in non-energy mining and manufacturing offset some of the impact. Shares of the four largest banks fell between 1.0% and 1.6%, with other notable declines including Fortescue (-2.3%) and Qantas (-1.1%). Despite this, the market still recorded its second consecutive weekly gain, rising 3.2%, thanks to steady buying and a rebound in Australian exports in June.
In major trading partner China, exports and imports continued to grow at double-digit rates in July, although both slowed compared to June. Traders are now awaiting the Reserve Bank's interest rate decision next week, despite three rate hikes this year, as slowing economic activity and high costs persist.
Sector Performance:
Potential Leading Sectors and Representative Stocks
1. Materials [Strongest Leading Sector]
Driven by: Strong copper, gold, and lithium prices; anticipated Chinese industrial demand; lithium, gold, and large mining companies show the greatest elasticity.
Representative Stocks: BHP Billiton, Rio Tinto, Northern Star (NST), Evolution Mining (EVN), Liontown (LTR)
2. Healthcare
Driven by: Defensive attributes; positive earnings reports from some healthcare companies during earnings season; foreign investment demand.
Representative Stocks: CSL, Cochlear, Ramsay Health Care
3. Information Technology (IT)
Driven by: Overseas AI fund rotation; local cloud and data center stocks; volatility follows US tech stocks; a highly volatile sector.
Representative Stocks: NextDC (NXT), WiseTech Global (WTC)
Potential Lagging Sectors & Representative Stocks
1. Banking/Financial Sector
Driven by: RBA 1. **Interest Rate Decision Uncertainty, Downward Pressure on the Real Estate Sector, Concerns about Mortgage Bad Debts, Valuation Pressure After Previous Surge, Big Four Banks Likely to Be Targeted for Profit-Taking:**
**Representatives:** Commonwealth Bank (CBA), Westpac (WBC), ANZ, National Australia Bank (NAB)
2. **Real Estate:**
Driven by: Persistent high interest rates, pressure on Australian house prices, slowing rental growth, and weak fundamentals.
Representatives: Large real estate trusts (GPT), Stockland
3. Energy Sector:
Driven by: Fluctuating international crude oil prices, volatile Middle East situation, and a potential drop in oil prices that could suppress sector performance.
Representatives: Woodside (WDS), Santos (STO)
Technical Analysis:
The ASX 200 closed at 9263.80 on Friday, a weekly gain of +3.18%, marking its second consecutive week of gains, with two intraday new all-time highs. The ASX 200 showed strong upward momentum last week, reaching 9000 on Monday. After reaching a key psychological level, the price surged, peaking at 9302 during the week. Friday saw a slight pullback due to profit-taking, closing down 0.10% and ending a five-day winning streak. The weekly chart closed with a large bullish candle, indicating a strong uptrend. However, the RSI is approaching overbought territory, suggesting potential short-term profit-taking pressure. The RSI-14 is around 66, nearing overbought territory, indicating weakening momentum for further gains and a potential technical correction. The price is well above the 20-day and 50-day moving averages, maintaining a healthy medium-term uptrend. The 20-day moving average, around 9040, serves as significant medium-term support. Weekly chart: A large bullish candle indicates continued upward movement, and the weekly MACD remains bullish. However, the stochastic oscillator is at high levels, suggesting a need for consolidation at the weekly level. It is not advisable to blindly chase the price higher.
Next Week's Scenario – Bullish Scenario (RBA Dovish + US CPI Cooling): The Reserve Bank of Australia releases a dovish statement, while US inflation falls short of expectations, boosting risk appetite. The index has stabilized above 9200, challenging the historical high of 9290-9310; however, with the RSI at a high level, it is likely to experience a period of consolidation after the initial surge, making a one-sided sharp rise unlikely. Neutral consolidation scenario (baseline scenario): The RBA maintains its interest rate unchanged, indicating a neutral stance; US CPI meets expectations. The index will fluctuate widely within the 9100-9310 range, digesting the large amount of profit-taking from this week at higher levels. Correction scenario (hawkish RBA / higher-than-expected US CPI): The Fed indicates it retains the possibility of future rate hikes, or a rebound in US inflation pushes up global bond yields; the index breaks below the 9180 support level, further testing the strong support zone of 9080-9100.
Trading Strategy:
Trading Strategy (Short-term trading perspective):
Short-term bullish: As long as it holds above 9180, a bullish bias can be maintained; near the 9290-9310 resistance zone, chasing the price higher is not recommended; take profit and protect your positions.
Short-term defense: A decisive break below 9180 would reduce long positions; a further break below 9080-9100 would weaken the short-term trend, so avoid chasing the rally.
Swing: The medium-term trend is upward, but currently at historical highs, valuations have already risen. Prioritize buying on dips and avoid heavy positions at high levels.
Key risk warnings:
The Reserve Bank of Australia (RBA) released a hawkish statement, retaining the option of further rate hikes, directly suppressing the local stock market, especially the banking and real estate sectors.
US inflation rebounded more than expected, and global US Treasury yields rose, suppressing valuations in growth and resource sectors.
Significant fluctuations in commodity prices such as iron ore and lithium, with a high weighting in the ASX200 resource index, will cause significant index volatility; changes in Chinese domestic demand data will also affect resource stocks.
The index is at historical highs, with substantial short-term gains and significant profit-taking, making a rapid correction possible at any time.
Dow Jones Industrial Average
Basic Market Overview:
U.S. stocks continued their upward trend on Friday, with the S&P 500 and Nasdaq Composite both rising again. Investors interpreted the unexpected drop in July's non-farm payrolls as a signal that the Federal Reserve would not need to raise interest rates further in the short term, driving up risk assets.
The S&P 500 rose 0.62% to close at 7757.64, a record closing high; the Nasdaq Composite performed even better, rising 1.3% to close at 26690.62; and the Dow Jones Industrial Average rose 151.83 points, or 0.28%, to close at 54036.93. U.S. stocks achieved their second consecutive week of gains. The S&P 500 rose 3.6% cumulatively, closing above 7700 for the first time this week; the Nasdaq rose 5.2%, its best weekly performance since April, mainly driven by a rebound in chip stocks. The Semiconductor ETF (SOXX) rose more than 7% this week, and the Dow rose nearly 3% over the same period, with all three major indices recording their best weekly performance since April. Sector Performance:
Predicted Leading Sectors & Key Component Stocks (Top 30 Dow Jones Stocks)
1. Industrial Heavy Industry Sector
Logic: Strong infrastructure and capital expenditure, Caterpillar's better-than-expected performance, and upward revision of full-year guidance boosted sector sentiment.
Representative Stocks: CAT (Caterpillar), HON (Honeywell).
2. Healthcare Sector
Logic: Defensive attributes are prominent; UnitedHealth and Amgen showed strong performance resilience during the earnings season, attracting funds to seek safe haven at high levels. Representative Stocks: UNH (UnitedHealth), AMGN (Amgen), MRK (Merck).
3. Large-Scale Technology (AI Cloud)
Logic: Continued AI capital expenditure, resilience of Microsoft's cloud business, and Nvidia's computing power chain drive, with internal differentiation within the sector.
Representative Stocks: MSFT (Microsoft), NVDA (Nvidia).
Predicted Leading Sectors & Key Component Stocks
1. Aviation & Defense Industry
Logic: Boeing orders and delivery progress are falling short of expectations, resulting in heavy profit-taking pressure at high levels. High price weighting significantly drags down the index.
Representative Stock: BA (Boeing).
2. Enterprise Software & Technology
Logic: CRM (Salesforce) saw significant gains previously, leading to high valuations. A pullback is likely when earnings guidance falls short of expectations.
Representative Stock: CRM (Salesforce).
3. Large Financial Institutions (Investment Banks)
Logic: Easing interest rate expectations and volatility in Goldman Sachs' trading business make it prone to rapid pullbacks following risk appetite.
Representative Stock: GS (Goldman Sachs).
Technical Analysis:
Last week, the Dow Jones Industrial Average initially surged, continuously setting new historical highs. Mid-week, it reached a high of 54744.33. Thursday saw a significant profit-taking pullback of -0.85%, followed by a rebound on Friday. The week exhibited a high-level consolidation pattern of "surge-pullback-recovery," with the weekly chart closing as a solid bullish candle. Dow Jones Industrial Average (DJIA) Overall Trend: The weekly chart maintains an upward channel, having just reached a new all-time high before entering a period of high-level consolidation. Weaker-than-expected non-farm payroll data strengthened expectations of a Fed rate hike pause, which is positive for US stocks. However, the short-term RSI has entered overbought territory, suggesting potential downward pressure. Technical Indicators (Daily): RSI-14: 59-60 range, not yet extremely overbought, but already in a high range, indicating a risk of pullback. The price has stabilized above the 20-day moving average, maintaining a healthy medium-term upward trend; the 50-day moving average provides medium-term support below. Weekly Chart: A large bullish candle closed higher, and the weekly MACD remains bullish, but the Stochastic indicator is approaching overbought territory, suggesting a need for consolidation at the weekly level.
Key Events Next Week: US July CPI and PPI inflation data, retail sales. Inflation data will directly impact Fed rate hike expectations, amplifying index volatility. Next Week's Scenario – Bullish Scenario (Cooling CPI): Lower-than-expected CPI further cools rate hike expectations. The index has stabilized above 54000, testing the historical high range of 54400-54750. High-level fluctuations are expected, with a strong one-sided surge unlikely. Neutral scenario (CPI meets expectations): The index will likely fluctuate within the large range of 53300-54500, digesting profit-taking at higher levels. Wide-range fluctuations are the baseline scenario for next week. Pullback scenario (CPI exceeds expectations): Inflation rebounds, raising expectations of interest rate hikes again. The index may break below 53800, further testing the strong support at 53200.
Trading Strategy:
Bull: If the index retraces to the 52850-53100 support zone and stabilizes, a rebound towards 54700 is possible. If it directly surges above 54900 but fails to break through, chasing the price higher is not advisable.
Bear: A decisive break below 52800 signals a short-term bearish outlook, targeting the 51800 area.
Key Risk Warnings:
An unexpected rebound in inflation data could reignite expectations of a Fed rate hike, triggering a significant pullback in US stocks from their current highs.
Geopolitical conflicts and oil price volatility could disrupt inflation expectations, causing sharp index fluctuations.
The index is currently at historically high levels, with valuations relatively high, and profit-taking could occur at any time.
Disclaimer: The information contained herein (1) is proprietary to BCR and/or its content providers; (2) may not be copied or distributed; (3) is not warranted to be accurate, complete or timely; and, (4) does not constitute advice or a recommendation by BCR or its content providers in respect of the investment in financial instruments. Neither BCR or its content providers are responsible for any damages or losses arising from any use of this information. Past performance is no guarantee of future results.
Lebih Liputan





Pendedahan Risiko:Instrumen derivatif diniagakan di luar bursa dengan margin, yang bermakna ia membawa tahap risiko yang tinggi dan terdapat kemungkinan anda boleh kehilangan seluruh pelaburan anda. Produk-produk ini tidak sesuai untuk semua pelabur. Pastikan anda memahami sepenuhnya risiko dan pertimbangkan dengan teliti keadaan kewangan dan pengalaman dagangan anda sebelum berdagang. Cari nasihat kewangan bebas jika perlu sebelum membuka akaun dengan BCR.
BCR Co Pty Ltd (No. Syarikat 1975046) ialah syarikat yang diperbadankan di bawah undang-undang British Virgin Islands, dengan pejabat berdaftar di Trident Chambers, Wickham’s Cay 1, Road Town, Tortola, British Virgin Islands, dan dilesenkan serta dikawal selia oleh Suruhanjaya Perkhidmatan Kewangan British Virgin Islands di bawah Lesen No. SIBA/L/19/1122.
Open Bridge Limited (No. Syarikat 16701394) ialah syarikat yang diperbadankan di bawah Akta Syarikat 2006 dan berdaftar di England dan Wales, dengan alamat berdaftar di Kemp House, 160 City Road, London, England, EC1V 2NX. Open Bridge Limited bertindak semata-mata sebagai pemproses pembayaran untuk BCR Co Pty Ltd dan tidak menyediakan sebarang perkhidmatan kewangan, perdagangan atau pelaburan bagi pihaknya. Peranan Open Bridge Limited adalah terhad kepada pemprosesan pembayaran.


 English
 简体中文
简体中文
 繁體中文
繁體中文
 Bahasa
Melayu
Bahasa
Melayu
 Tiếng
Việt
Tiếng
Việt
 ไทย
ไทย
 日本語
日本語
 한국어
한국어
 ភាសាខ្មែរ
 español