


0
US Dollar Index
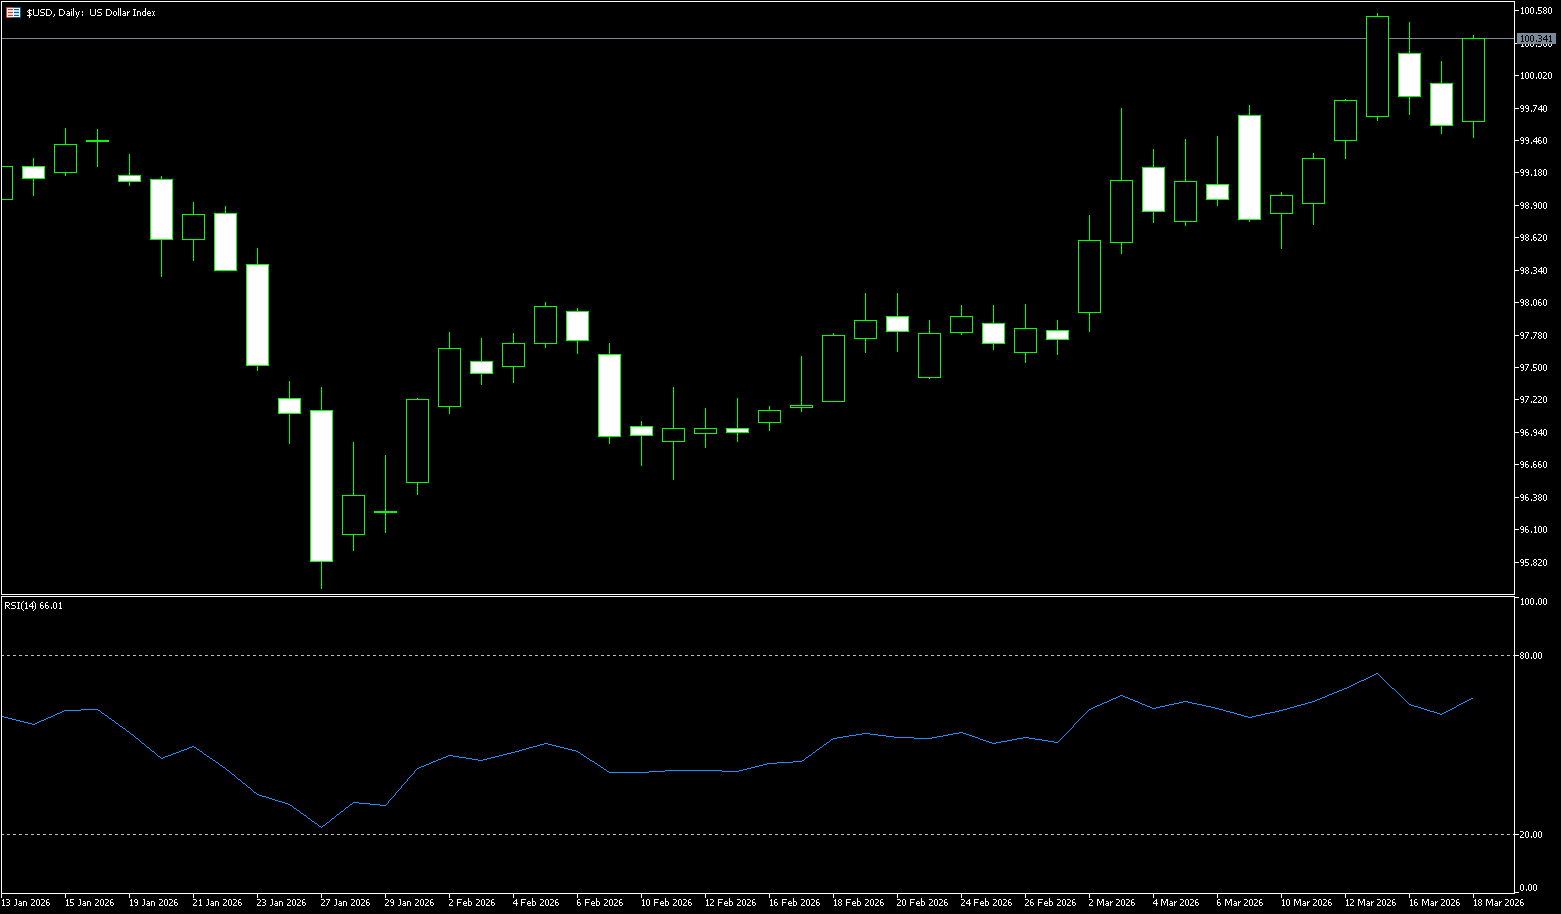
The US dollar index broke through 100 on Wednesday as traders assessed the Federal Reserve's latest monetary policy decision. The central bank, as expected, kept the federal funds rate unchanged, noting that the economic impact of the war with Iran remains uncertain, while also warning of persistently high upside risks to inflation. However, it still projects one rate cut this year and another in 2027, consistent with its December outlook. The timing of these rate cuts remains unclear, though investors currently expect action in December or January. Meanwhile, traders continue to monitor developments in the war with Iran, with attacks ongoing and oil prices fluctuating. To stabilize the oil market, President Trump issued waivers for the Jones Act, stating that this "will allow essential resources such as oil, natural gas, fertilizer, and coal to flow freely into US ports for 60 days."
Looking at recent trends, the dollar has retreated from its 2026 high of around 100.54 reached last week, with a monthly gain of around 1.9% and a decline of approximately 3.5%-3.6% over the past year. The market remained cautious on the first day of the Fed's two-day FOMC meeting (no decision released). Meanwhile, the short-term easing of oil prices due to the Middle East conflict led some safe-haven funds to flow back into risk assets, putting pressure on the dollar but maintaining its overall resilience. Overall Outlook: Short-term buy signals are dominant, but caution is needed regarding a directional breakout triggered by the FOMC outcome. Short-term Structure: The dollar index is oscillating at a high level between 99.50 and 100.54. After yesterday's sharp drop, it stabilized today. The MACD golden cross signal remains valid, and although the RSI is close to overbought, no significant divergence has appeared, indicating that short-term bullish momentum is dominant. Key Levels: Resistance is at 100.30-100.50 (psychological level + recent high), a break above which could lead to higher levels; support is at 99.16 (14-day moving average)-99.00 (psychological level), a break below which could trigger an accelerated pullback to around 98.50.
Today, consider shorting the US Dollar Index at 100.30, with a stop-loss at 100.40 and targets at 99.80 and 99.70.
WTI Crude Oil
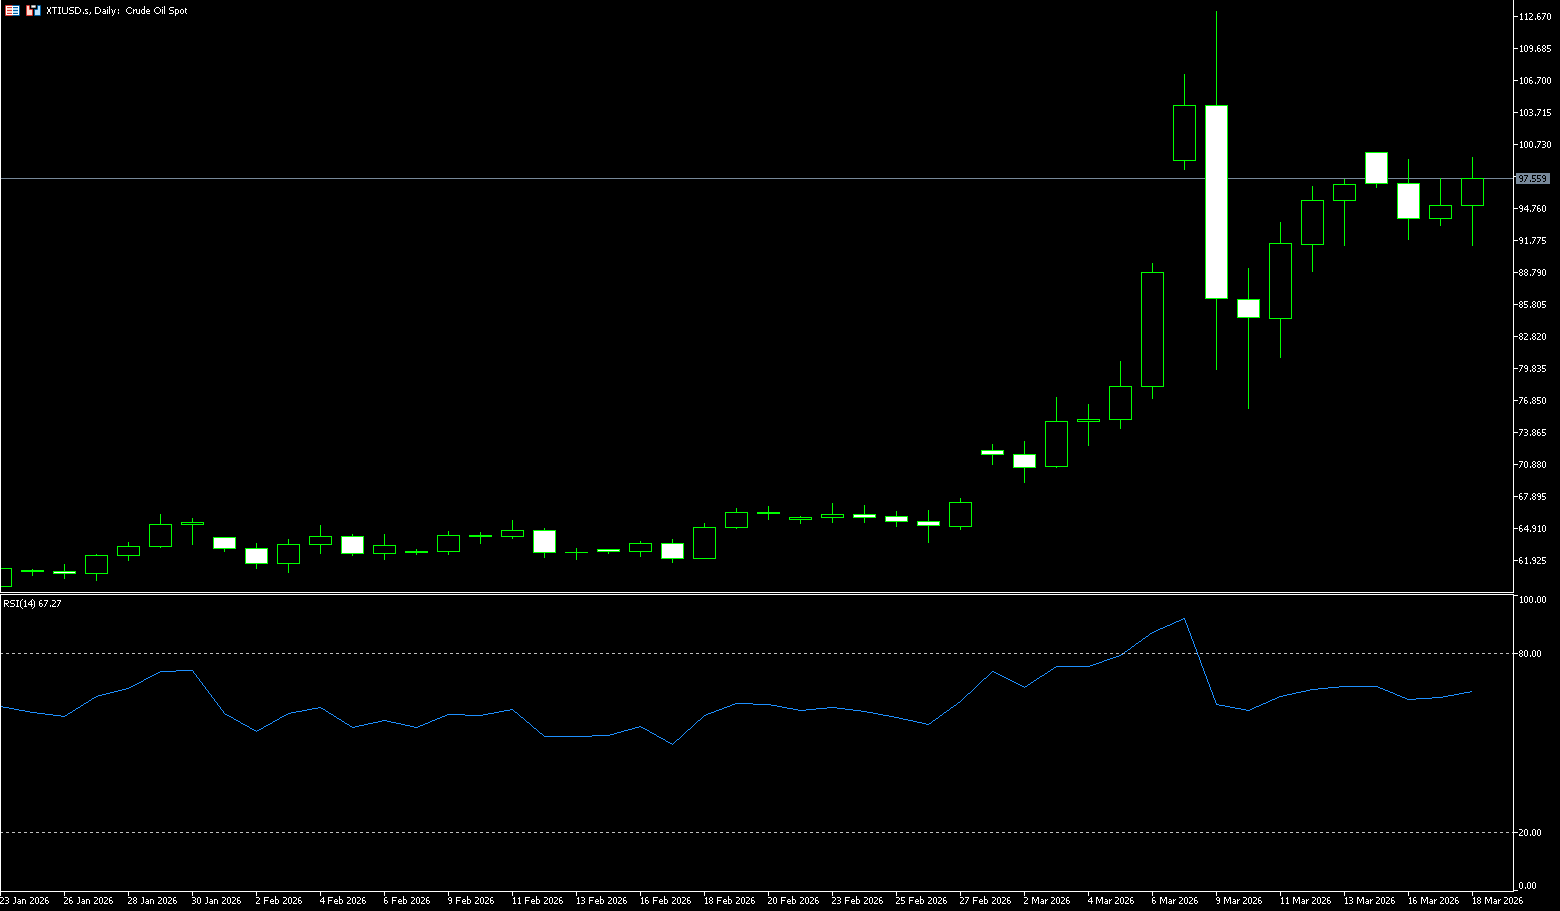
Oil prices rose as geopolitical tensions continued to escalate. An Iraq-Turkey export agreement helped alleviate concerns about immediate supply disruptions. Rising US crude oil inventories indicated weaker demand conditions, exacerbated by Iran's renewed attack on the UAE, which intensified market concerns about a deteriorating global supply outlook. Iran's third attack on the UAE in four days caused partial disruptions to oil shipments from the port of Fujairah, a key export point representing approximately 1% of global demand. Sources said the de facto closure of the Strait of Hormuz has forced the UAE, OPEC's third-largest oil producer, to cut production by more than half. Although White House economic advisors stated that tankers are "beginning sporadic passage" through the strait and expect the conflict to last for weeks rather than months, analysts believe the risks remain significant, and any attack on tankers could easily escalate the situation again. Traders are bracing for a prolonged supply disruption, which could keep oil prices high. Technical analysis indicates that the medium-term resistance level for US crude oil is $124 per barrel.
The most direct pressure on inflation comes from oil prices. Before the conflict, WTI crude oil was around $73 per barrel; it has now repeatedly broken through $100, reaching a high of $113.28, and is currently hovering in the $90-$100 range, with a cumulative increase of over 40%. The de facto closure of the Strait of Hormuz has led to supply disruptions, and the consensus in the market is that oil prices will remain above $100 under a prolonged blockade. Therefore, the future trend of crude oil is high-level fluctuation: In the short term (within a few weeks), both sides will continue to "talk" and engage in limited escalation—Trump emphasizes the maritime coalition, while Iran insists on its bottom line of "compensation + guarantees." Oil prices will fluctuate at high levels (high probability above $100), and if Iran attacks targets in the Gulf again, there may be a brief surge. As for the medium term (several months), the possibility of the US being dragged into a war of attrition lasting 6-8 weeks or more is increasing. If Trump successfully declares victory and reopens the Strait of Hormuz, oil prices are expected to fall back to $80-90; otherwise, maintaining the new normal of $100 will come at a cost to the global economy. In the long term, this "unexpected" war has reshaped the Middle East landscape, with the US mired in a quagmire and Iran becoming more aggressive. Trump's flexibility will be key—but currently, he seems more inclined to remain in a difficult position than to hastily withdraw. This war has transformed from a "precision operation" into an "unexpected quagmire," with oil prices and geopolitical realities becoming the cruelest judges. The core reason Trump is unwilling to withdraw is that acknowledging the "unexpected" outcome is tantamount to admitting the worst-case scenario has come true.
Today, consider going long on spot crude oil at 98.40, with a stop-loss at 98.20 and targets at 100.00 and 102.00.
Spot Gold
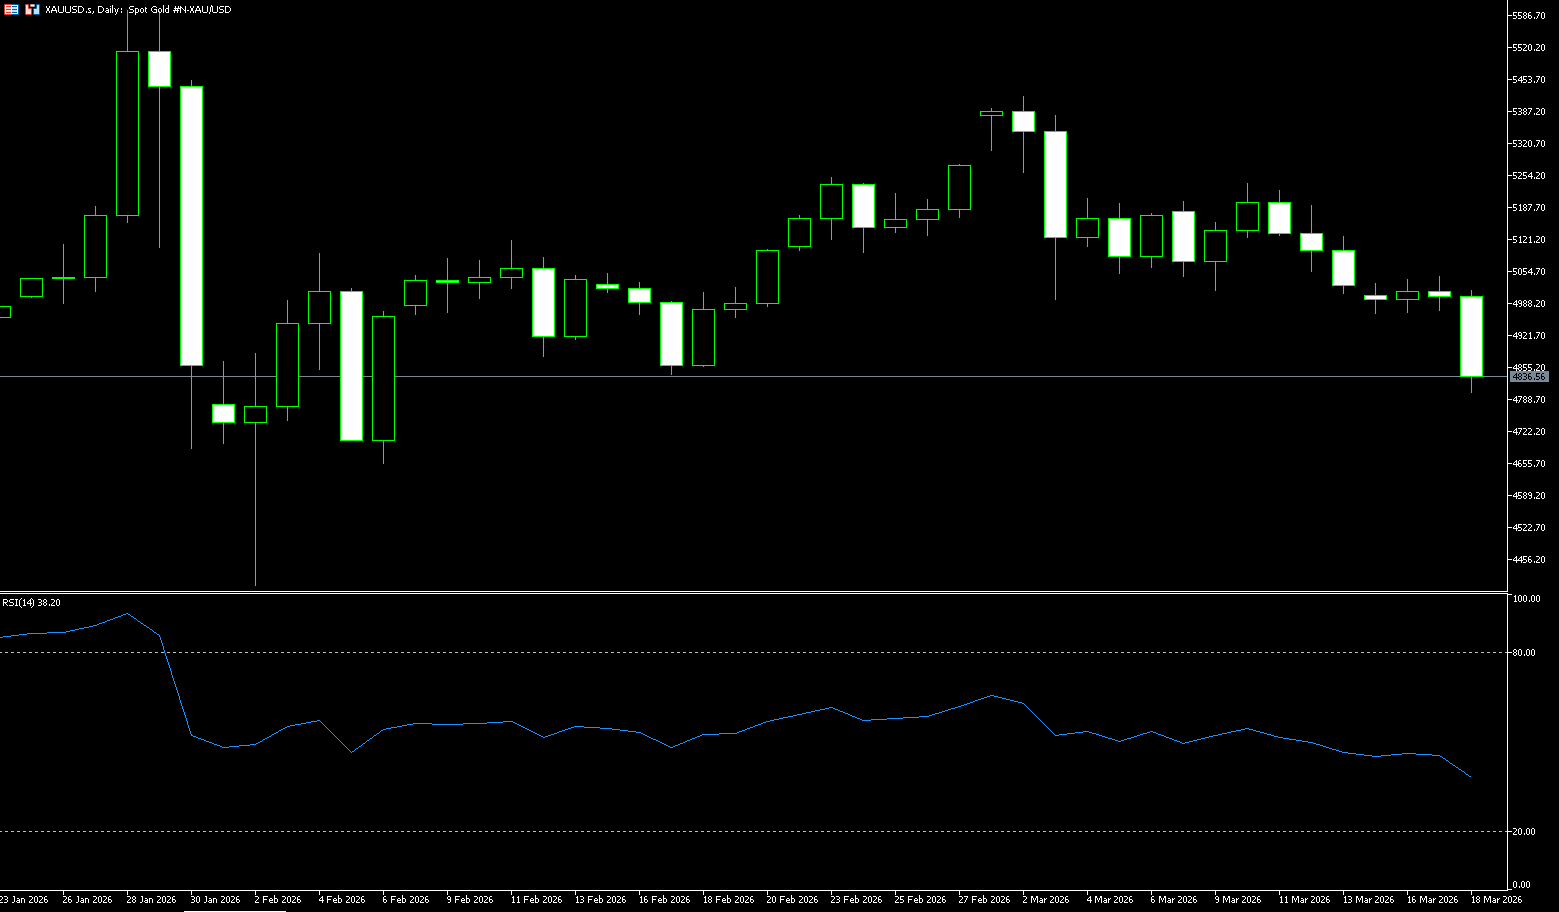
Gold futures fell to around $4,800 per ounce on Wednesday as the Federal Reserve's continued hawkish stance and high Treasury yields offset the safe-haven appeal of the escalating Middle East situation. The Federal Open Market Committee (FOMC) kept the federal funds rate at its target range of 3.5%–3.75% for the second consecutive meeting, while hinting at only one possible rate cut in 2026. Although gold initially received some support due to reports of airstrikes on Iran's South Pars gas field and the killing of Intelligence Minister Esmayir Khatib, central bank concerns about inflation risks strengthened the dollar, increasing the opportunity cost of holding non-yielding assets. Policymakers noted that despite sluggish job growth and signs of a slowing labor market, the uncertain economic impact of an effective closure of the Strait of Hormuz necessitates a tighter monetary policy.
If the Fed keeps rates unchanged this week (70% probability), and lowers its dot plot forecast for rate cuts this year to one or fewer, with Powell emphasizing the stickiness of inflation and the necessity of high interest rates, gold prices may test support at $4,900-$4,950. A break below $5,000 could lead to a further test of $4,800. Additionally, if the Federal Reserve holds rates steady (20% probability), the current technical picture for London gold prices shows a slightly bearish but strong support level. On the daily chart, gold prices have broken below the 5-day moving average, the MACD has formed a death cross, and the RSI has fallen back to the neutral zone, indicating short-term bearish dominance. Key support levels: $4,800 (psychological level + densely traded area), $4,655 (February low), with strong buying pressure awaiting direction from the Fed's decision. Key resistance level: $4,878 (60-day moving average).
Today, consider going long on spot gold at $4,820, with a stop-loss at $4,810 and targets of $4,870 and $4,900.
AUD/USD
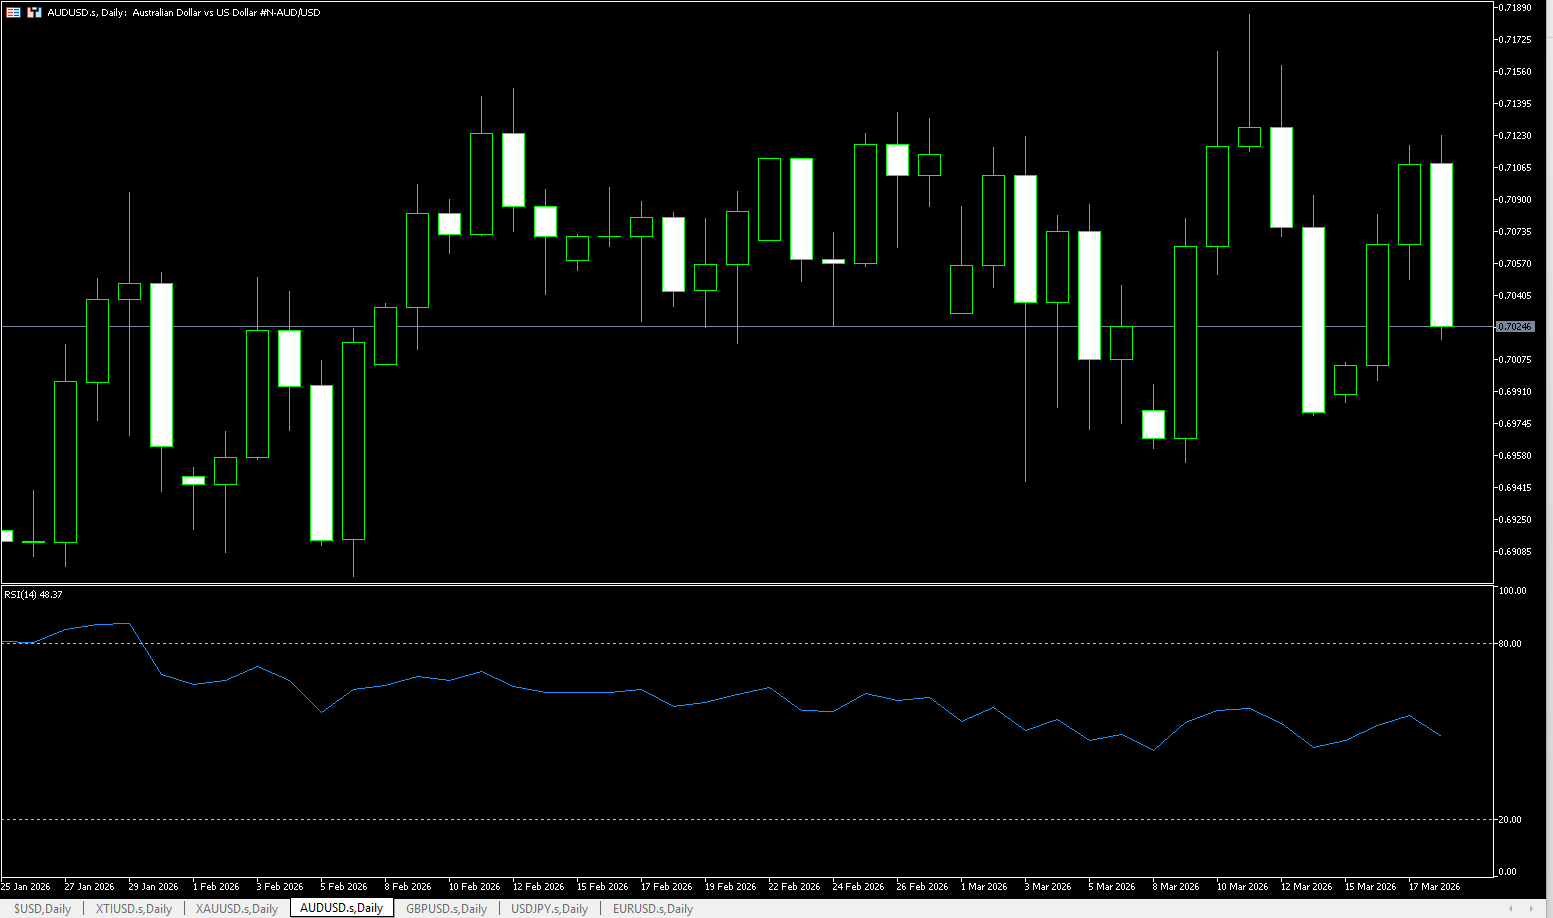
The Australian dollar rebounded against the US dollar after the Reserve Bank of Australia's rate hike and is currently trading around 0.7060, finding support after testing key technical support. The market is digesting the impact of the RBA's latest monetary policy decision. The Reserve Bank of Australia (RBA) raised the cash rate by 25 basis points to 4.1%, in line with broad market expectations. However, the board's decision, passed by a narrow 5-4 majority, reflects growing internal disagreement on the necessity and pace of the rate hike. This decision reflects heightened vigilance regarding resurgent inflationary pressures, coupled with external geopolitical factors pushing up fuel prices, further increasing short-term inflation expectations. The policy statement specifically mentioned that while financial conditions have tightened, the extent of current policy constraints remains uncertain, and the RBA will maintain a data-dependent approach going forward. While a minority opinion may favor further observation of data before action, the majority demonstrates the central bank's determination to anchor inflation expectations.
Following the policy's implementation, the Australian dollar reacted ambivalently to the US dollar, initially fluctuating around key moving averages before turning upwards as risk assets recovered. As a typical resource-based currency, the Australian dollar is sensitive to global demand. While current geopolitical factors are pushing up energy prices, they are also amplifying uncertainty. Traders need to pay attention to subsequent data to confirm the inflation path. If fuel prices remain high or domestic demand does not show a significant slowdown, the RBA's data-dependent approach may tighten further. In the short term, exchange rate fluctuations will revolve around technical levels, with a break or fall below key moving averages signaling a shift in market sentiment. Initial resistance lies near the recent upper limit at 0.7158, reinforced by the previous swing high at 0.7147, followed by the psychological level of 0.7200. On the downside, immediate support appears at the 40-day simple moving average at 0.7045. A daily close below 0.7045 would expose support at the psychological level of 0.7000.
Consider going long on the Australian dollar today at 0.7020, with a stop loss at 0.7010 and targets of 0.7070 and 0.7080.
GBP/USD
The GBP/USD pair remained stable after rising in the previous two trading days, hovering around 1.1280 during Wednesday's European session. Limited volatility was observed as investors remained cautious ahead of the Fed's policy decision later in the day, with the dollar holding steady. Traders are focused on Federal Reserve Chairman Jerome Powell's guidance on how the recent surge in oil prices might affect the central bank's policy outlook. Traders expect the Bank of England to keep interest rates unchanged at 3.75% on Thursday. Rising oil prices, driven by the ongoing conflict with Iran, have boosted UK inflation expectations and significantly reduced the likelihood of a March rate cut. Prior to the conflict, the market had anticipated an 80% probability of a March rate cut; a split vote will be closely watched, with a 6-3 result indicating a more dovish bias than the expected 7-2 consensus.
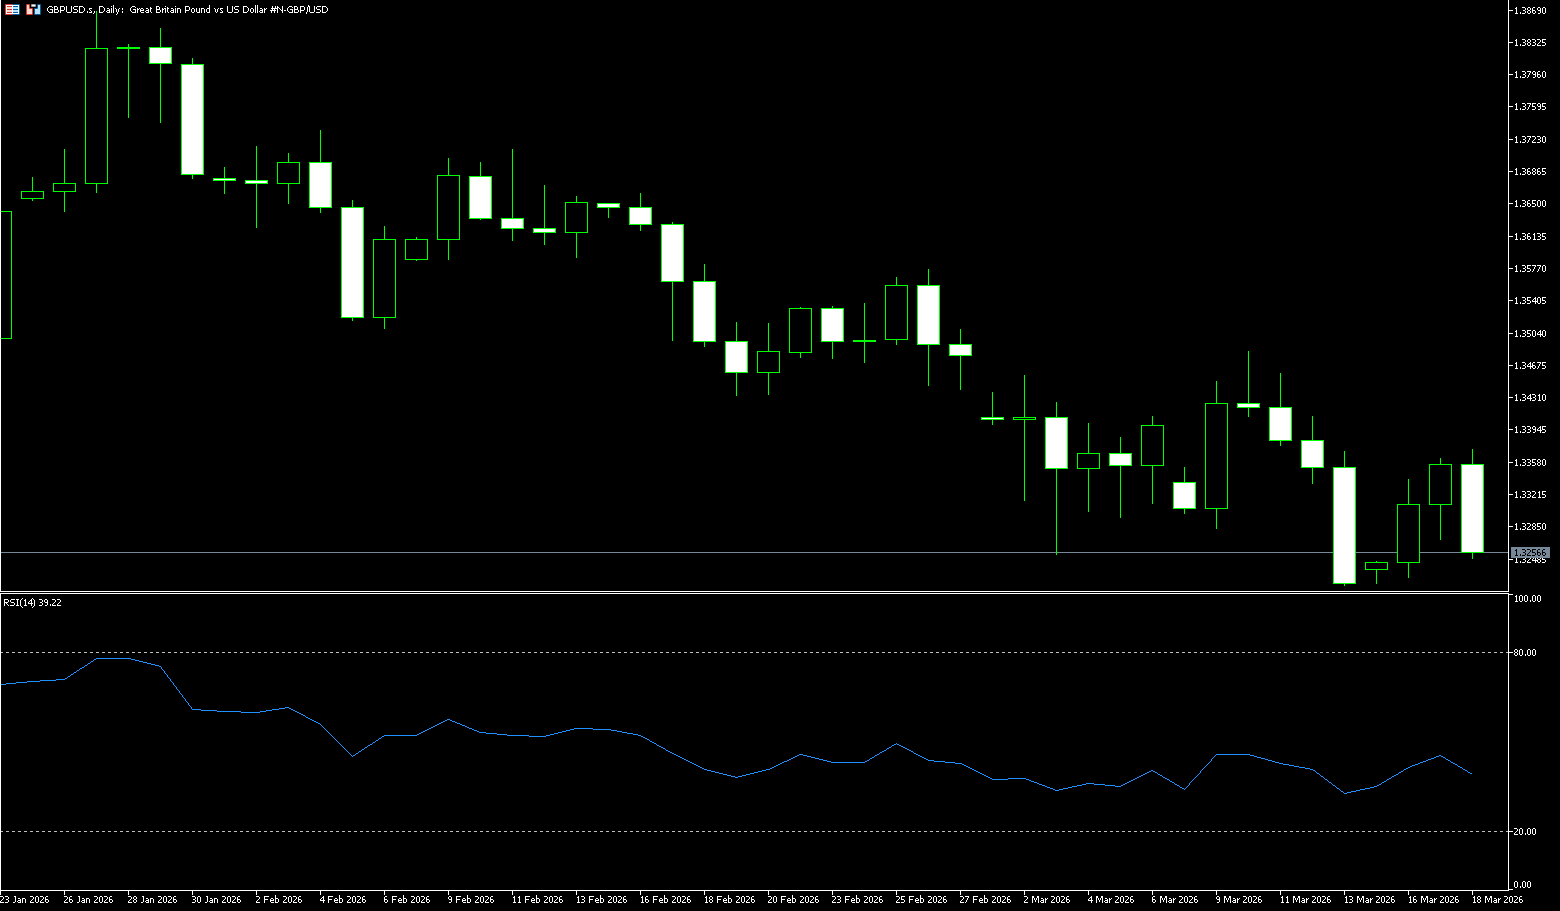
On the daily chart, GBP/USD is trading at 1.3280. The pair is trading below the 5-day moving average near 1.3321, while remaining well below the 200-day moving average at 1.3436, maintaining a mildly bearish trend in the short term. The recent consecutive decline from the 1.36 range to the 1.33 range has confirmed selling pressure, although the stochastic oscillator has stabilized in the high 20 range, suggesting that downward momentum is weakening rather than accelerating. Immediate resistance levels are at 1.3400 (psychological level) and 1.3436 (200-day moving average zone), a break above which would expose the 1.3509 area near the 50-day moving average. A daily close above this resistance would help alleviate the downside bias and open the way to 1.3550. On the downside, initial support levels are the recent 1.3258 (lower Bollinger Band on the daily chart) and 1.3218 (this week's low).
Consider going long on GBP at 1.3250 today, with a stop loss at 1.3240 and targets at 1.3310 and 1.3320.
USD/JPY
The Japanese yen traded around 159.60 per dollar on Wednesday, maintaining gains from earlier in the week as investors anticipated a meeting between Prime Minister Sanae Takashi and US President Donald Trump this week. Japan faces a diplomatic balancing act as Trump initially urged Japan to send warships to the Strait of Hormuz but subsequently withdrew the request. Given Japan's dependence on Middle Eastern oil and its historical ties with Iran, it also faces pressure to protect its interests. The yen's depreciation amid the Iran war and soaring oil prices has put pressure on Japan's oil-importing economy. Verbal intervention from Tokyo helped limit further declines, keeping the currency stable. Meanwhile, Japanese exports rose 4.2% year-on-year in February, exceeding the expected 1.6%, but slowing significantly from January's 16.8% surge.
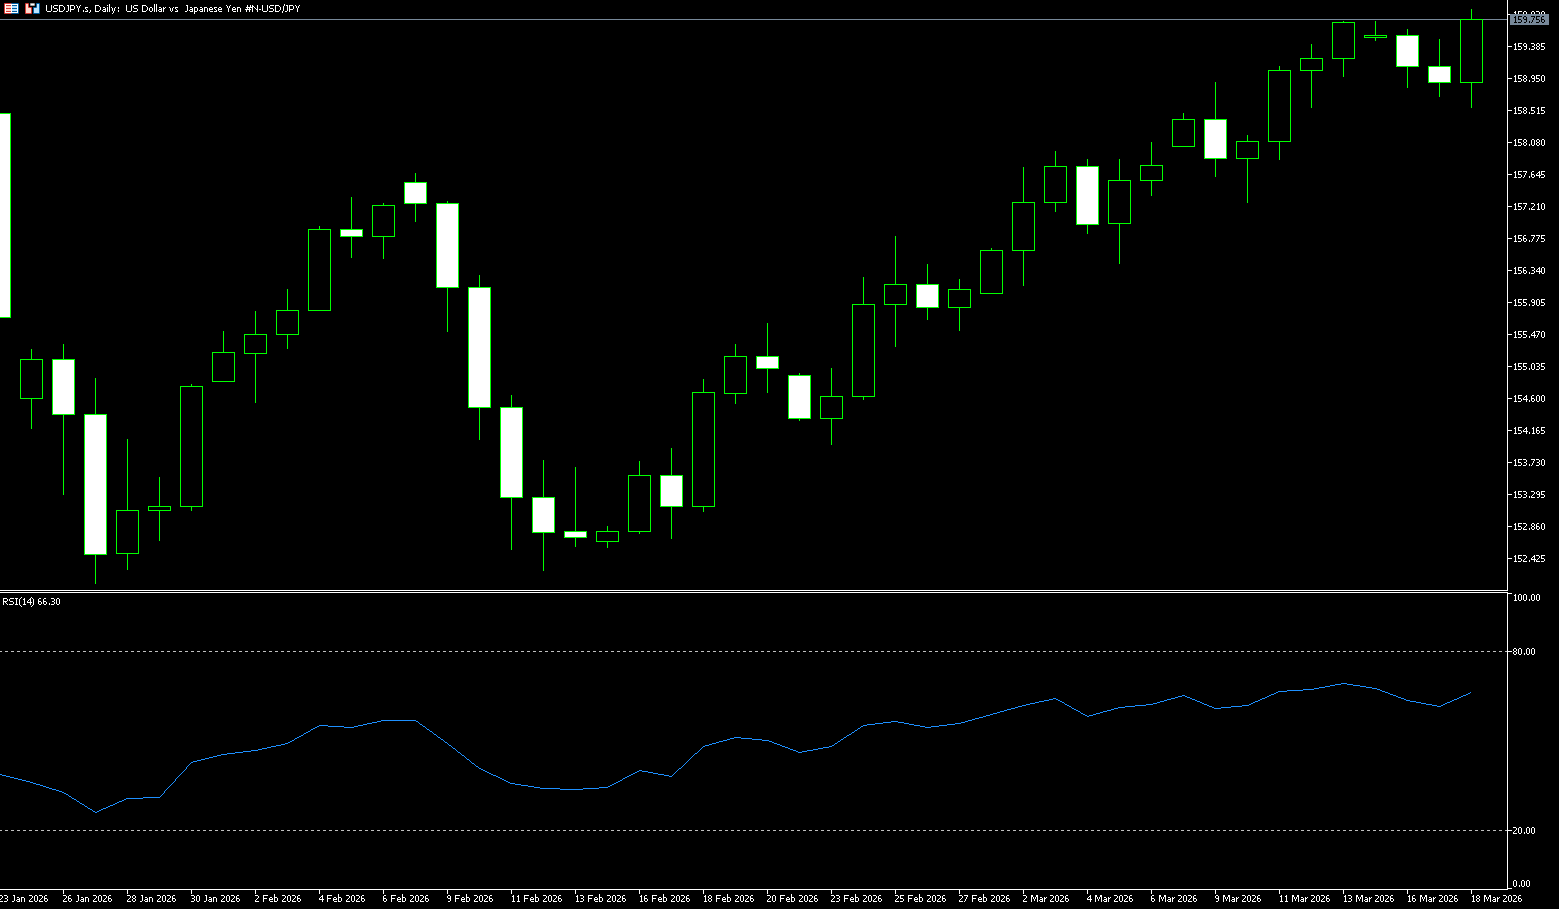
On the daily chart, USD/JPY is trading at 159.60. The short-term bias is bullish, as the spot price firmly above the 50-day simple moving average near 156.50 confirms the integrity of the medium-term uptrend. Price action quickly recovered from the early-month decline towards the 152.00 {200-day simple moving average}, and the current pair is consolidating below last week's highs, maintaining interest in buying on dips. The stochastic oscillator remains deep in overbought territory, exceeding 90, indicating strong upward momentum, but also warning that the risk of further upside continuation could be exhausted if new highs fail to attract follow-through demand. Initial support appears at 158.00, where recent minor consolidation aligns with the short-term trend structure, followed by the 20-day simple moving average near 157.39, serving as a more significant downside support level. A break below this area would expose the 50-day simple moving average area around 156.50 as the next support zone. On the upside, immediate resistance is at 159.50, just before the recent high of 159.75; a daily close above this range would open the way to the 160.50 area.
Consider shorting the US dollar at 159.90 today, with a stop loss at 160.19 and targets at 159.00 and 158.90.
EUR/USD
The euro/dollar pair retreated slightly after gains in the previous two days, hovering around 1.1480 during Wednesday's trading session. Market activity was limited as the dollar remained stable, and investors remained cautious awaiting the Federal Reserve's policy decision later in the day. Traders were particularly focused on Fed Chairman Jerome Powell's guidance on how the recent surge in oil prices might affect the central bank's policy outlook. Oil prices continued to climb due to ongoing tensions in the Middle East, while US allies resisted President Trump's request for assistance in securing shipping routes through the strategic Strait of Hormuz. Prior to the escalation of geopolitical tensions, markets had expected the European Central Bank to remain unchanged until 2026, with officials confident in the control of inflation and the appropriateness of policy settings. However, the outlook has shifted significantly, and traders now expect a rate hike as early as July. European Central Bank Governing Council member Peter Kazimir also stated that policymakers may consider raising interest rates sooner than previously expected.
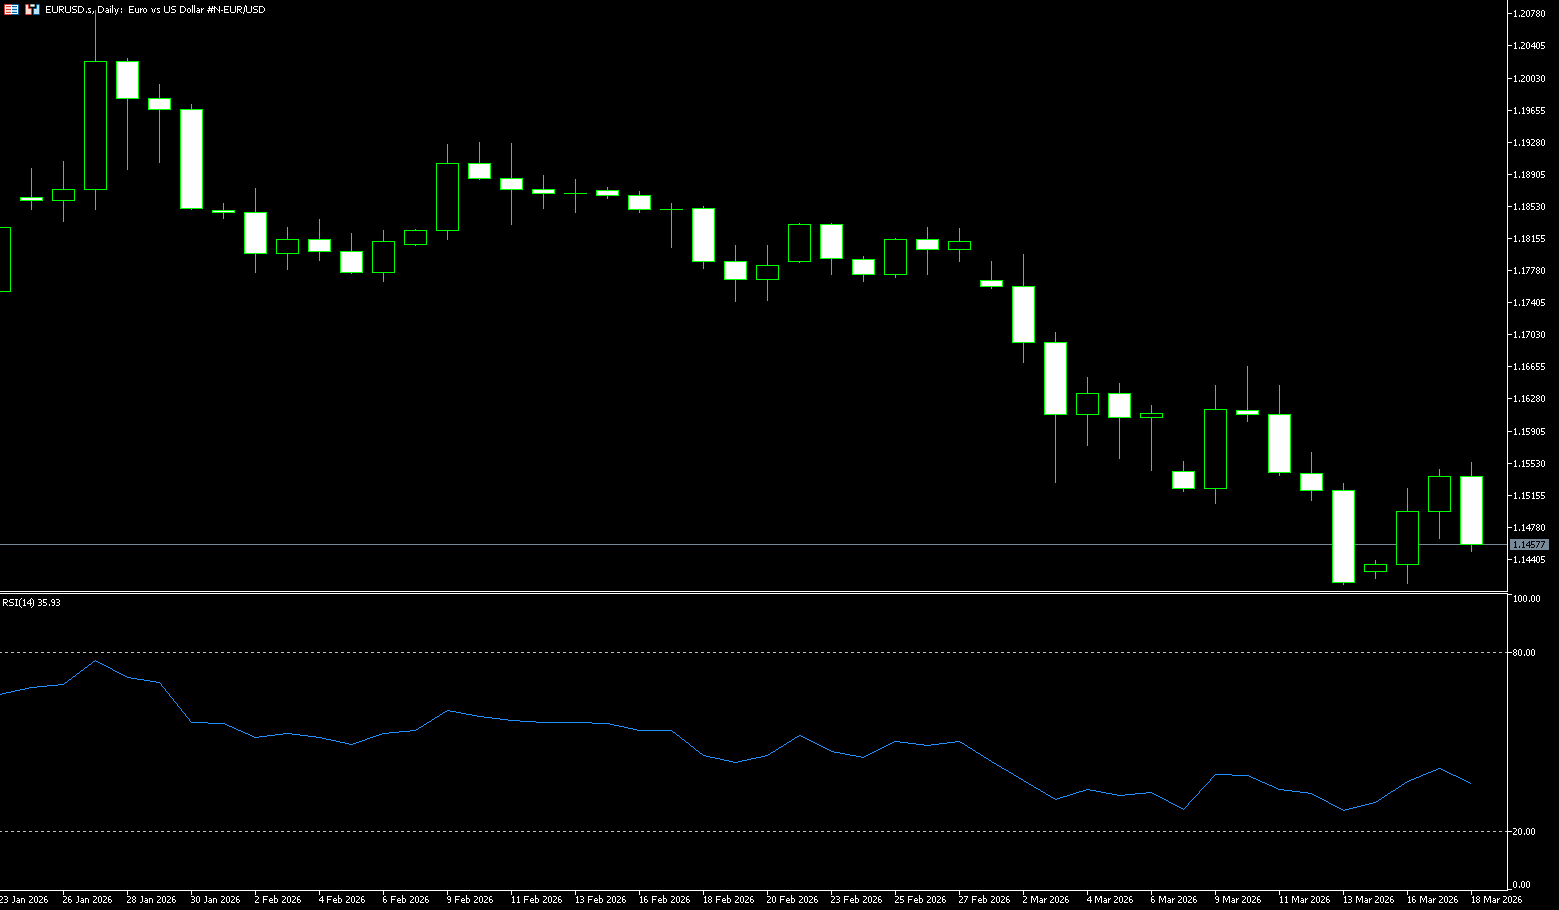
Currently, the euro/dollar is driven by developments in Washington, far more so than events in Frankfurt. The rally is likely to remain limited until the Fed's policy path becomes clearer or the Eurozone demonstrates a more convincing cyclical rebound. At this stage, the dollar remains firmly in control. On the daily chart, the euro/dollar is trading around 1.1480. The short-term bias is slightly bearish, with the pair having slipped from the 1.1800 area to the 1.1500 area, consistent with the Average Directional Index (ADX) above 36, indicating a strong downward trend. The Relative Strength Index (RSI) is near 39, below the 50 line, reinforcing persistent selling pressure rather than oversold fatigue. Immediate resistance appears at 1.1592 (14-day moving average), which intersects with the 1.1600 (psychological level) cluster, followed by stronger resistance at 1.1651 (20-day moving average). On the downside, initial support is at 1.1466 (Tuesday's low), with a deeper bottom at 1.1400 (the psychological level) if sellers maintain control.
Consider going long on the Euro today at 1.1460, with a stop-loss at 1.1450 and targets at 1.1500 and 1.1510.
Disclaimer: The information contained herein (1) is proprietary to BCR and/or its content providers; (2) may not be copied or distributed; (3) is not warranted to be accurate, complete or timely; and, (4) does not constitute advice or a recommendation by BCR or its content providers in respect of the investment in financial instruments. Neither BCR or its content providers are responsible for any damages or losses arising from any use of this information. Past performance is no guarantee of future results.
Lebih Liputan


Pendedahan Risiko:Instrumen derivatif diniagakan di luar bursa dengan margin, yang bermakna ia membawa tahap risiko yang tinggi dan terdapat kemungkinan anda boleh kehilangan seluruh pelaburan anda. Produk-produk ini tidak sesuai untuk semua pelabur. Pastikan anda memahami sepenuhnya risiko dan pertimbangkan dengan teliti keadaan kewangan dan pengalaman dagangan anda sebelum berdagang. Cari nasihat kewangan bebas jika perlu sebelum membuka akaun dengan BCR.
BCR Co Pty Ltd (No. Syarikat 1975046) ialah syarikat yang diperbadankan di bawah undang-undang British Virgin Islands, dengan pejabat berdaftar di Trident Chambers, Wickham’s Cay 1, Road Town, Tortola, British Virgin Islands, dan dilesenkan serta dikawal selia oleh Suruhanjaya Perkhidmatan Kewangan British Virgin Islands di bawah Lesen No. SIBA/L/19/1122.
Open Bridge Limited (No. Syarikat 16701394) ialah syarikat yang diperbadankan di bawah Akta Syarikat 2006 dan berdaftar di England dan Wales, dengan alamat berdaftar di Kemp House, 160 City Road, London, City Road, London, England, EC1V 2NX. Entiti ini bertindak semata-mata sebagai pemproses pembayaran dan tidak menyediakan sebarang perkhidmatan perdagangan atau pelaburan.

 English
 简体中文
简体中文
 繁體中文
繁體中文
 Bahasa
Melayu
Bahasa
Melayu
 Tiếng
Việt
Tiếng
Việt
 ไทย
ไทย
 日本語
日本語
 한국어
한국어
 ភាសាខ្មែរ
 español
