


0
US Dollar Index
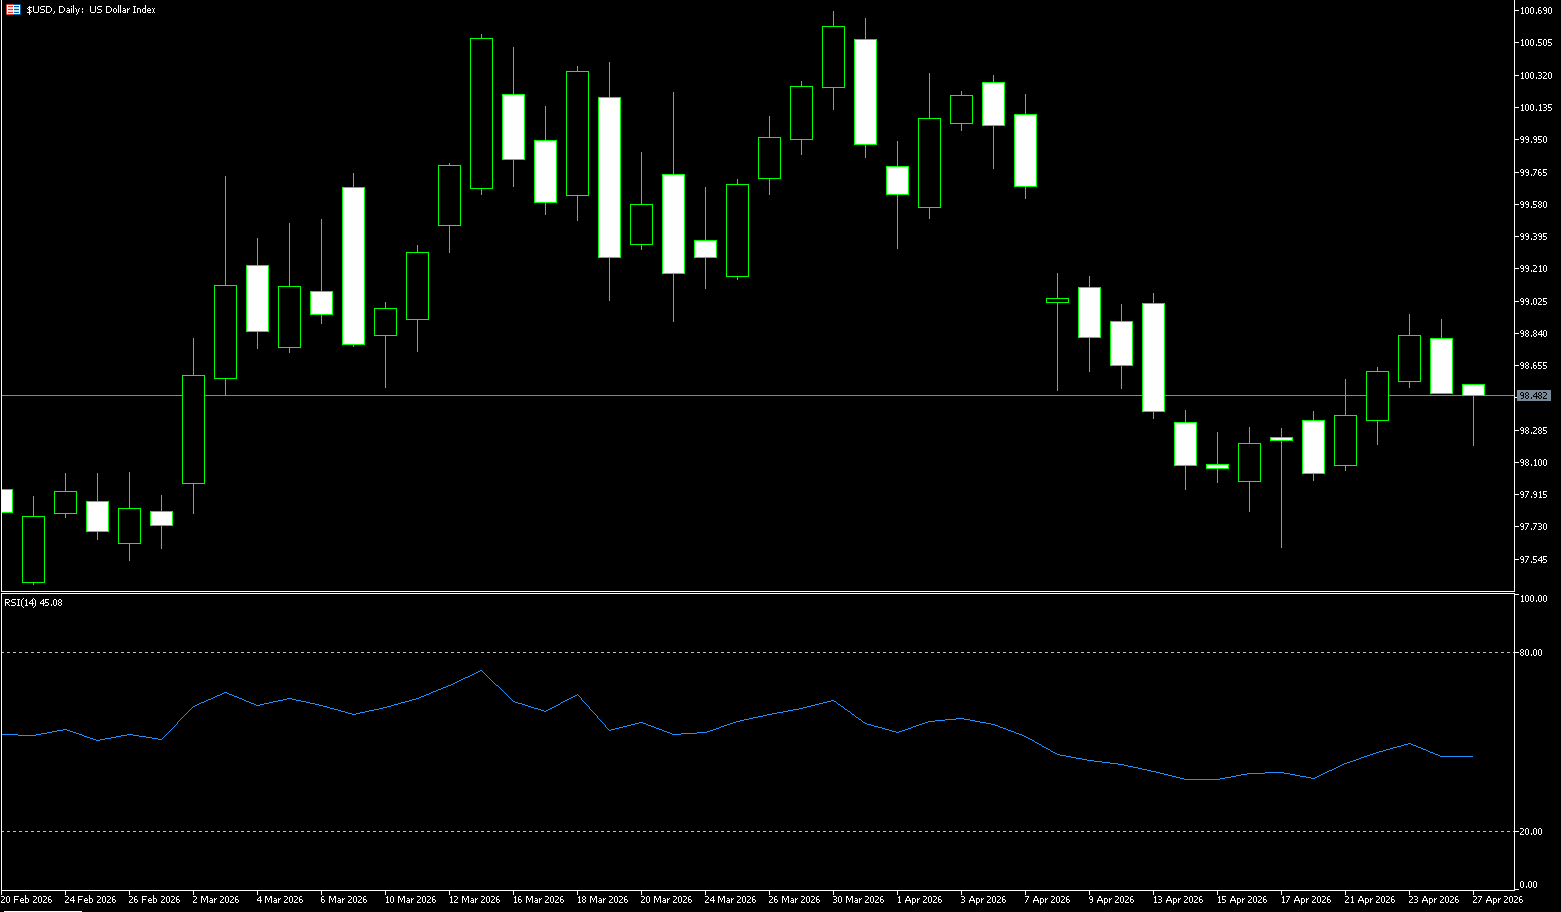
The US dollar index continued its decline at the beginning of the week, falling to around 98.50 on Friday. This was influenced by the US Department of Justice ending its investigation into Federal Reserve Chairman Powell, clearing the way for the more dovish Warsh to become Fed Chairman, and market optimism regarding the prospects of US-Iran peace talks. The euro rose 0.27% against the dollar to $1.1714, while the dollar fell 0.21% against the yen to 159.40 yen. Federal funds futures traders expect the probability of a rate cut before the end of the year to rise from 23% to 38%. The Iranian Foreign Minister arrived in Pakistan to discuss restarting peace talks, but details of the meeting remain unclear, and traders remain cautious. Market focus is shifting to the divergence in global central bank policies: the Federal Reserve is expected to keep interest rates unchanged this week; the European Central Bank is expected to hold rates steady on April 30, but more than half of economists predict a rate hike in June; the Bank of England's meeting on Thursday may maintain interest rates, but the market has already priced in a rate hike before the end of the year; and the Bank of Japan's meeting on Tuesday is expected to maintain interest rates but may signal a readiness to tighten policy.
From the 4-hour chart, after bottoming out at 97.63, the US dollar index has formed a bullish pattern with the 9-day moving average at 98.38 as its core support. The medium-term bullish momentum has not yet shown signs of weakening. Currently, the index is in a technical pullback phase after the rise. The RSI indicator has fallen to 44.85, without forming a bearish divergence after overbought conditions. This pullback is a normal correction within the bullish trend and has not disrupted the upward momentum. The key short-term level is the 200-day simple moving average at 98.54. If the pullback does not effectively break below this range, the bullish trend will continue, testing the previous high resistance levels of 98.94 (last Thursday's high) and 99.00 (the psychological level). If it effectively breaks below this level, we need to be wary of a weakening trend and the risk of a pullback to the 98.00 psychological level and the 97.63 (April 17th low).
Today, consider shorting the US Dollar Index at 98.58, with a stop-loss at 98.70 and targets at 98.20 and 98.10.
WTI Crude Oil
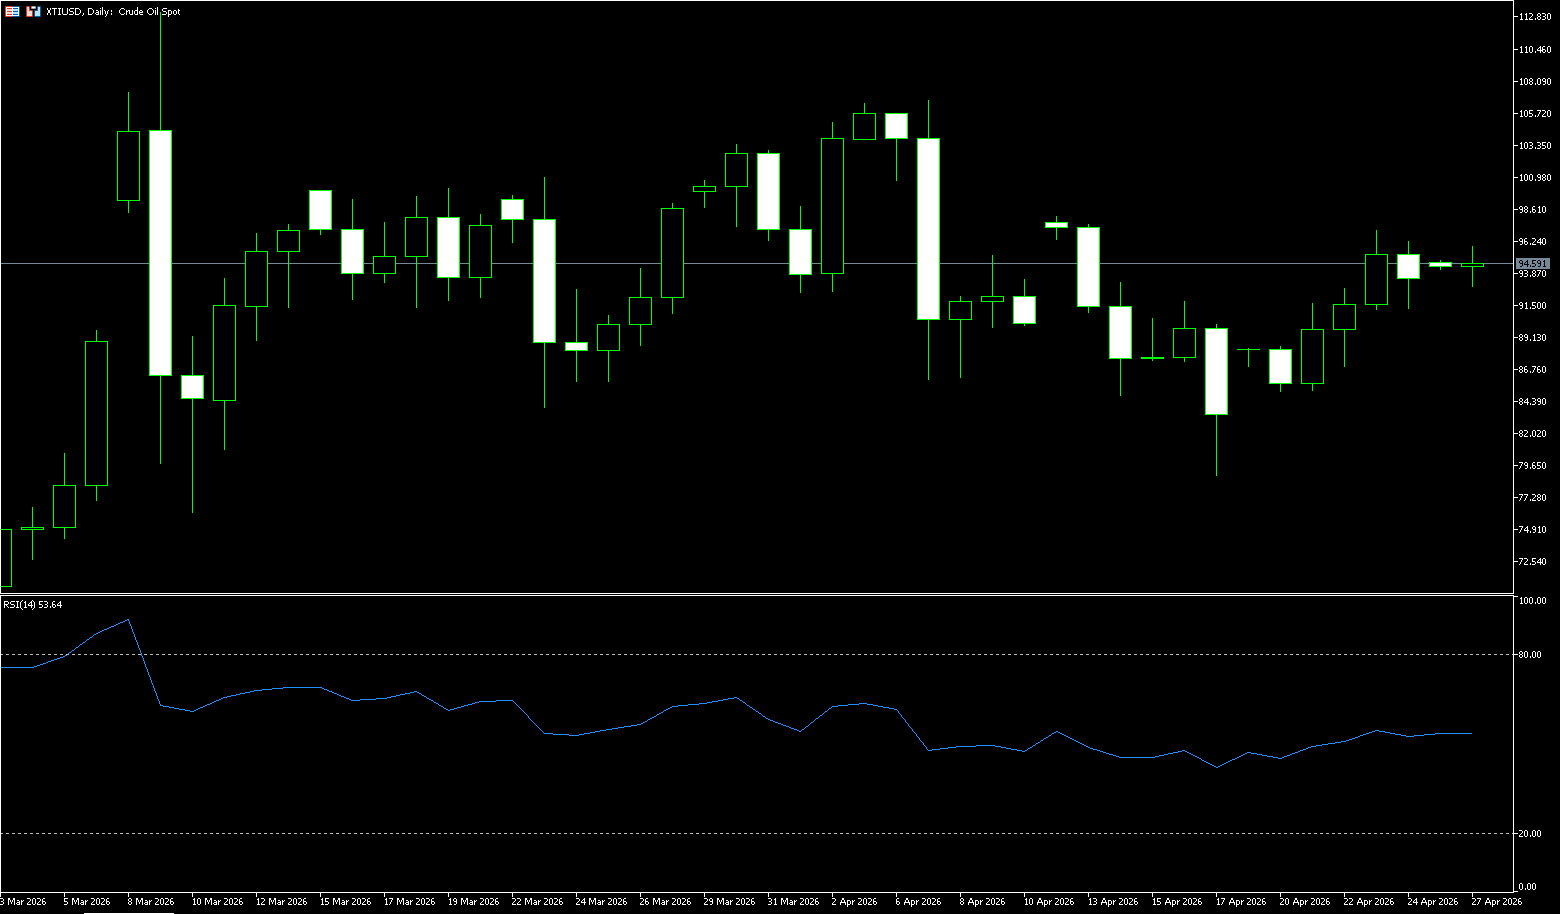
WTI crude oil rose above $94.50 per barrel on Monday, recovering losses from the previous trading session, as the Strait of Hormuz remained effectively closed amid stalled US-Iran peace talks. US President Donald Trump has instructed negotiators to suspend discussions, while Iranian President Masoud Pezeshkian reiterated that Tehran would not participate in “imposed negotiations under threats or blockades.” The war with Iran has now entered its ninth week, triggering what the International Energy Agency describes as the largest energy supply shock in history, while exacerbating inflationary pressures and impacting the global economic growth outlook. The ongoing US naval blockade continues to restrict Iranian crude oil exports and remains a key obstacle to any diplomatic progress. Analysts point out that even if the strait reopens, it could take months for oil flows to return to normal, leading to supply constraints and continued upward pressure on global energy markets.
The core driver of the current crude oil market remains supply-side uncertainty, particularly the risk premium resulting from restrictions on key shipping routes in the Middle East. Against this backdrop, oil prices generally still possess upward momentum. However, a stronger dollar and a high-interest-rate environment are constraining oil prices, creating a volatile market with both upward pressure and downward support. Future trends will depend on whether geopolitical tensions escalate further and changes in the policy paths of major central banks. Investors need to closely monitor the interplay between supply recovery progress and macroeconomic policy signals. From a technical perspective, on the daily chart, WTI crude oil maintains an upward-trending structure, with prices continuing to trade within a medium-term upward channel. Short-term support levels are located near the psychological level of $92.50 and $90.00, while key resistance levels are concentrated at $98.00 and $100.00. In terms of momentum, bullish forces still dominate, but the pace of the rise has slowed.
Today, consider going long on crude oil at 94.30, with a stop loss at 94.10 and targets at 97.00 and 96.00.
Spot Gold
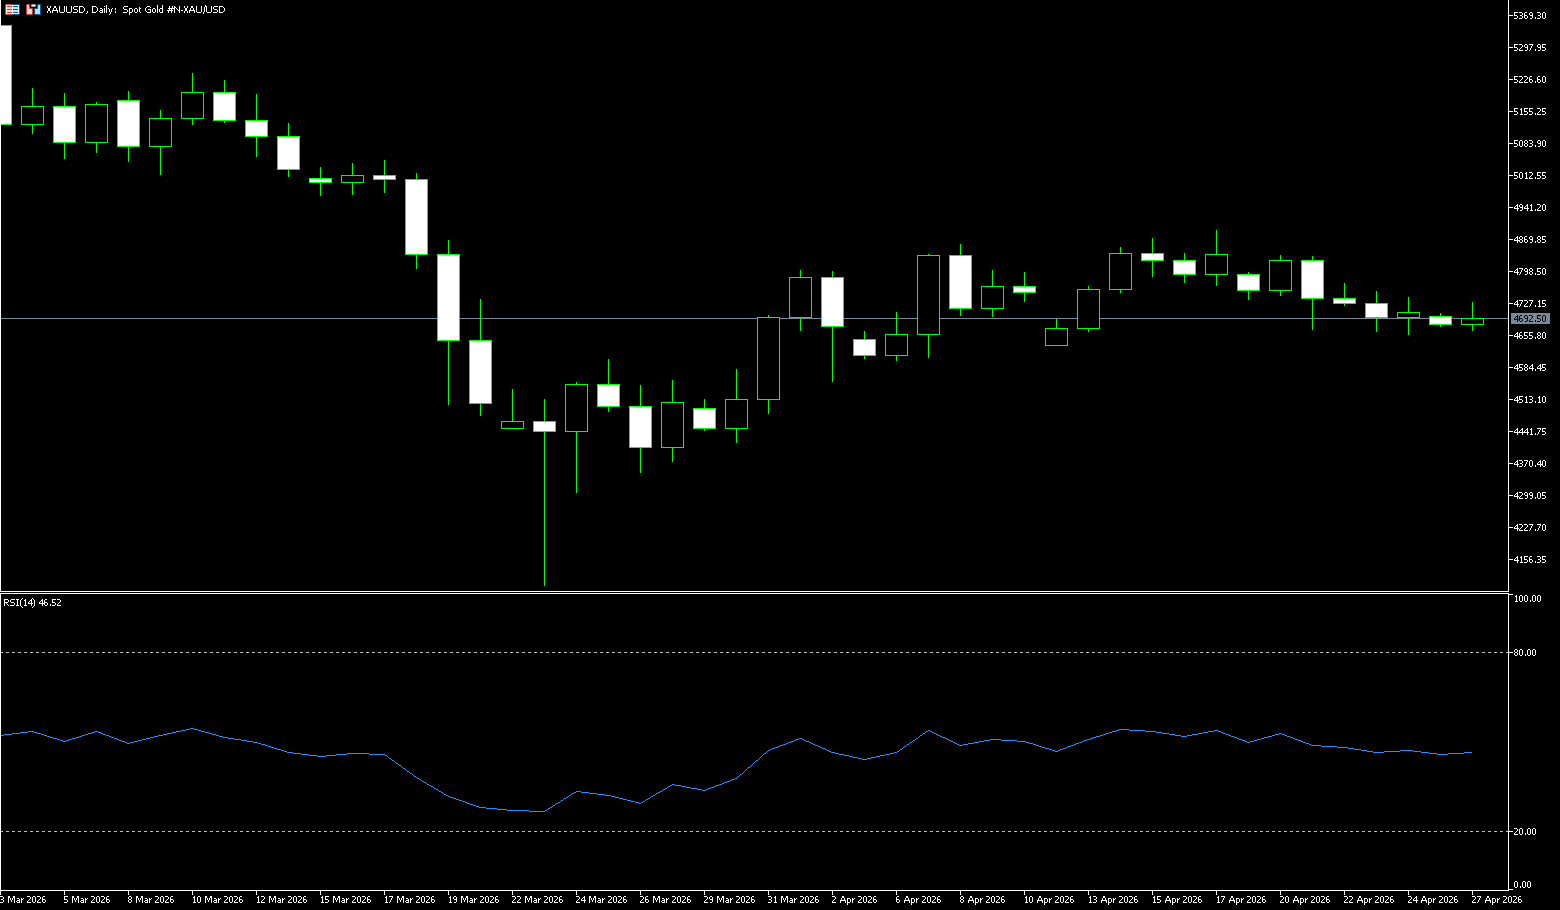
In early European trading, spot gold fell back below $4,700/oz, after testing the $4,680/oz level earlier. This was due to Iran's hardening stance compared to the first round of negotiations, stating it would not accept negotiations under pressure or a blockade of the Strait of Hormuz. The probability of the Federal Reserve keeping interest rates unchanged this week is 100%, and the probability of a rate hike this year has increased. Due to the stalemate in US-Iran peace talks, oil prices jumped more than 2% on Monday, inflation concerns rose again, and expectations for a Fed rate hike this year slightly increased. The dollar index rose slightly, putting pressure on gold prices. While the market continues to focus on further news from the Middle East situation, more attention is turning to this week's Fed interest rate decision. In addition, this week will also see interest rate decisions from the European Central Bank, the Bank of England, and the Bank of Japan. Normally, escalating war risks, soaring oil prices, and rising safe-haven demand are all excellent fuel for gold price increases. However, this time the scenario is quite different. The core issue is that persistently high oil prices are fueling a specter more terrifying to the market than war—stubborn inflation.
Gold prices remain bearish in the short term, trading below the 9-day simple moving average ($4753), and are currently seeking a further break below the bottom of the ascending channel at $4,680.50. The break from channel support indicates weakening upward momentum. Meanwhile, the Relative Strength Index (RSI) is at 44.50, near oversold territory, while the Moving Average Convergence Divergence (MACD) remains negative, around -4.92 below the zero line. This reinforces the continued downward pressure rather than indicating an impending reversal. Therefore, further weakness would risk a tentative decline in gold prices. Resistance lies near the psychological level of $4,720, with stronger resistance at the 9-day simple moving average at $4,753, and even higher at the psychological level of around $4,800. Only a break above these resistances could begin to alleviate the current bearish sentiment. On the downside, watch for $4,632.70 (April 13 low) and the $4,600 level (psychological key level).
Consider going long on spot gold today at $4,683, with a stop loss at $4,678 and targets of $4,730 and $4,740.
AUD/USD
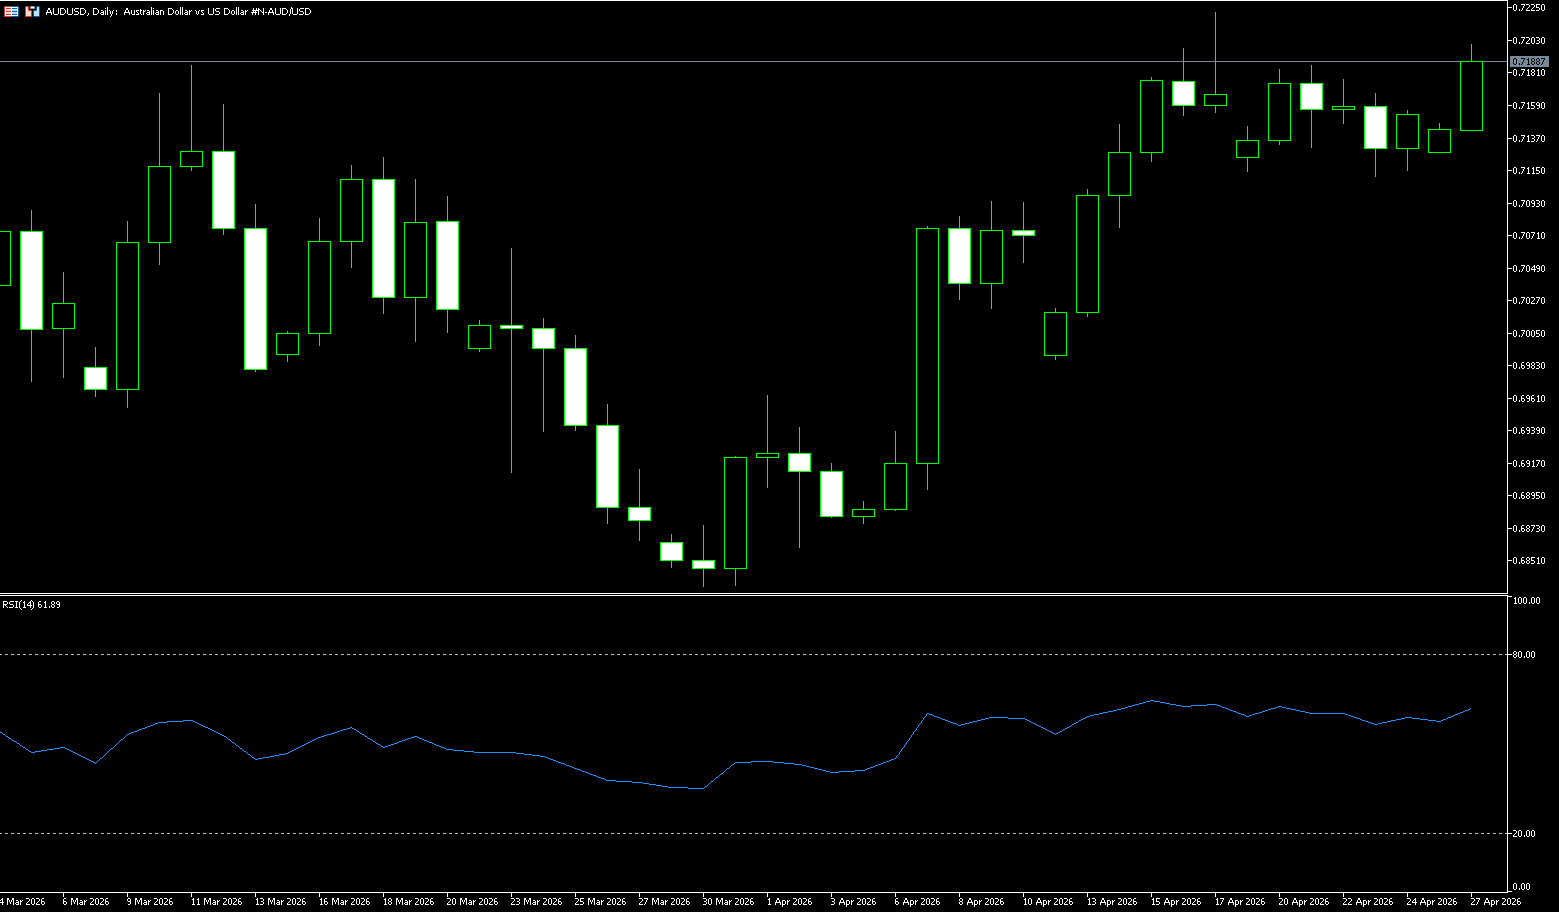
The Australian dollar rose above $0.7180, recovering from a loss of about 0.3% last week and holding near four-year highs, as soaring energy prices strengthened expectations of an interest rate hike ahead of upcoming inflation data. Despite a largely sustained ceasefire since early April, efforts to resume peace talks between the US and Iran have stalled, and energy flows through the Strait of Hormuz remain restricted. The resulting energy supply shock continues to exacerbate inflation risks, reinforcing market expectations that the central bank will maintain higher interest rates for longer or raise them further. In Australia, investors are awaiting the March Consumer Price Index report on Wednesday, which is expected to show overall inflation rising 4.7% year-on-year, well above the Reserve Bank of Australia's 2-3% target. Any unexpected upside surprise could solidify market bets on a 25 basis point rate hike at the central bank's May 5 meeting. The market currently estimates an 80% probability of a third rate hike this year to 4.35%.
The AUD/USD pair is influenced by both macroeconomic factors and technical structures. Rising oil prices have strengthened inflation expectations, supporting a stronger US dollar and thus suppressing the Australian dollar. However, from a technical perspective, the exchange rate remains above key support and has not yet formed a clear downtrend. Future movements will depend on inflation data and central bank policy signals; a change in fundamentals could trigger a directional breakout. Technically, on the daily chart, the AUD/USD pair remains above key moving averages after a pullback, and the overall trend has not completely weakened. The current price is trading above the 20-day simple moving average at 0.7068, indicating that the short-term bullish structure still has support. Resistance lies at the psychological level of 0.72000 and the high of 0.7222 from April 17. A sustained break above these levels would reopen a more positive short-term outlook. The first support level is at the psychological level of 0.7300. The 20-day moving average (0.7068) and the psychological level of 0.7100 form a more important medium-term demand zone, which will act as key support if sellers regain control.
Consider going long on the Australian dollar at 0.7172 today, with a stop loss at 0.7160 and targets at 0.7220 and 0.7240.
GBP/USD
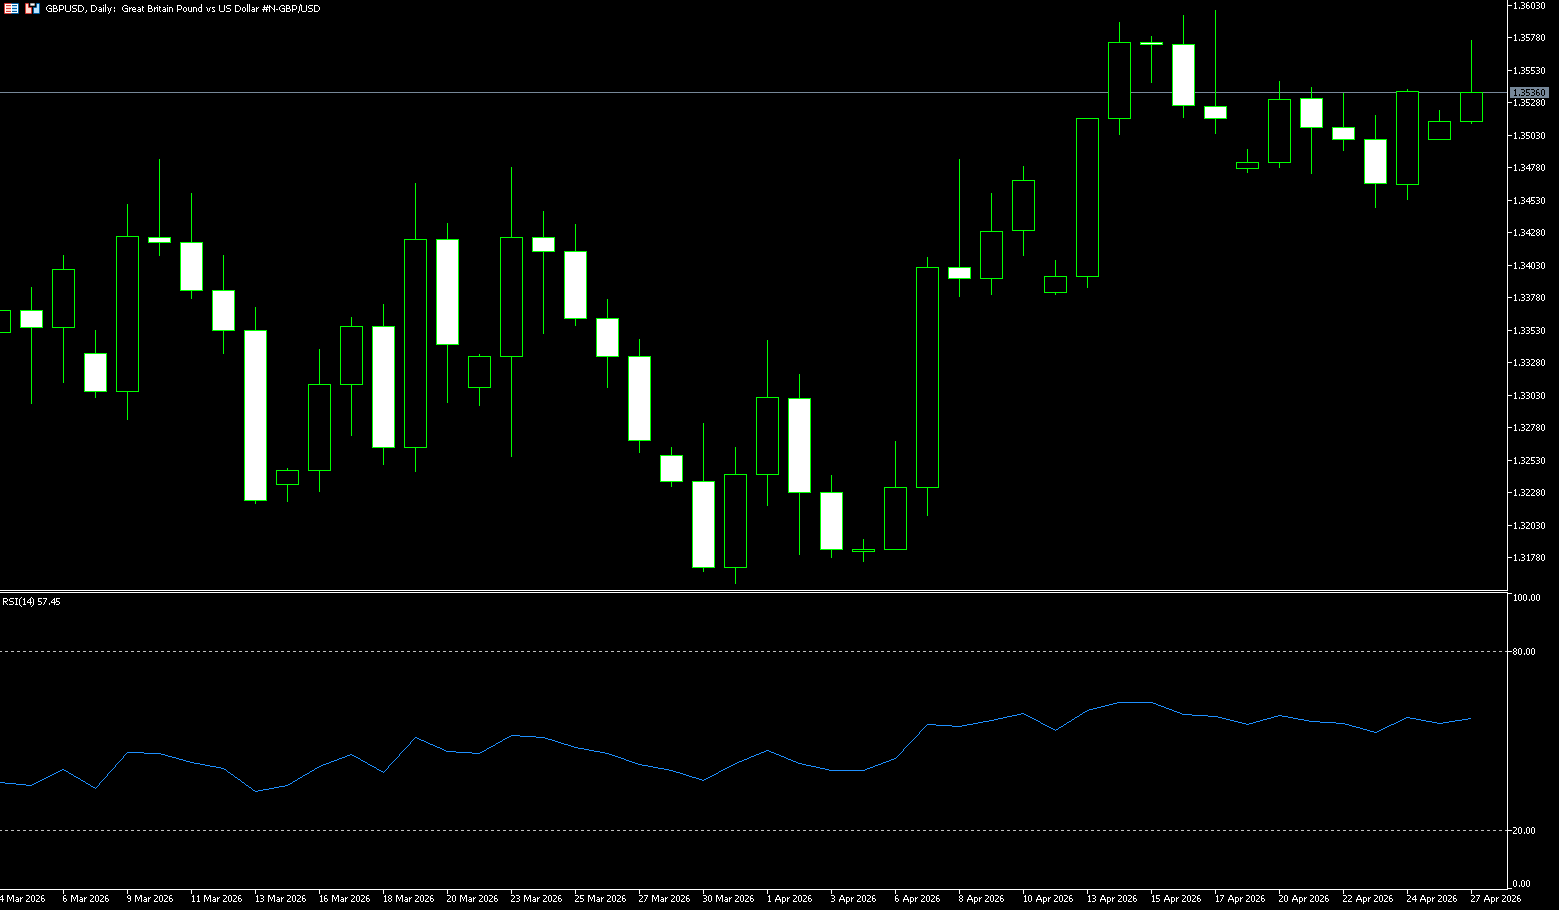
On Monday during the Asian session, the pound continued its weakness against the dollar, recovering some losses during the session but remaining around 1.3535. As a risk-sensitive currency, the pound is under significant pressure amid rising market risk aversion, while the dollar is supported by capital inflows, pushing the exchange rate lower overall. Meanwhile, the conflict between Israel and Lebanon has escalated again. Although a short-term ceasefire was previously agreed upon, its implementation has fallen short of expectations, and regional tensions continue to rise. The increased geopolitical risks have prompted global funds to shift towards safe-haven assets, thus supporting the dollar. The US dollar strengthened against major currencies driven by safe-haven demand, becoming a significant factor suppressing the pound against the dollar. Furthermore, the market was also affected by unforeseen security events, further exacerbating short-term uncertainty. Deteriorating risk sentiment led investors to reduce their allocation to high-risk assets, thus weakening the pound's performance. Overall, the core driver of the current market has shifted from economic data to changes in geopolitical and risk sentiment.
Currently, the pound/dollar exchange rate is mainly influenced by safe-haven sentiment driven by geopolitical risks, with the strengthening dollar being the dominant factor, while the pound, as a risk-sensitive currency, continues to face pressure. In the short term, if the situation in the Middle East does not show significant easing, the exchange rate may continue to maintain a weak and volatile pattern. The medium-term trend will depend on changes in global risk sentiment and the policy paths of major central banks, especially whether the dollar continues to receive support from safe-haven flows. From a technical perspective, on the daily chart, the pound/dollar exchange rate has entered a correction phase after falling from its previous highs and is currently trading below short-term moving averages, indicating weakening upward momentum. Key support is around 1.3480; a break below this level could lead to a further test of the 1.3400 psychological level. Momentum indicators suggest bears are in control, but the price hasn't yet entered extreme oversold territory. Resistance is concentrated around the psychological level of 1.3600. A break below this level would likely test the 1.3672 (February 12 high) and 1.3675 (Bollinger Band upper trendline) areas in the short term.
Consider going long on GBP at 1.3523 today, with a stop-loss at 1.3510 and targets at 1.3570 and 1.3580.
USD/JPY
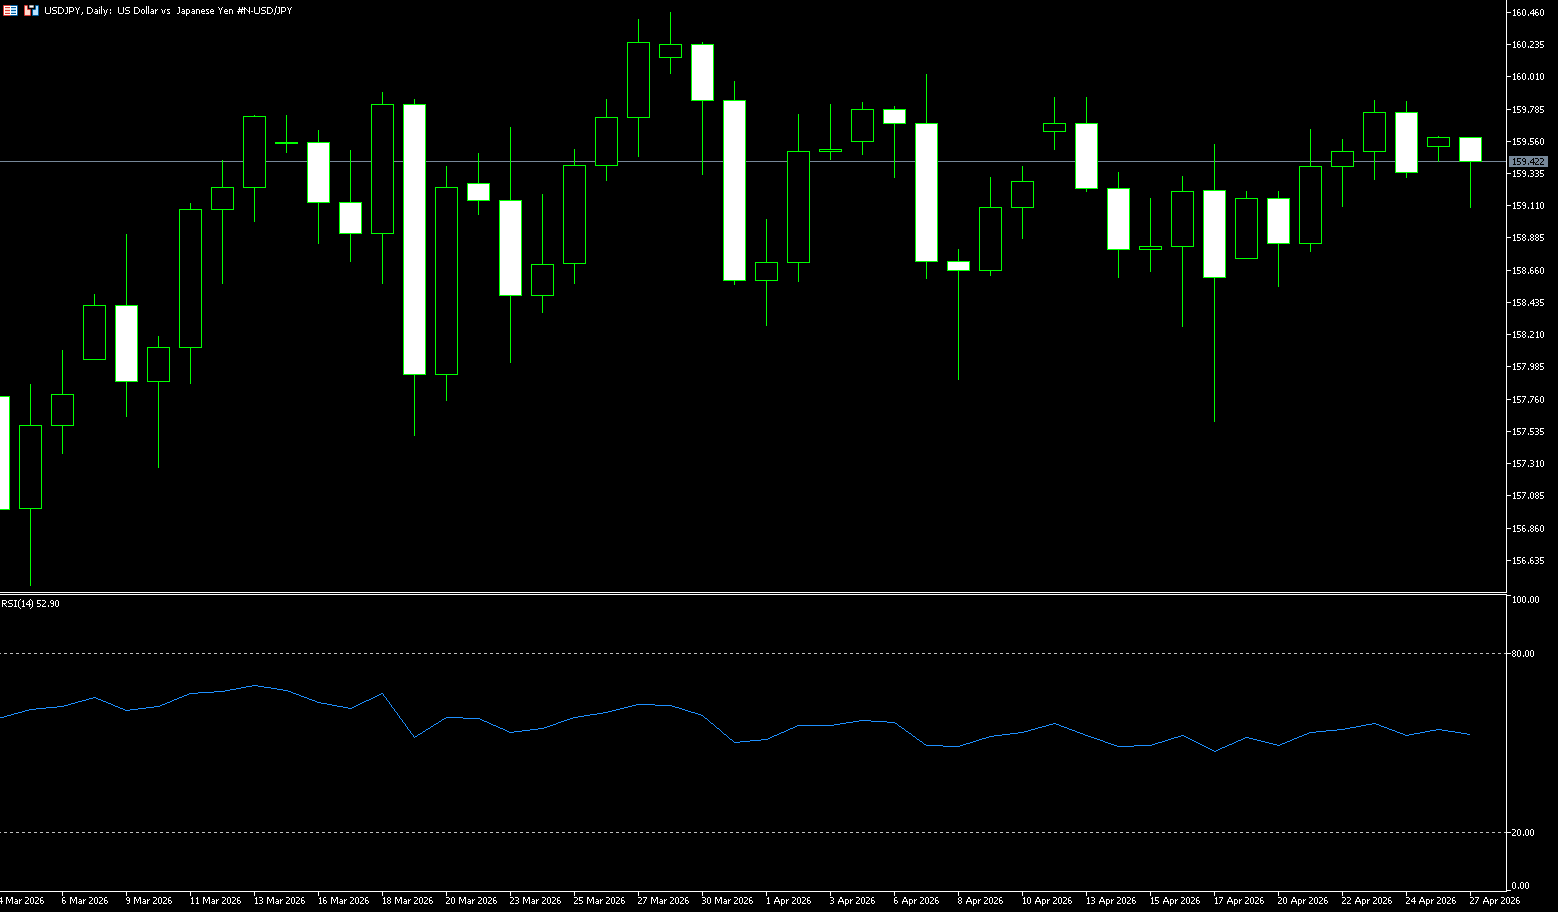
The USD/JPY pair traded in a narrow range around 159.30 on Monday. With the Bank of Japan and the Federal Reserve leading up to their key interest rate decisions, investors were largely on the sidelines, limiting overall volatility. The Bank of Japan is expected to keep interest rates unchanged at 0.75% at its meeting this week, but the market cannot rule out a hawkish policy stance. Japan is currently facing inflationary pressures from rising energy prices, while increased uncertainty in the Middle East is forcing policymakers to maintain a cautious balance between economic growth and inflation. At the same time, Japan is highly concerned about the continued depreciation of the yen. Market expectations for potential intervention have clearly intensified. This factor has limited the upside potential of the USD/JPY pair, putting downward pressure on the exchange rate at its current high levels. From the dollar's perspective, the Federal Reserve is expected to maintain its interest rate range at 3.50% to 3.75% at this meeting, marking the third consecutive time it has held rates steady. If the Fed releases a hawkish signal, it could further solidify the dollar's strength, thereby pushing the exchange rate higher.
From a market logic perspective, the current USD/JPY exchange rate movement is mainly influenced by the interplay between "high interest rates supporting the dollar" and "intervention expectations supporting the yen." With these two factors intertwined, the exchange rate lacks a clear trend in the short term, exhibiting a high-level consolidation pattern. From a technical perspective, on the daily chart, the USD/JPY pair is in a high-level consolidation phase within a long-term upward trend, with the price repeatedly fluctuating around the 160 level, indicating a slowdown in upward momentum. Short-term support is around 158.80; a break below this level could lead to a further decline to the 157.50 area. Resistance is concentrated in the 160.00-161.29 range (the June 2024 high), a psychological level combined with previous high resistance. Momentum indicators suggest the bullish trend remains intact, but its strength has weakened.
Consider shorting the US dollar at 159.60 today, with a stop-loss at 159.80 and targets at 158.60 and 158.50.
EUR/USD
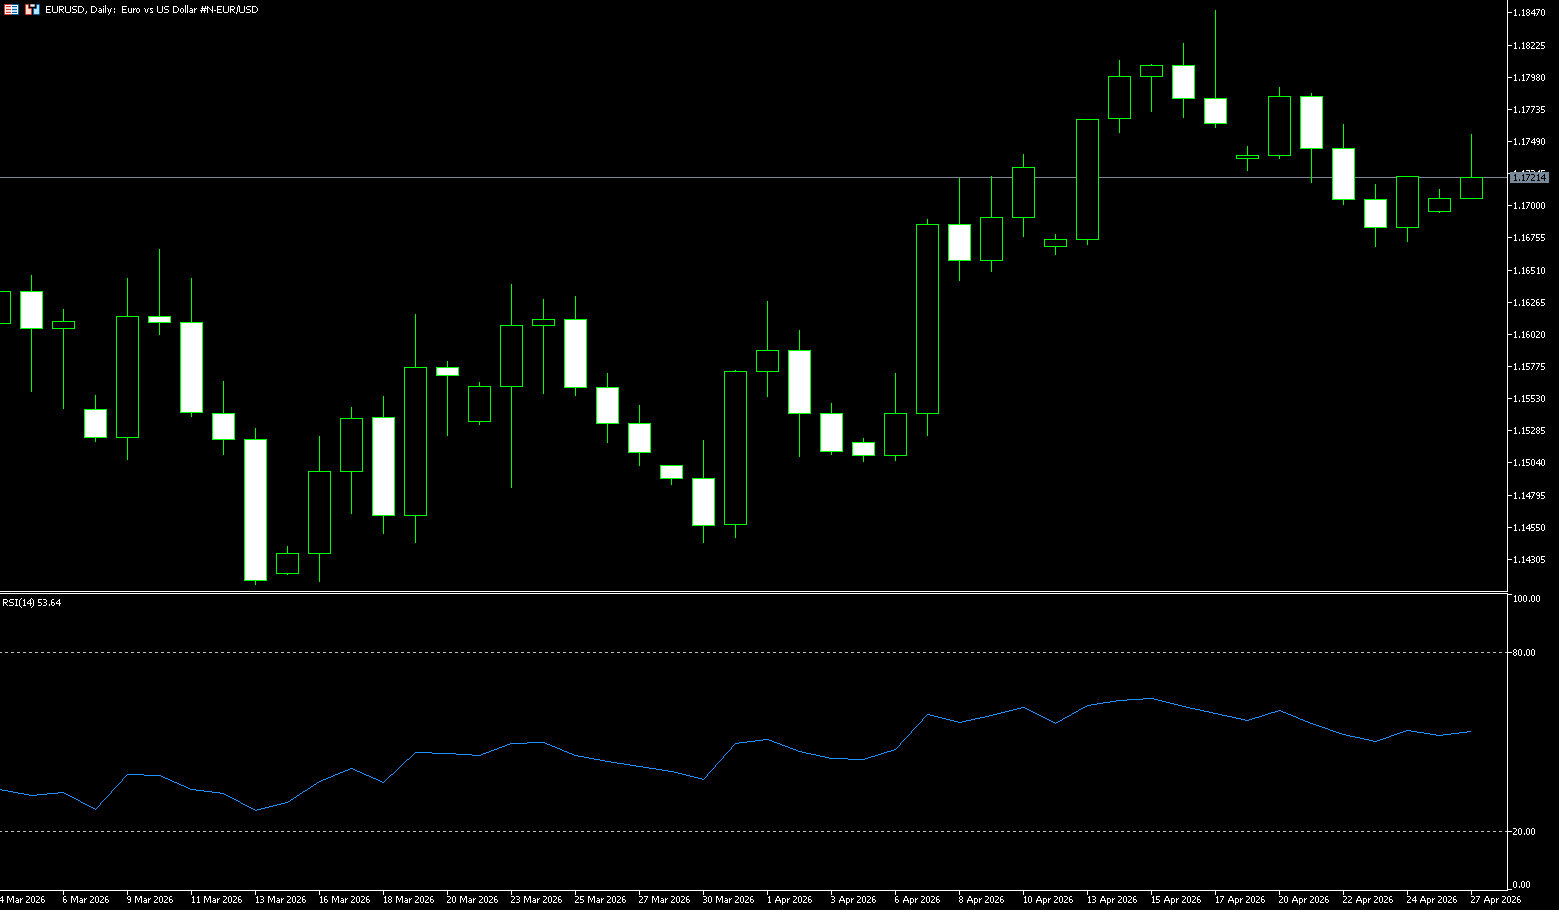
The euro has climbed back above $1.1720, attempting a rebound from a two-week low, as renewed optimism surrounding potential progress in US-Iran peace talks has rekindled. According to Al Jazeera, Iranian Foreign Minister Abbas Araqchi is expected to arrive in Islamabad tonight, and Pakistani government sources indicated a "high probability of a breakthrough" in the negotiations. Investors are also focused on the upcoming European Central Bank policy meeting in April, where policymakers are widely expected to keep interest rates unchanged. The European Central Bank (ECB) is taking a wait-and-see approach to assess the impact of recent macroeconomic data and geopolitical developments, particularly the influence of the Middle East conflict on its earlier forecasts. Despite this cautious stance, the money market has fully priced in two 25-basis-point rate hikes in 2026, with the possibility of a third hike by the end of the year.
From a technical perspective, the daily chart shows the euro/dollar pair in a short-term bullish trend, as the exchange rate has clearly stabilized above key moving averages. The 20-day simple moving average at 1.1684 provides the first layer of dynamic support, while the 100-day (1.1709) and 200-day (1.1677) simple moving averages are converging at lower levels, suggesting a solid upward trend in fundamentals. Momentum indicators remain constructive, rising within positive territory, while the 14-day Relative Strength Index (RSI) hovers around 54.80, indicating that buying pressure persists even as the exchange rate climbs to new highs. Immediate resistance is located at 1.1762 (the high of April 22). After the breakout, the next resistance level is at 1.1830, which is the high point of the exchange rate at the end of February. Initial support is seen at the 20-day simple moving average at 1.1684 and the 200-day simple moving average (1.1677).
Consider going long on the Euro today at 1.1710, with a stop loss at 1.1700 and targets at 1.1760 and 1.1770.
Disclaimer: The information contained herein (1) is proprietary to BCR and/or its content providers; (2) may not be copied or distributed; (3) is not warranted to be accurate, complete or timely; and, (4) does not constitute advice or a recommendation by BCR or its content providers in respect of the investment in financial instruments. Neither BCR or its content providers are responsible for any damages or losses arising from any use of this information. Past performance is no guarantee of future results.
Lebih Liputan


Pendedahan Risiko:Instrumen derivatif diniagakan di luar bursa dengan margin, yang bermakna ia membawa tahap risiko yang tinggi dan terdapat kemungkinan anda boleh kehilangan seluruh pelaburan anda. Produk-produk ini tidak sesuai untuk semua pelabur. Pastikan anda memahami sepenuhnya risiko dan pertimbangkan dengan teliti keadaan kewangan dan pengalaman dagangan anda sebelum berdagang. Cari nasihat kewangan bebas jika perlu sebelum membuka akaun dengan BCR.
BCR Co Pty Ltd (No. Syarikat 1975046) ialah syarikat yang diperbadankan di bawah undang-undang British Virgin Islands, dengan pejabat berdaftar di Trident Chambers, Wickham’s Cay 1, Road Town, Tortola, British Virgin Islands, dan dilesenkan serta dikawal selia oleh Suruhanjaya Perkhidmatan Kewangan British Virgin Islands di bawah Lesen No. SIBA/L/19/1122.
Open Bridge Limited (No. Syarikat 16701394) ialah syarikat yang diperbadankan di bawah Akta Syarikat 2006 dan berdaftar di England dan Wales, dengan alamat berdaftar di Kemp House, 160 City Road, London, City Road, London, England, EC1V 2NX. Entiti ini bertindak semata-mata sebagai pemproses pembayaran dan tidak menyediakan sebarang perkhidmatan perdagangan atau pelaburan.

 English
 简体中文
简体中文
 繁體中文
繁體中文
 Bahasa
Melayu
Bahasa
Melayu
 Tiếng
Việt
Tiếng
Việt
 ไทย
ไทย
 日本語
日本語
 한국어
한국어
 ភាសាខ្មែរ
 español

