


0
Currency & Community Analysis:
US Dollar Index
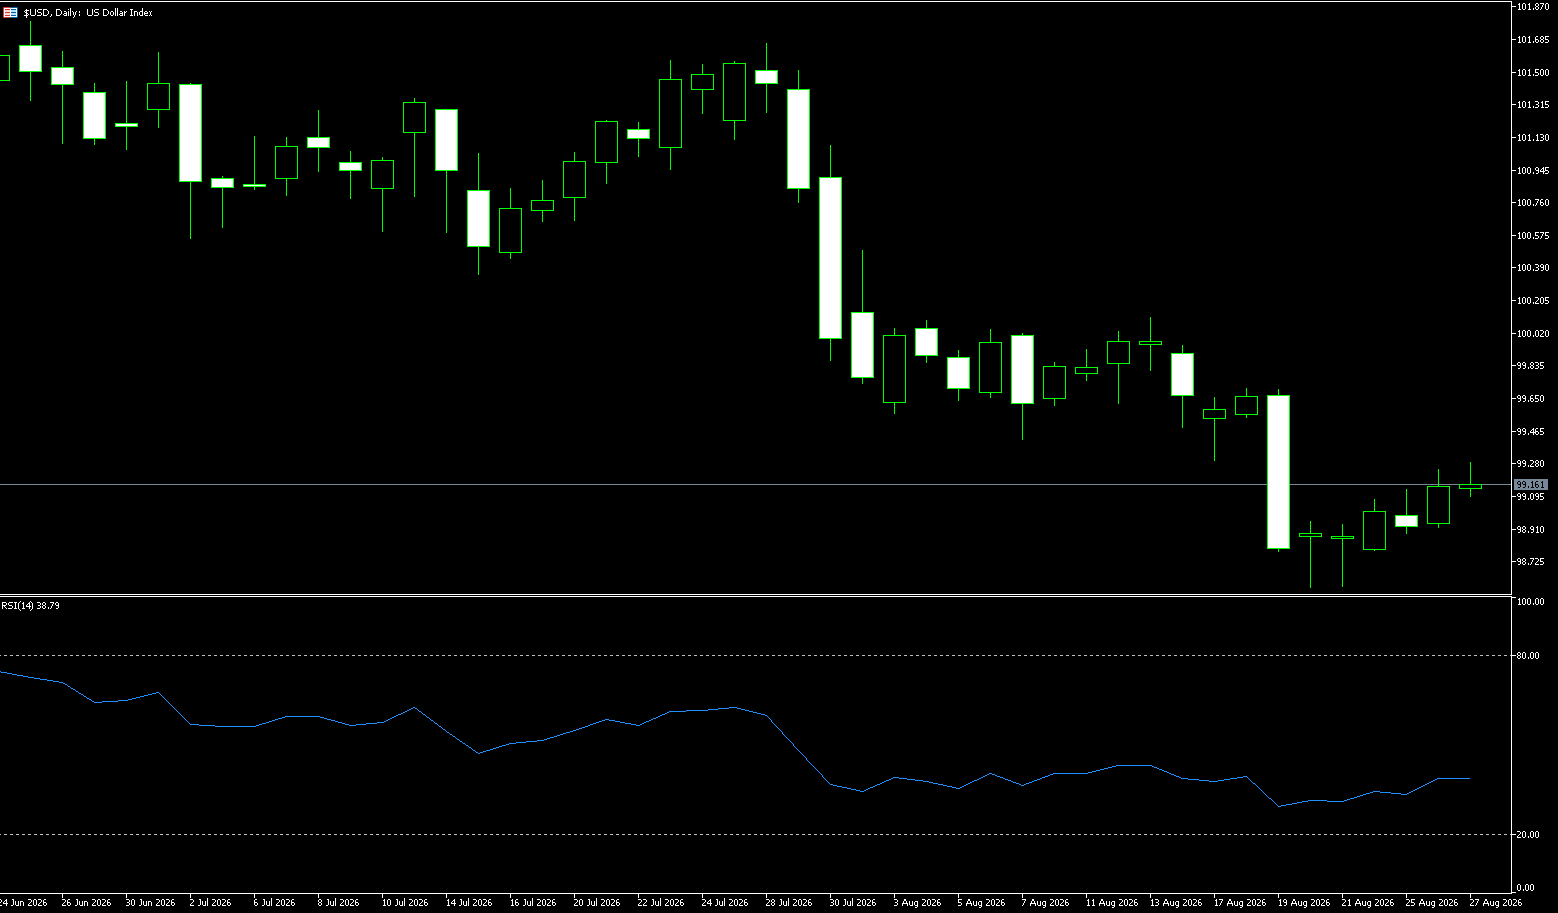
The US dollar index rose above 99 in Thursday's trading, following gains in the previous session, supported by stronger-than-expected US economic data, which strengthened market expectations for a Federal Reserve rate hike before the end of the year. The personal consumption expenditures (PCE) price index rose 0.2% month-over-month in July, exceeding the expected 0.1% and reversing a 0.1% decline in June, while the annual inflation rate rose to 3.7%, higher than the expected 3.6%. Investors are now awaiting further clues from Federal Reserve Chairman Kevin Warsh's speech at Friday's Jackson Hole symposium, although he is unlikely to explicitly indicate the Fed's policy decision in September. Meanwhile, oil prices fell further on signs of progress in Middle East diplomacy, helping to ease recent inflation concerns. Investors also continue to weigh the impact of the US Treasury's expanded debt repurchase program and broader US fiscal risks.
The current dollar market faces a typical two-variable game: growth data determines the necessity of policy adjustments, while inflation data determines the scope for policy adjustments. Significant changes in either could alter the pricing relationship within the yield curve. Observing the daily chart of the US Dollar Index, after a rapid decline from above 101, the index is currently trading around 99. The Bollinger Bands are around 99.50 (midline), 100.34 (upper band), and 98.66 (lower band). The index is below the Bollinger Bands and close to the lower half of the channel. MACD data shows the DIFF is around -0.4366, DEA around -0.3759, and the histogram around -0.1213, both lines below the zero line. The recent candlestick bodies have narrowed significantly, indicating that after the rapid repricing in the previous period, daily volatility is entering a compression phase. Support levels to watch are 98.77 (this week's low) and 98.56 (last week's low); resistance is around 99.25, followed by the Bollinger Bands around 99.50.
Today, consider shorting the US Dollar Index at 99.20, with a stop-loss at 99.30 and targets at 98.90 and 98.80.
WTI Crude Oil
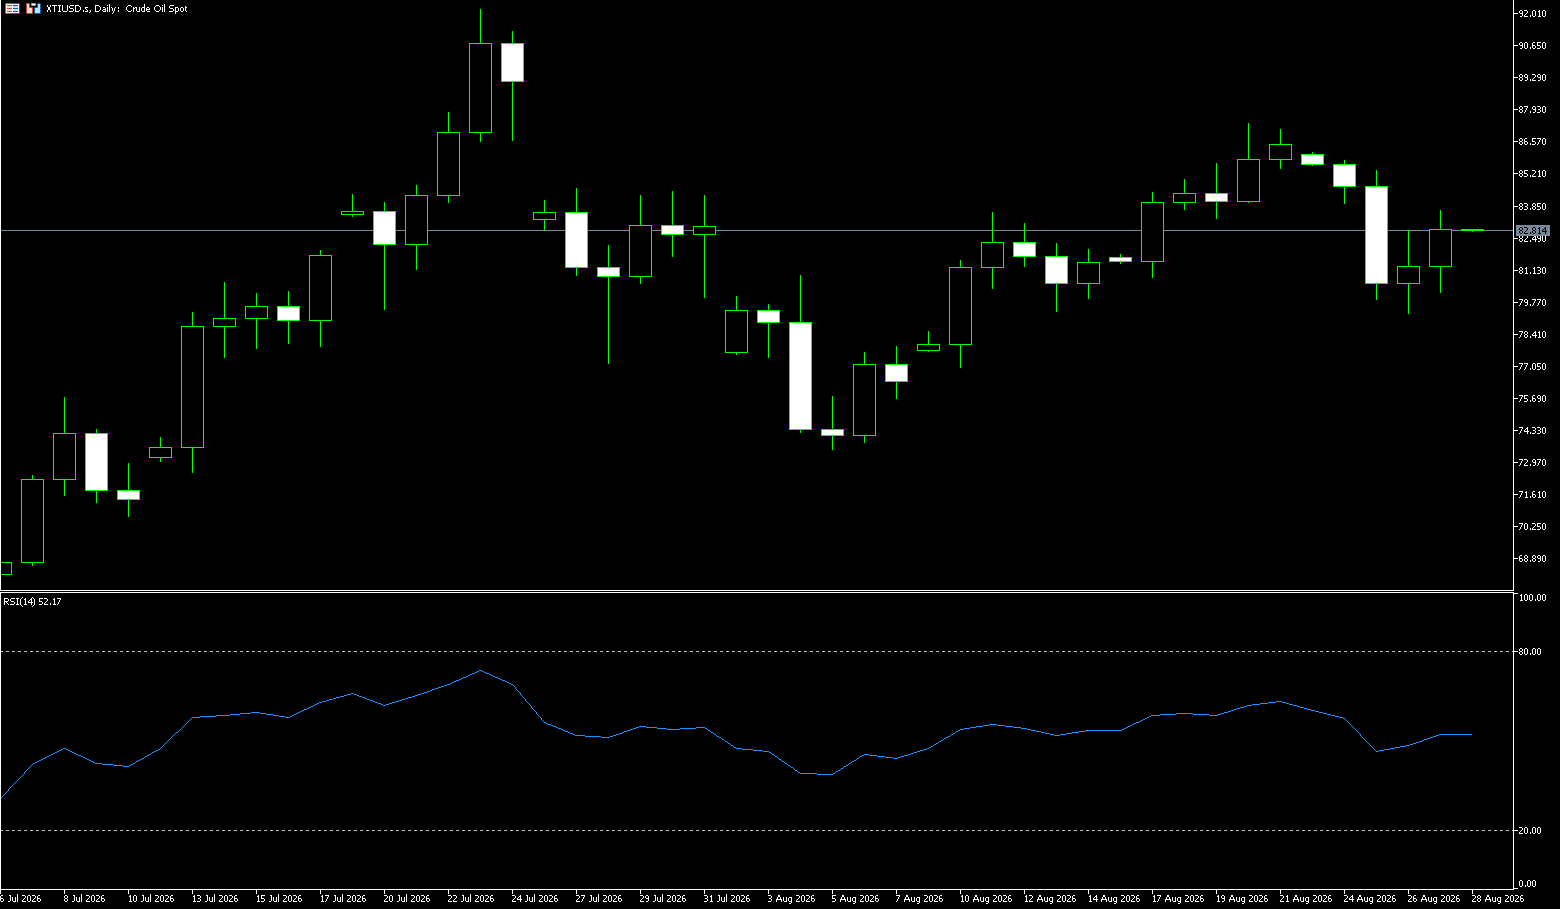
On Thursday, crude oil prices traded around $83 a barrel, after three consecutive days of declines, as the market weighed improved supply prospects in the Strait of Hormuz against growing disruptions to Russian energy exports. The Iranian military stated it had reached a revenue-sharing agreement with Oman regarding this strategic waterway, raising hopes for a possible easing of shipping disruptions. However, Tehran emphasized that the arrangement did not guarantee an immediate reopening of the strait, maintaining uncertainty. Saudi Arabia also appears to be increasing oil loadings from its Persian Gulf terminals in search of alternative routes in the Red Sea exposed to Houthi attacks. Meanwhile, concerns are growing that the war between Russia and Ukraine could escalate further. Ukraine's continued attacks on Russian refineries and ports are damaging the country's energy infrastructure and could limit its ability to export crude oil and refined products.
Oil prices are currently trading within a symmetrical triangle pattern. Recently, oil prices encountered resistance near $87.38 (the high of August 20th), a level that coincides with a downtrend line and the 50% Fibonacci retracement level from the $55 low to the $120 high. Subsequently, oil prices declined, breaking below the 100-day exponential moving average at $85.22, and are currently testing the 50-day exponential moving average at $78.41. The Relative Strength Index (RSI) is below 50, indicating that short-term trading is dominated by sellers. If oil prices decisively break below the $80.00 level, the bearish outlook will be further confirmed, with the price likely targeting the 50-day exponential moving average at $78.41. However, if the 50-period exponential moving average support holds, the bulls will first try to recover the psychological level around $83.00, and then challenge the $85.35 level (Tuesday's high) again.
Today, consider going long on crude oil at $82.80, with a stop loss at $82.60 and targets of $84.00 and $85.00.
Spot Gold
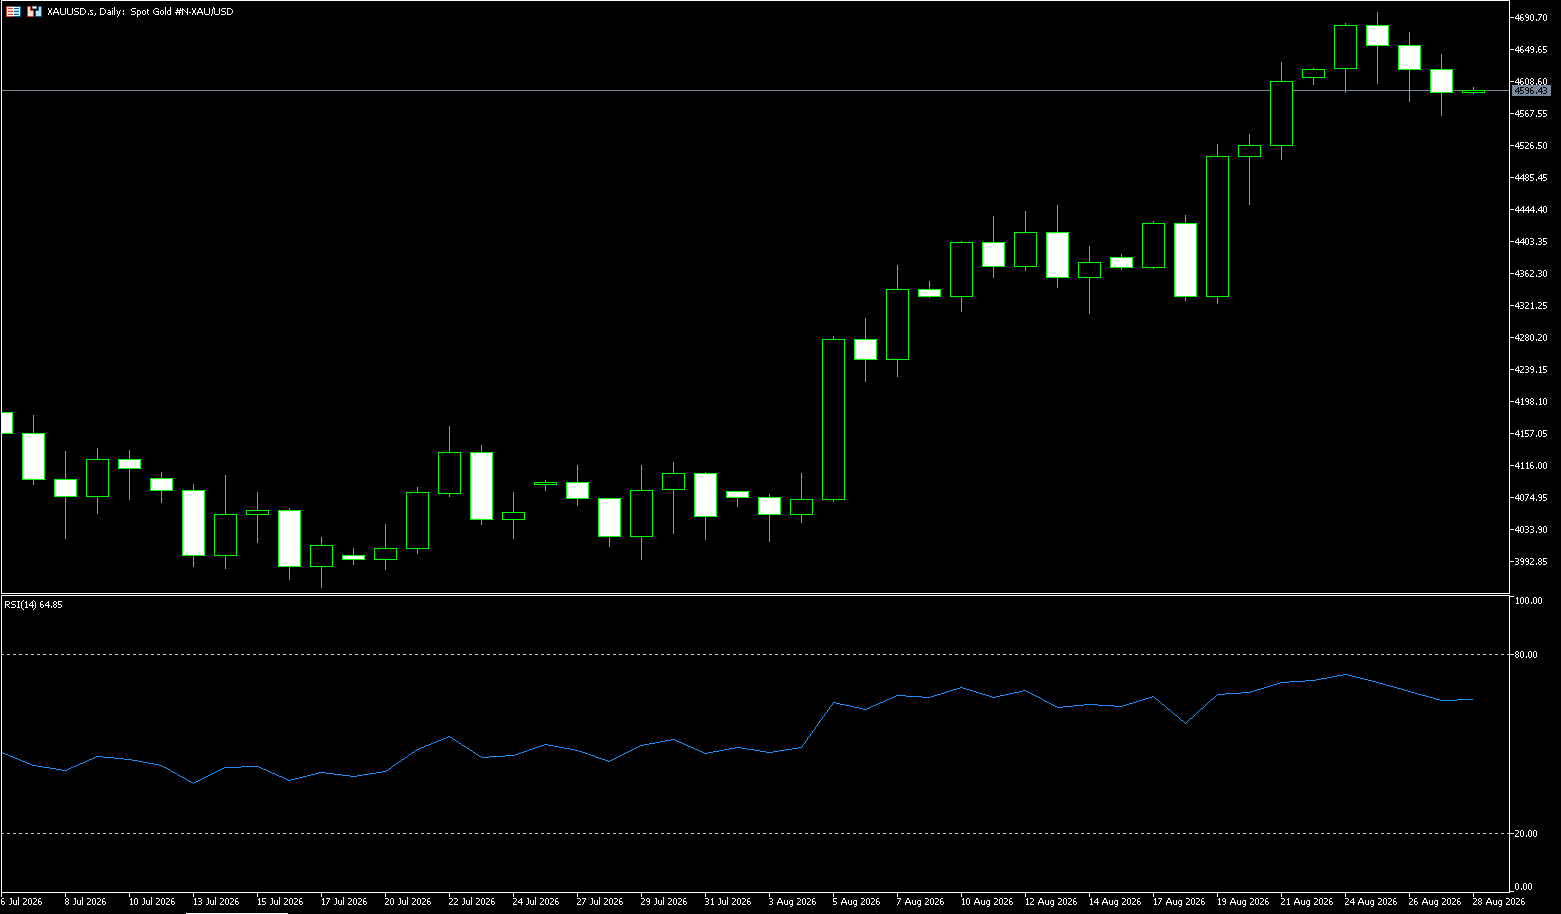
On Thursday, spot gold traded around $4,610 per ounce. Gold prices fell on Wednesday as US PCE data met expectations, boosting bets on a Fed rate hike. Profit-taking by some investors limited gains as gold approached the $4,700 per ounce level. Gold entered a consolidation phase, with bullish momentum waning and the Relative Strength Index (RSI) entering overbought territory. Geopolitical tensions remain a key influencing factor: Axios News, citing sources, reported that two US officials confirmed President Trump announced that the US Navy had opened the Strait of Hormuz's separation channel for ships. Geopolitically, a senior Iranian source stated that Iran and Oman are still negotiating the details of the Strait of Hormuz agreement, following previous statements from the Iranian Revolutionary Guard indicating that the two sides had reached an agreement on sharing the waterway and revenue. Strong resistance formed around $4,700, suppressing gold prices. Meanwhile, US housing data showed a slight recovery; the 4-week moving average of ADP employment change was 11,750, higher than the previous value of 9,500.
Gold traded sideways for the second consecutive day, with bulls unable to break through the $4,700 psychological level, causing prices to fall back to slightly below $4,600. The RSI indicator is below 70 and turning downwards. If the RSI breaks below 70, spot gold may further test key support levels. The first support level is $4,583 (Wednesday's low), followed by the 200-day simple moving average at $4,525; below that is the psychological level of $4,500. For gold prices to resume their upward trend, they must re-establish a foothold above the $4,700 level and $4,697 (this week's high). A successful break above these levels could see a move towards the May 7 high of $4,764, followed by a test of $4,800, with the next target at $5,000.
Today, consider going long on gold at $4,605, with a stop-loss at $4,600 and targets at $4,650 and $4,660.
AUD/USD
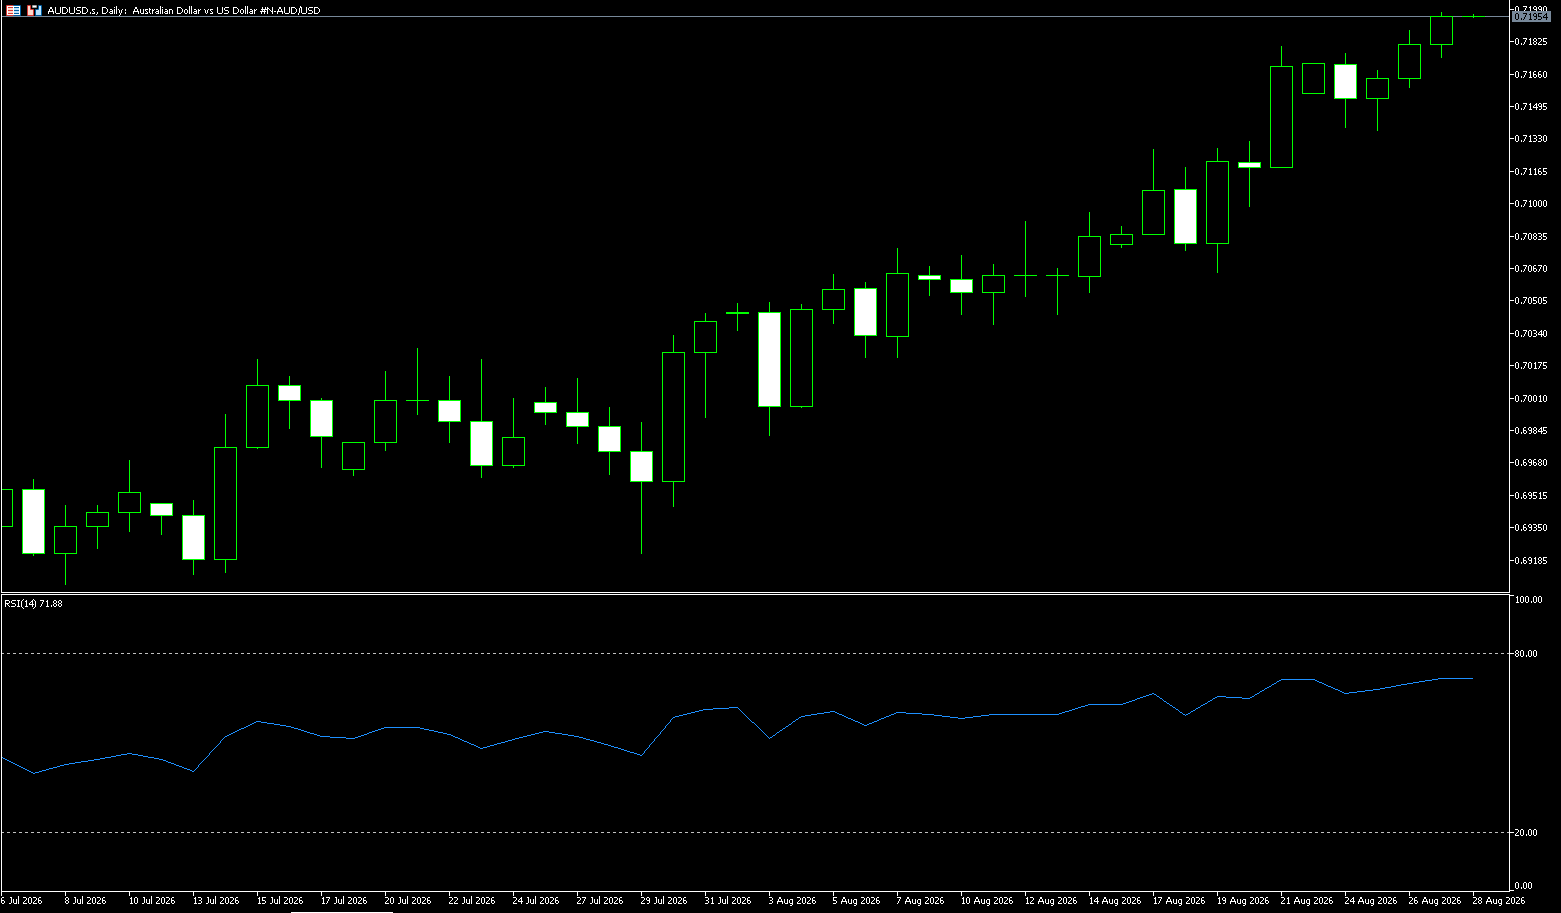
The Australian dollar/US dollar pair extended its gains for the third consecutive trading day during Thursday's Asian session, trading around 0.7190. Despite a 3.6% decline in domestic private capital spending in the second quarter, far below the market's expectation of flat growth after a previous forecast of 6.5%, the pair remains bullish and resilient. This underlying strength in the Australian dollar is primarily driven by rising expectations of an upcoming Reserve Bank of Australia (RBA) rate hike, catalyzed by a higher-than-expected July inflation report indicating persistent price pressures. ANZ currently expects the RBA to raise rates to 4.6% at its September meeting. Although the RBA kept the cash rate unchanged at 4.35% after its third consecutive rate hike in August, policymakers have explicitly warned that further tightening of monetary policy remains under consideration should inflation risks intensify.
From the 4-hour chart, the AUD/USD pair is trading at 0.7190, maintaining a constructive bullish tone overall, as the pair remains above the 20-period simple moving average at 0.7165 and the longer-term 100-period simple moving average at 0.7095. The pair is testing a narrow upper supply zone below recent highs, while the 14-period Relative Strength Index (RSI) remains positive near 64, suggesting continued upward momentum but not yet overbought conditions. On the upside, immediate resistance lies at the psychological level around 0.7200, followed by the recent upper limit at 0.7273 (the high of May 13th). On the downside, initial support is concentrated at the lower Bollinger Band at 0.7140, reinforced by the psychological level of 0.7100 and the 100-period simple moving average at 0.7095; further downside would provide deeper structural support near the 0.7050 level.
Consider going long on the Australian dollar at 0.7185 today, with a stop loss at 0.7175 and targets at 0.7230 and 0.7240.
GBP/USD
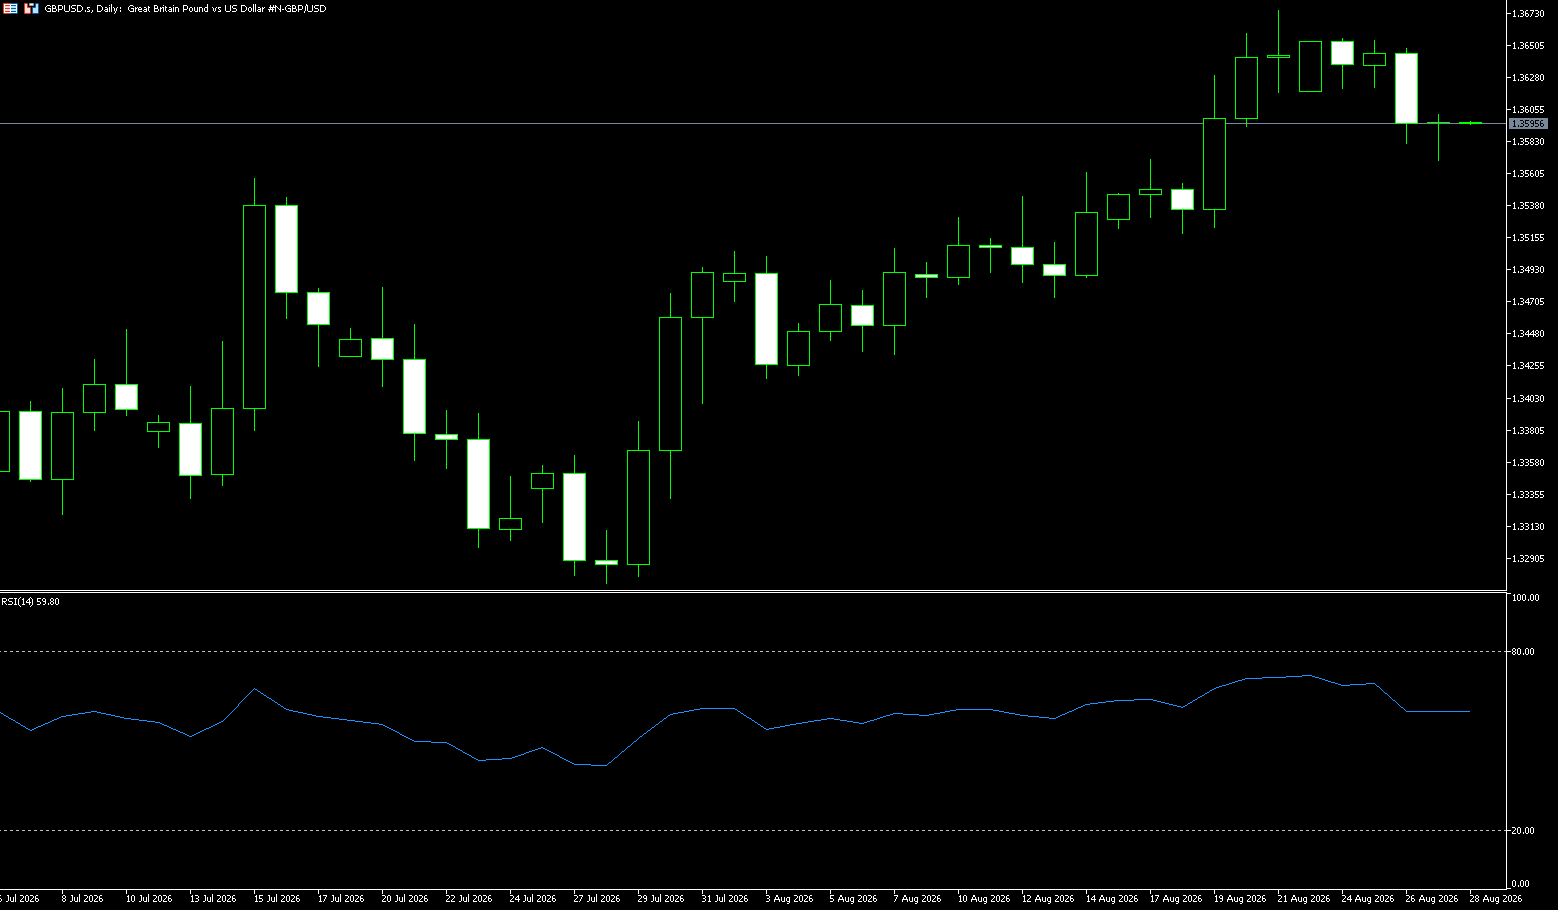
The pound is trading around $1.36, near its highest level since mid-February, as the market continues to price in a Bank of England rate hike this year, despite falling oil prices, while expressing concerns about persistent inflation and rising government debt. Brent crude fell for the third consecutive trading day after talks between Iran and Oman on reopening the Strait of Hormuz, with the Omani Foreign Ministry indicating a possible announcement of a temporary corridor soon. Unconfirmed reports also suggest a possible new ceasefire agreement between the US and Iran in the coming days. The market continues to expect at least a 25 basis point rate hike by the Bank of England by the end of the year, after data showed UK inflation accelerated to 2.9% in July, the highest level since March, and is expected to rise further before the end of the year. Attention will also turn to Andy Burnham's first budget in October. On Tuesday, the UK announced plans to spend £10 billion in London for low-cost housing for tenants.
From a daily technical perspective, GBP/USD has been steadily rising from its July lows, reaching around 1.3673, near the Bollinger Band's upper band. The Bollinger Band's middle line continues to move upwards, and the upper band is expanding accordingly, indicating a significant increase in the recent center of gravity for volatility. In the MACD indicator, both the DIFF and DEA are above the zero line, reflecting that the previous momentum was still in positive territory. However, the latest histogram is somewhat lower than the previous high, indicating that short-term momentum changes are becoming more sensitive. Short-term resistance: The 1.3675 area (last week's high) is the top, with every attempt this week being rejected. A daily close above this level would reopen the August highs below 1.3700; this would be the last mark on the chart before the pair trades above any published level since February. Support: The 1.3550 area is the first real support level, located slightly below the intraday low of 1.3600. Further down, 1.3500 is the psychological level crossed during the August breakout.
Consider going long on GBP at 1.3580 today, with a stop-loss at 1.3570 and targets at 1.3635 and 1.3650.
USD/JPY
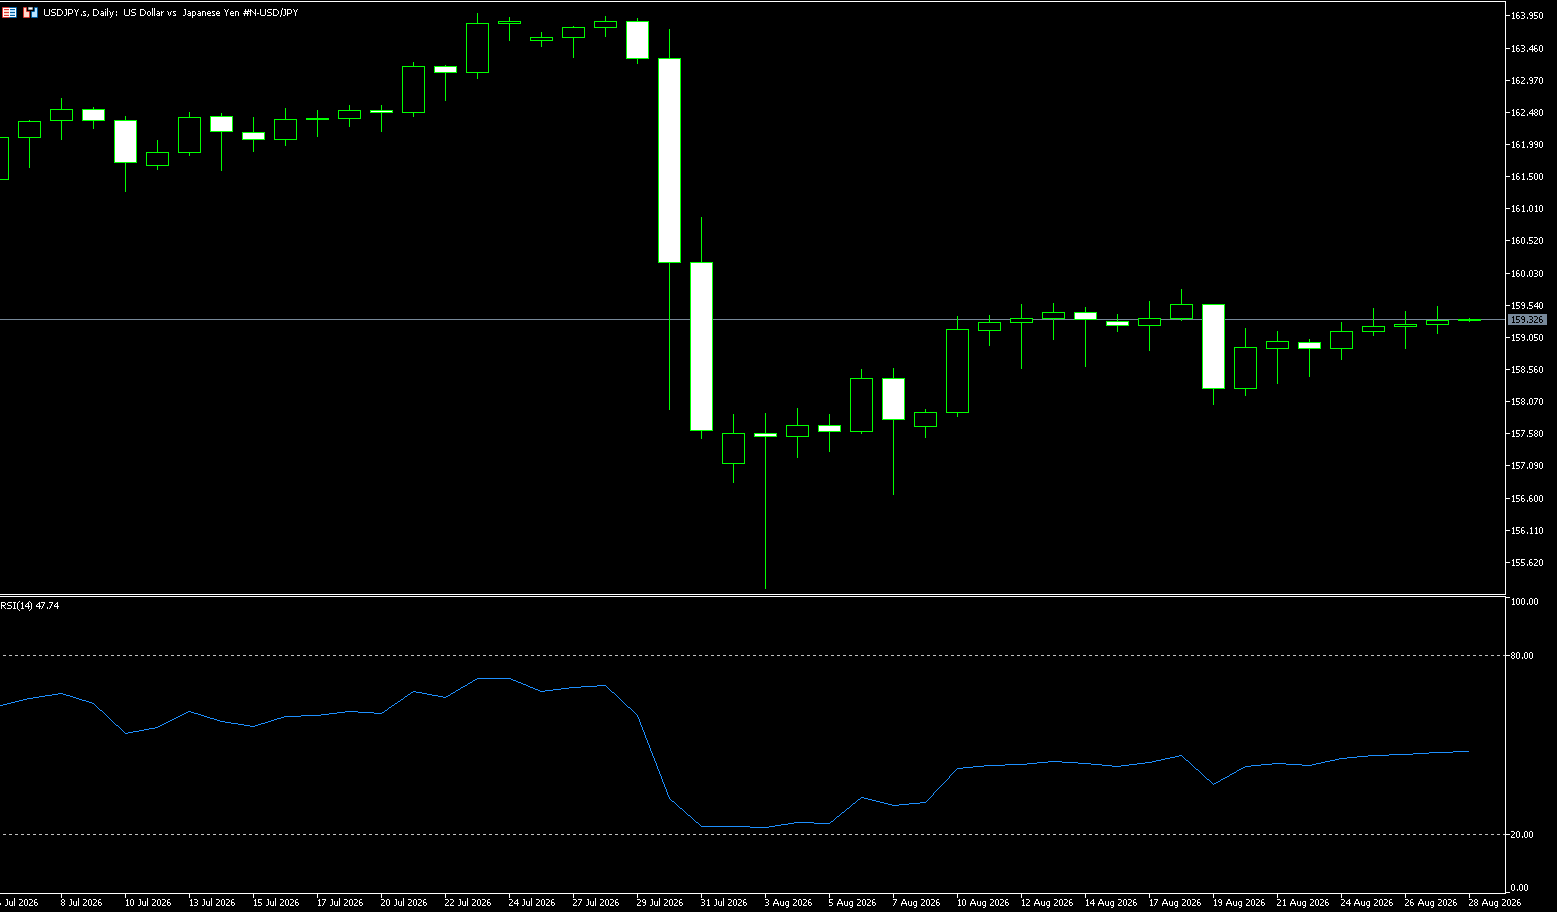
The USD/JPY pair attracted some selling during Thursday's Asian session, ending a three-day winning streak, but downside appeared limited. The spot price is currently trading above the 159.00 level, with market focus remaining on Tokyo inflation data and Friday's Jackson Hole symposium. Meanwhile, market optimism regarding a US-Iran peace agreement and the reopening of the Strait of Hormuz dampened the slightly bullish US inflation data's push for a stronger dollar, putting some pressure on the USD/JPY pair. Russian state media reported that the US and Iran have reached a new ceasefire agreement, expected to be announced in the coming days. Another report stated that Iran and Oman have reached an agreement on commercial shipping routes through the Strait of Hormuz. This offset market expectations of at least one Fed rate hike in 2026 and put dollar bulls on the defensive. The US Commerce Department reported Wednesday that the Personal Consumption Expenditures (PCE) price index rose 3.7% year-on-year in July, unchanged from the previous month and slightly above market expectations. This suggests that inflation remains stubborn and supports the case for the Fed to tighten policy.
Despite market bets on a faster rate hike by the Bank of Japan, the yen may struggle to attract any meaningful buying due to concerns about Japan's deteriorating fiscal situation and the still significant USD/JPY interest rate differential. This necessitates caution from USD/JPY bears. On the 4-hour chart, the USD/JPY pair remains above the 50-period simple moving average at 159.11 and the 38.2% Fibonacci retracement level of the 40-year high, maintaining a constructive bullish tone. On the upside, initial resistance lies at the 50.0% Fibonacci retracement at 159.63, followed by the 61.8% Fibonacci retracement at 160.66, and the cycle high area around the 60.00 level (a psychological level). On the downside, initial support is at the 100-period simple moving average at 158.88, with deeper support at the 158.00 level (a psychological level), and lower Fibonacci support at 157.33 and 155.27.
Today, consider shorting the US dollar at 159.50, with a stop loss at 159.65 and targets at 158.70 and 158.80.
EUR/USD
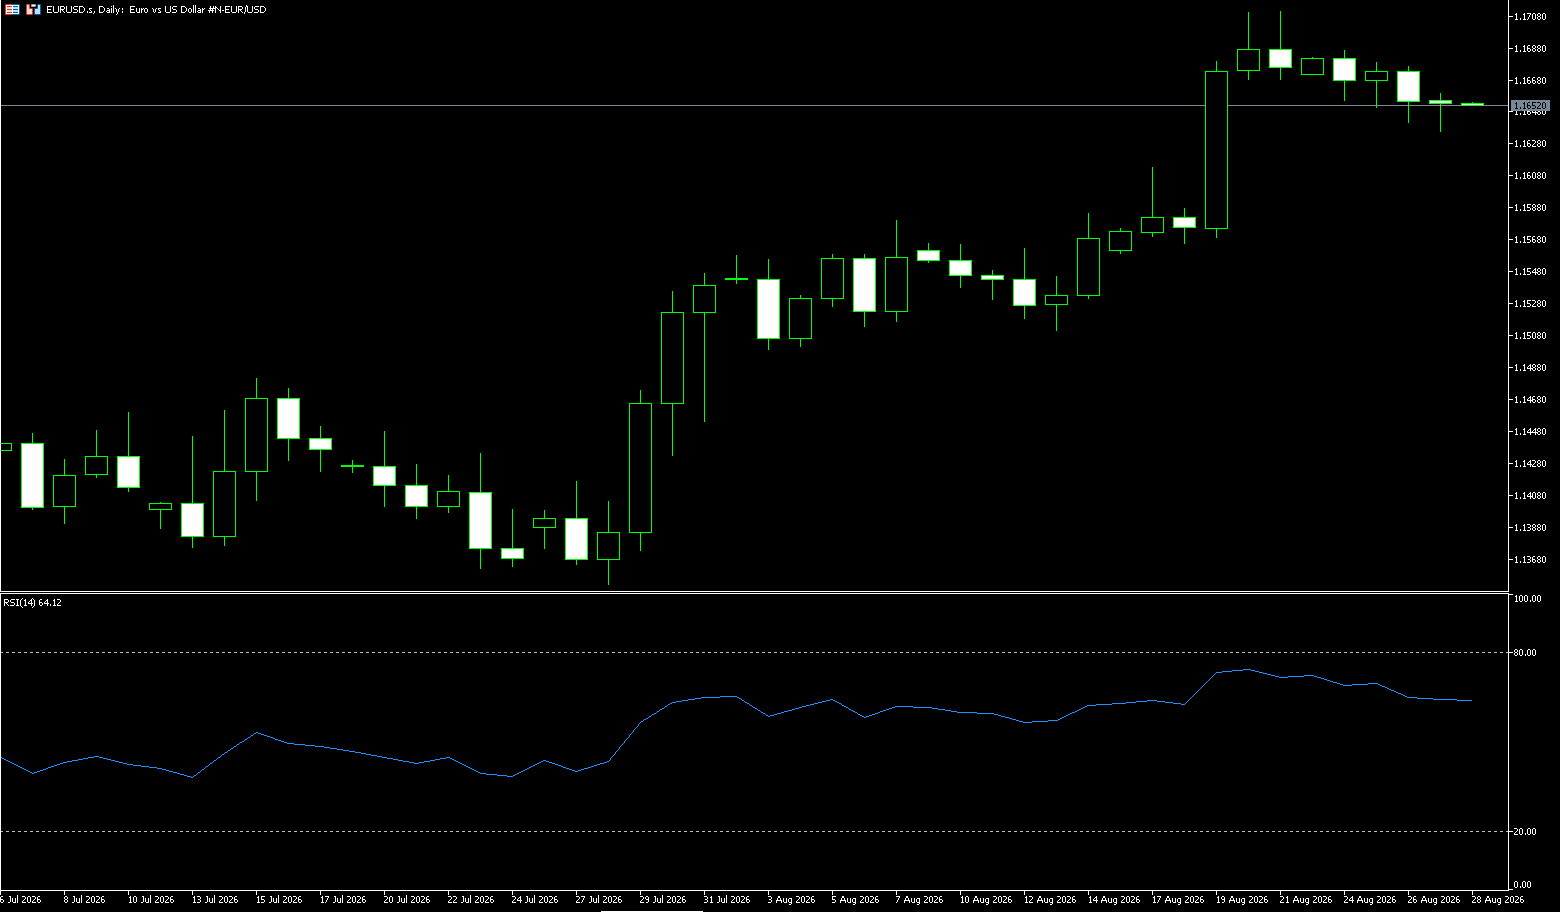
In early Asian trading on Thursday, the euro/dollar pair rose slightly to around 1.1655. The European Central Bank's hawkish stance provided some support for the euro against the dollar. Traders will be closely watching the Jackson Hole symposium later on Friday for new impetus. Amid ongoing geopolitical tensions, the ECB is expected to raise its key interest rate in September after tightening policy in June to curb price pressures. According to Reuters, the market currently expects a near 25% probability that the ECB's deposit rate will reach 3.0% by March 2027, and about a 60% probability by September. Across the Atlantic, the US Bureau of Economic Analysis reported on Wednesday that the Federal Reserve's preferred inflation gauge—the core personal consumption expenditures (PCE) price index—remained at 3.3% year-on-year in July, in line with expectations. Traders will be looking for further clues from speeches by Federal Reserve officials at the annual symposium in Jackson Hole, Wyoming this week. Fed Chairman Kevin Warsh's remarks will be the focus.
On the daily chart, EUR/USD continued its rebound, breaking above the 100-day simple moving average at 1.1574 and the 20-day simple moving average at 1.1587, both of which are currently supporting a constructive bullish bias. The pair is approaching the middle of the Bollinger Bands range, with the upper band providing overhead supply nearby. The 14-day Relative Strength Index (RSI) is at 65.8, nearing overbought territory, suggesting solid upward momentum, but also increasingly appearing stretched. On the downside, initial support is concentrated around the 20-day simple moving average at 1.1587, with the 100-day simple moving average at 1.1574 providing further support below. If a broader pullback unfolds, the lower Bollinger Band at 1.1462 will become a deeper demand area. On the upside, immediate resistance lies at 1.1712 near the Bollinger Band and the August 21 high of 1.1711. A sustained break above this level would open the way for a continuation of the current bullish phase to the 1.1750 level.
Consider going long on the Euro today at 1.1640, with a stop-loss at 1.1630 and targets at 1.1700 and 1.1690.
Stock Analysis:
Australian ASX 200 Stock Index
Basic Market Overview:
The Australian Securities Exchange (ASX) 200 index fell 90 points, or 1.0%, to close at 9,038 on Thursday, extending previous losses as concerns intensified that the Reserve Bank of Australia might tighten monetary policy next month, following higher-than-expected inflation data. Meanwhile, three of the four major banks now expect further rate hikes later this year, after three already planned increases by 2026. Losses were broad-based, with retail trade, consumer stocks, non-energy mining, and financials leading the decline. However, a surge in US futures markets, driven by Nvidia's significantly better-than-expected earnings (second-quarter revenue doubled, exceeding expectations by the largest margin in two years), limited market sentiment.
Locally, household spending exceeded expectations in July, rising for the third consecutive month. Heavyweights BHP Billiton and Rio Tinto fell 1.5% and 0.5% respectively. Wesfarmers fell 4.6% as warnings of tighter household budgets overshadowed stronger annual profits. Conversely, Qantas rose 4.8% after issuing optimistic revenue guidance.
Sector Performance:
Leading Gains: Some aerospace stocks bucked the trend and strengthened, benefiting from earnings guidance; heavyweight mining companies generally closed lower (BHP -1.5%).
Lagging Gains: Consumer discretionary, retail, raw materials and mining, financials, and real estate REITs; interest rate-sensitive sectors were under significant pressure.
Highlights: BHP hit a new high; healthcare stocks Ansell and CSL rose sharply; some lithium mining stocks saw profit-taking.
Technical Analysis:
The ASX200 index closed at 9038 points on Thursday, down 1.0%, or 90 points. It trended downwards throughout the day, exhibiting a broad-based sell-off. Better-than-expected Australian inflation data led the market to heavily price in expectations of further RBA rate hikes, suppressing risk assets. Nvidia's strong earnings report provided some hedging, but was insufficient to offset local negative factors. Technical Analysis: The index broke below the 20-day moving average at 9087, indicating a significant weakening of short-term bullish momentum. The RSI has retreated from its highs, entering a neutral-to-weak range. The medium-term trend remains upward, but a short-term correction is underway.
Friday's Technical Forecast – Bullish Scenario: Holding above the 9000 level and regaining the 9087-9100 range, a short-term rebound is expected, targeting the 9160-9200 resistance zone. This requires a recovery in overseas risk appetite and a marginal cooling of market expectations for an Australian interest rate hike. Bearish Scenario: A decisive break below 9000 and a failed close would extend the correction further, targeting 8965-8980 (50EMA). If this level is breached with significant volume, the correction could extend to around 8900. Overall Assessment: The medium-term trend remains bullish, but the short-term market is in a correction and consolidation phase with increased volatility. The direction will depend on whether the 9000 and 9087 levels are breached.
Trading Strategies:
Short-Term Trading Strategies (Intraday - 3-Trading-Day Perspective)
1. Bullish Strategy
• If a pullback to the 8965-8980 support zone shows a reversal candlestick pattern, a small long position can be initiated; the stop-loss should be placed below 8900; the first target is 9087-9100, and the second target is 9160-9200.
• Do not chase highs; only consider going long after a firm recovery above 9100.
2. Bearish Strategy
• If the early morning rebound is weak and the price is pressured below 9100, and then breaks below 9000, a small short position can be initiated; the stop-loss should be placed above 9125; the first target is 8965-8980, and a break below that level could target 8900.
Key Risk Warnings:
1. Risk of RBA Interest Rate Hike Expectations: Inflation data has already priced in an interest rate hike. If officials release hawkish comments, the index will quickly plummet, with interest rate-sensitive sectors (banks, real estate, and consumer goods) being hit hardest.
2. Risk of International Linkage: Jackson Hole speeches and volatility in US tech stocks will directly impact the ASX200 opening and intraday sentiment. Overnight fluctuations in overseas markets can create gaps, easily triggering stop-loss orders.
3. Risk of Leveraged Trading: Index CFD/futures leverage amplifies profits and losses. Strictly control position size; the risk of a single trade should not exceed 1% of account funds. Do not add to losing positions.
4. Risk of False Breakouts at Key Price Levels: Fridays are prone to price action, with a quick recovery after breaking support/resistance levels. Prioritize confirmation from the closing price, rather than relying solely on intraday price movements.
New Zealand Stock Market Index {NZX50}
Basic Market Overview:
The New Zealand stock market fell 133 points, or 1.0%, to close at 13,880 on Thursday, erasing gains from the morning and the previous two days, as traders took profits after the index hit a record high the previous day. The broader index retreated from the 14,000 level first reached on Wednesday, supported by the materials sector. However, gains in US stock index futures were limited by a surge in Nvidia's share price following its earnings release. Almost all sectors declined, led by consumer goods. Precinct Properties NZ plunged 4.3% after its earnings report.
Other underperforming companies included A2 Milk (-3.4%), Meridian Energy (-2.7%), EBOS Group (-1.3%), Infratil (-1.3%), ANZ Group (-1.2%), and Fisher & Paykel (-1.0%). Meanwhile, Genesis Energy rose 1.8% after reporting higher earnings, although profits were halved due to valuation factors. Summerset Group shares surged 8.0% after reporting a 92% jump in net profit for the six months ended June 30, 2026.
Sector Performance:
Low-performing sectors: Consumer staples; Real estate; Utilities
Largest-performing sectors: Information and communication, semiconductor equipment, Insurance
Technical Analysis:
The market closed at 13880 points on Thursday, down 1.0%. After reaching a record high of 14042 during the day, it retreated from Wednesday's record high of 14013, giving back some of its gains, indicating profit-taking at higher levels. Sector performance: Consumer staples led the decline; Utilities and Healthcare were relatively resilient; overnight strength in US stock futures (driven by Nvidia's earnings report) limited the downside to some extent, with most sectors closing lower. Technical pattern: A long upper shadow candlestick indicates a failed test of the strong resistance level of 14000-14047, suggesting that selling pressure was released after the bulls' initial surge, and a clear profit-taking signal appeared at the high level. Earnings season saw some stocks experience profit-taking and capital outflows; the strong New Zealand dollar, Fed policy expectations, and overnight US stock performance indirectly impacted the NZX50 index.
Friday's technical outlook: Technical indicators: The RSI has retreated from its highs, ending several days of overbought conditions; short-term moving averages remain upward, but the long upper shadow indicates significant upward pressure and weakening bullish momentum. Key resistance levels: 13964; strong resistance: 14000-14047 (historical high zone); Support levels: First support: 13830-13880; strong support: 13798. Friday's scenario projection: Slightly bullish scenario: Holding above 13830, a rebound towards 13964; only a strong break above 13964 with significant volume will offer a chance to challenge the 14000 level again. Weak Scenario: A decisive break below 13830 would lead to further retracement, with support around 13798. The previous high-level consolidation would likely transition into a corrective pullback.
Trading Strategy:
Operating Strategy (Short-Term Perspective)
1. Bullish: Avoid chasing highs. Consider going long only after a pullback to the 13830-13880 support zone shows signs of stabilization; set a stop-loss below 13790; initial target is 13964, with a further target of 14000 if this level is broken.
2. Bearish: Consider a small short position if a rebound to 13950-13964 encounters resistance; set a stop-loss above 14050; targets are 13830 and 13798.
Key Risk Warnings:
1. External Risks: Volatility in US stocks, US Treasury yields, speeches by Federal Reserve officials, and US PCE inflation data will directly impact the NZX50's risk appetite. Overnight volatility in overseas markets could easily cause a gap at the open.
2. Local Risks: Earnings season is approaching, with a concentration of individual stock releases. Weaker-than-expected earnings from heavyweight stocks could drag down the index. Weak New Zealand retail sales data, coupled with expectations of a Fed rate hike, are suppressing the medium-term valuation of the local stock market.
3. Technical Risks: The index has just reached a new historical high, and the long upper shadow candlestick indicates significant selling pressure. A breach of key support levels could trigger a short-term correction.
4. Trading Risks: The NZX50 has lower liquidity than the US and Australian markets, resulting in a high risk of slippage due to gaps. Short-term traders must implement stop-loss orders and avoid heavy leverage for one-sided trading.
Disclaimer: The information contained herein (1) is proprietary to BCR and/or its content providers; (2) may not be copied or distributed; (3) is not warranted to be accurate, complete or timely; and, (4) does not constitute advice or a recommendation by BCR or its content providers in respect of the investment in financial instruments. Neither BCR or its content providers are responsible for any damages or losses arising from any use of this information. Past performance is no guarantee of future results.
Lebih Liputan






2026 © - All Rights Reserved by BCR Co Pty Ltd
Pendedahan Risiko:Instrumen derivatif diniagakan di luar bursa dengan margin, yang bermakna ia membawa tahap risiko yang tinggi dan terdapat kemungkinan anda boleh kehilangan seluruh pelaburan anda. Produk-produk ini tidak sesuai untuk semua pelabur. Pastikan anda memahami sepenuhnya risiko dan pertimbangkan dengan teliti keadaan kewangan dan pengalaman dagangan anda sebelum berdagang. Cari nasihat kewangan bebas jika perlu sebelum membuka akaun dengan BCR.
BCR Co Pty Ltd (No. Syarikat 1975046) ialah syarikat yang diperbadankan di bawah undang-undang British Virgin Islands, dengan pejabat berdaftar di Trident Chambers, Wickham’s Cay 1, Road Town, Tortola, British Virgin Islands, dan dilesenkan serta dikawal selia oleh Suruhanjaya Perkhidmatan Kewangan British Virgin Islands di bawah Lesen No. SIBA/L/19/1122.
Open Bridge Limited (No. Syarikat 16701394) ialah syarikat yang diperbadankan di bawah Akta Syarikat 2006 dan berdaftar di England dan Wales, dengan alamat berdaftar di Kemp House, 160 City Road, London, England, EC1V 2NX. Open Bridge Limited bertindak semata-mata sebagai pemproses pembayaran untuk BCR Co Pty Ltd dan tidak menyediakan sebarang perkhidmatan kewangan, perdagangan atau pelaburan bagi pihaknya. Peranan Open Bridge Limited adalah terhad kepada pemprosesan pembayaran.


 English
 简体中文
简体中文
 繁體中文
繁體中文
 Bahasa
Melayu
Bahasa
Melayu
 Tiếng
Việt
Tiếng
Việt
 ไทย
ไทย
 日本語
日本語
 한국어
한국어
 ភាសាខ្មែរ
 español