


Hãy cập nhật thông tin với phân tích ngoại hối kịp thời của chúng tôi
0
The US Dollar Index
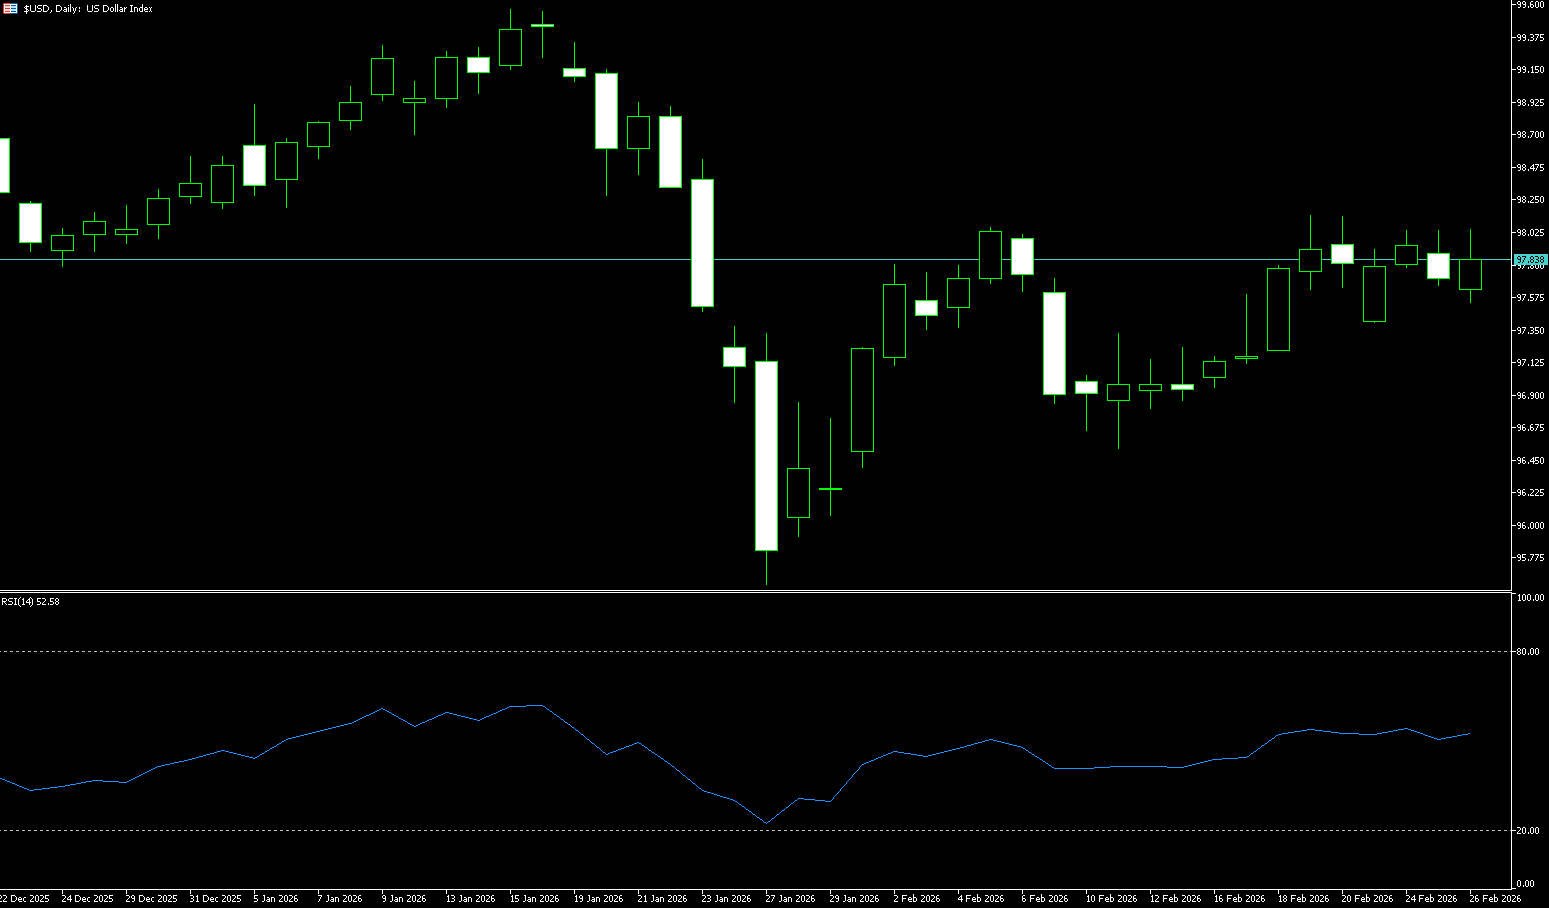
The US dollar index edged lower on Thursday, closing at 97.75, hovering near a one-month high reached last week. Investors continued to await new catalysts, and uncertainty remained despite some easing concerns about President Trump's trade policies. Sentiment was also weighed down by worries related to US-Iran negotiations. Meanwhile, both initial and continuing jobless claims were lower than expected, indicating that the US labor market has stabilized and employers are continuing to retain staff. At the same time, the money market has lowered its expectations for a Federal Reserve rate cut. The probability of a 25 basis point rate cut by June has fallen to 50%, the lowest level this year, while expectations for a third rate cut by the end of the year have almost disappeared.
The daily chart shows that the US dollar index experienced a dramatic rollercoaster ride: it initially surged to 99.49 before retreating, dipping to a low of 95.56 before barely stabilizing, and subsequently embarking on a corrective rebound. Currently, the price is consolidating around the 98 level, seemingly gathering strength for a new upward move. However, the road ahead is not smooth, with clear resistance levels. The 98.00 level (a psychological barrier) and the February 19 high of 98.07 are key resistance zones that will determine whether the trend can reverse. If the bulls effectively break through these levels, the dollar is expected to initiate a medium-term trend reversal, targeting the 200-day moving average at 98.37. On the downside, 97.35 (the low of February 23) is the primary support level to watch. If volatility intensifies, the previous low of 97.00 will become the last line of defense for the medium-term bulls.
Today, consider shorting the dollar index near 97.88; stop loss: 97.98; target: 97.30; 97.40
WTI Crude Oil
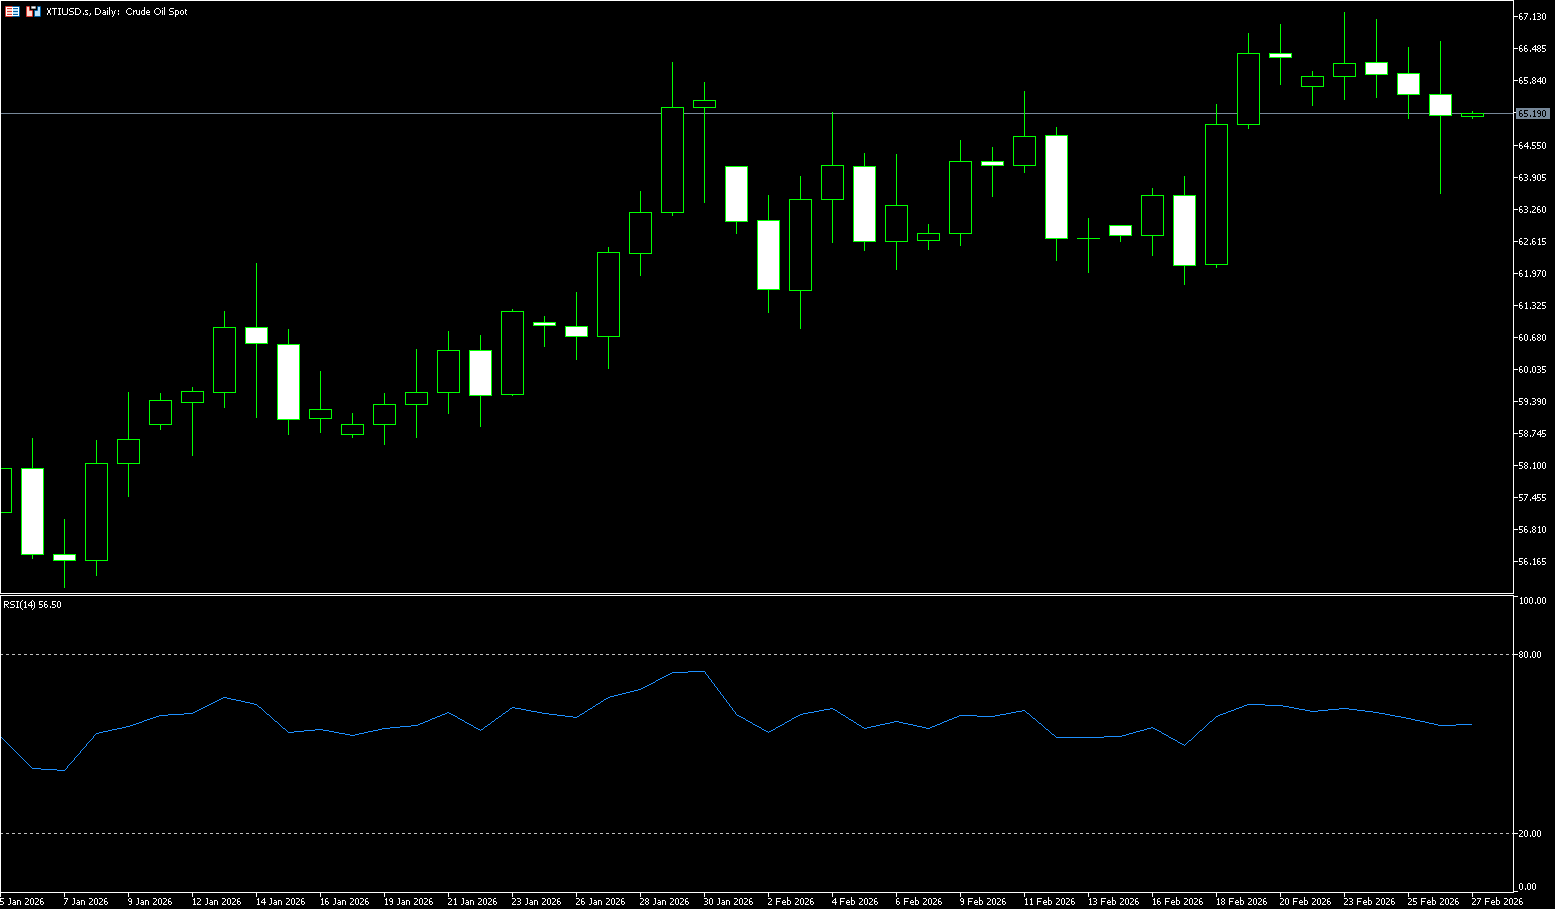
WTI crude oil is trading around $65.50 per barrel. Oil prices fell on Wednesday as US crude oil inventories rose far more than expected, but continued market concerns about geopolitical tensions in the Middle East continued to provide support for prices. Data from the U.S. Energy Information Administration (EIA) showed that crude oil inventories surged by 16 million barrels last week, far exceeding analysts' expectations of a 1.5 million barrel increase, mainly due to declining refinery utilization and increased imports. However, the U.S.'s increased military presence in the Middle East to pressure Iran into negotiations raised market concerns that a potential military conflict could disrupt oil supplies, limiting the negative impact of the inventory data. Meanwhile, Saudi Arabia has initiated a short-term production increase and export plan to address possible supply disruptions, and major OPEC+ oil-producing countries are considering a slight increase in production in April. The market is closely watching the U.S.-Iran Geneva talks on Thursday and the OPEC+ meeting on March 1st.
Looking back at the long-term trend, crude oil entered a prolonged bear market after reaching a high of $147 per barrel in 2008. The U.S. shale oil revolution in 2014 eroded OPEC's pricing power, and the 2020 pandemic caused oil prices to briefly fall into negative territory. Subsequently, oil prices rebounded to $130, and from February 2022, they entered a descending wedge consolidation until recently breaking upwards. WTI crude oil prices surged to a near six-month high of $67.24, fluctuating between $65 and $66. Having broken through this level, the first target is now $70 (a psychological level). Based on chart patterns and volume analysis, a further push towards $76.75 (the high from last June) is possible. The $64.42 level (the 20-day moving average) is a key support level as risk levels ease; a break below this level could lead to a retest of the $62.29 level (the 200-day moving average).
Today, consider going long on crude oil around 65.25; stop loss: 65.10, target: 67.00; 66.70
Spot Gold
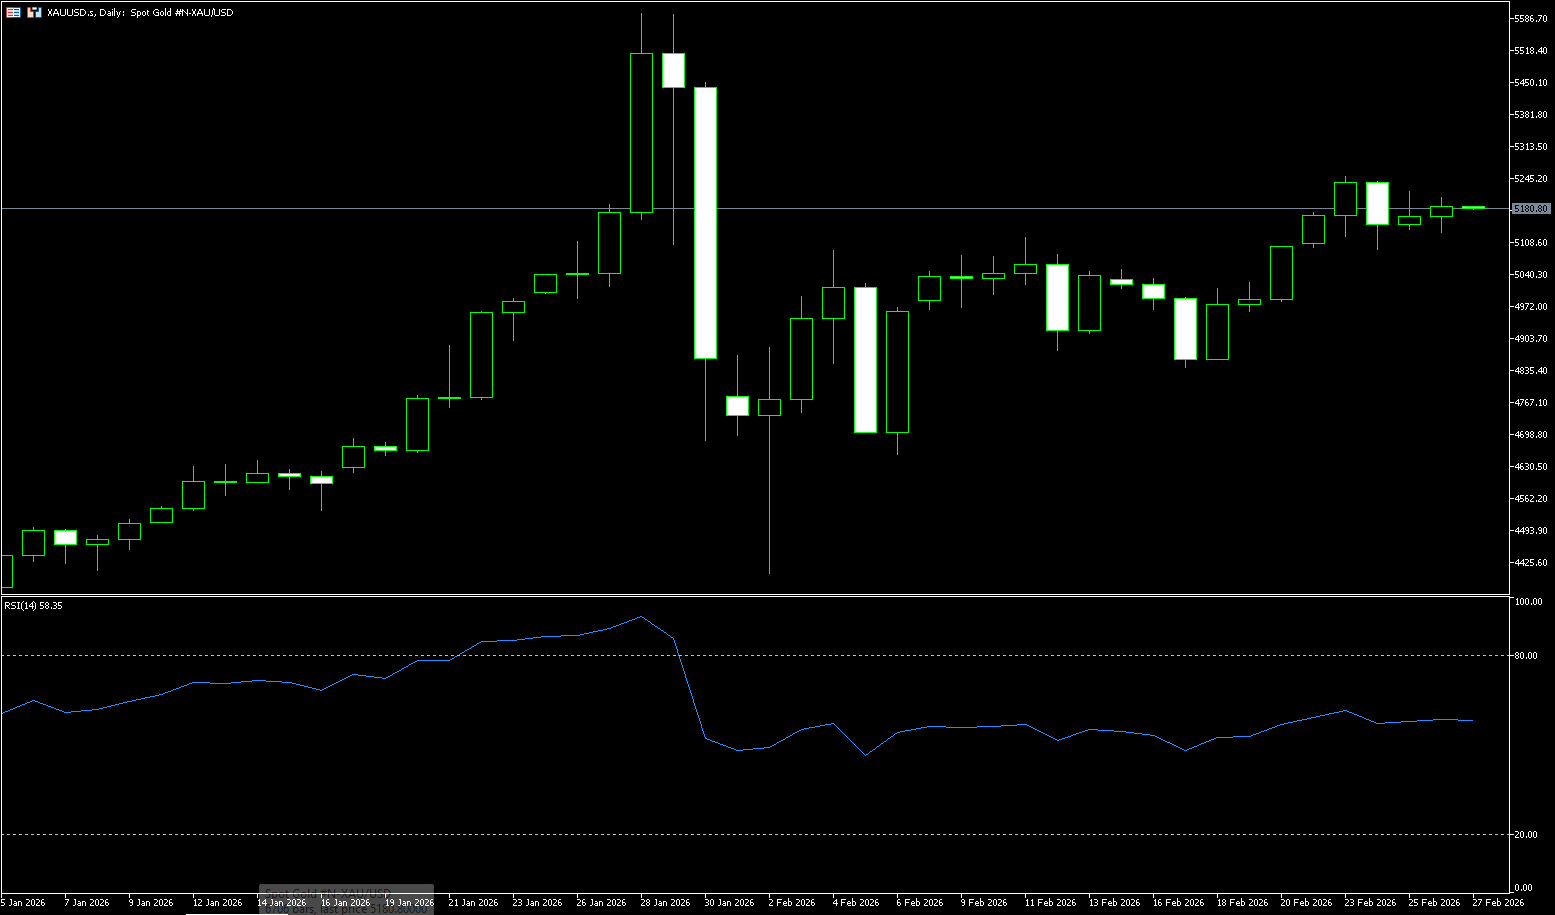
In early Asian trading on Thursday, spot gold traded around $5,185 per ounce. Gold prices climbed on Wednesday as inflationary pressures from US tariffs and geopolitical tensions ahead of the Iran nuclear talks stimulated safe-haven demand. Uncertainty surrounding US domestic policy provided upward momentum for gold. The US Supreme Court rejected the administration's ruling to impose additional tariffs, finding that Trump's invocation of emergency economic powers to advance the tariff agenda exceeded his authority and directly overturned the existing trade policy framework. Although Trump immediately announced a 10% tariff on global trade and hinted at a possible increase to 15%, while threatening higher tariffs on countries that violated trade agreements, the market remains concerned that countries will use this opportunity to demand revisions to existing agreements. Expectations of global trade contraction continue to suppress market risk appetite, further enhancing the allocation value of gold. Supported by both geopolitical conflict and policy uncertainty, gold, with its scarcity and safe-haven attributes, has become the optimal choice for global funds seeking refuge. Gold price momentum has cooled somewhat from overbought territory, but the 14-day Relative Strength Index (RSI) remains stable above its midline, suggesting that upward pressure persists rather than foreshadowing a deeper pullback. The Moving Average Convergence Divergence (MACD) has retreated from recent highs and is trending flat, with the negative histogram contracting, indicating that the market is in a consolidation phase within an overall bullish structure, rather than having completed a top formation. On the upside, initial resistance lies near the recent rally high of $5249.80; a break above this level would open the way to the next bullish target of $5300.00 (a psychological level) and the 76.4% Fibonacci retracement level of $5311.20. As long as gold prices hold above the initial support of $5100, any pullback is likely to be viewed as a correction within the current uptrend. On the downside, initial support appears around the $5,100 level. A break below $5,100 would expose deeper support around the psychological $5,050-$5,000 level.
Consider going long on gold around $5,180 today; Stop loss: $5.175; Target: $5,230; $5,220
AUD/USD
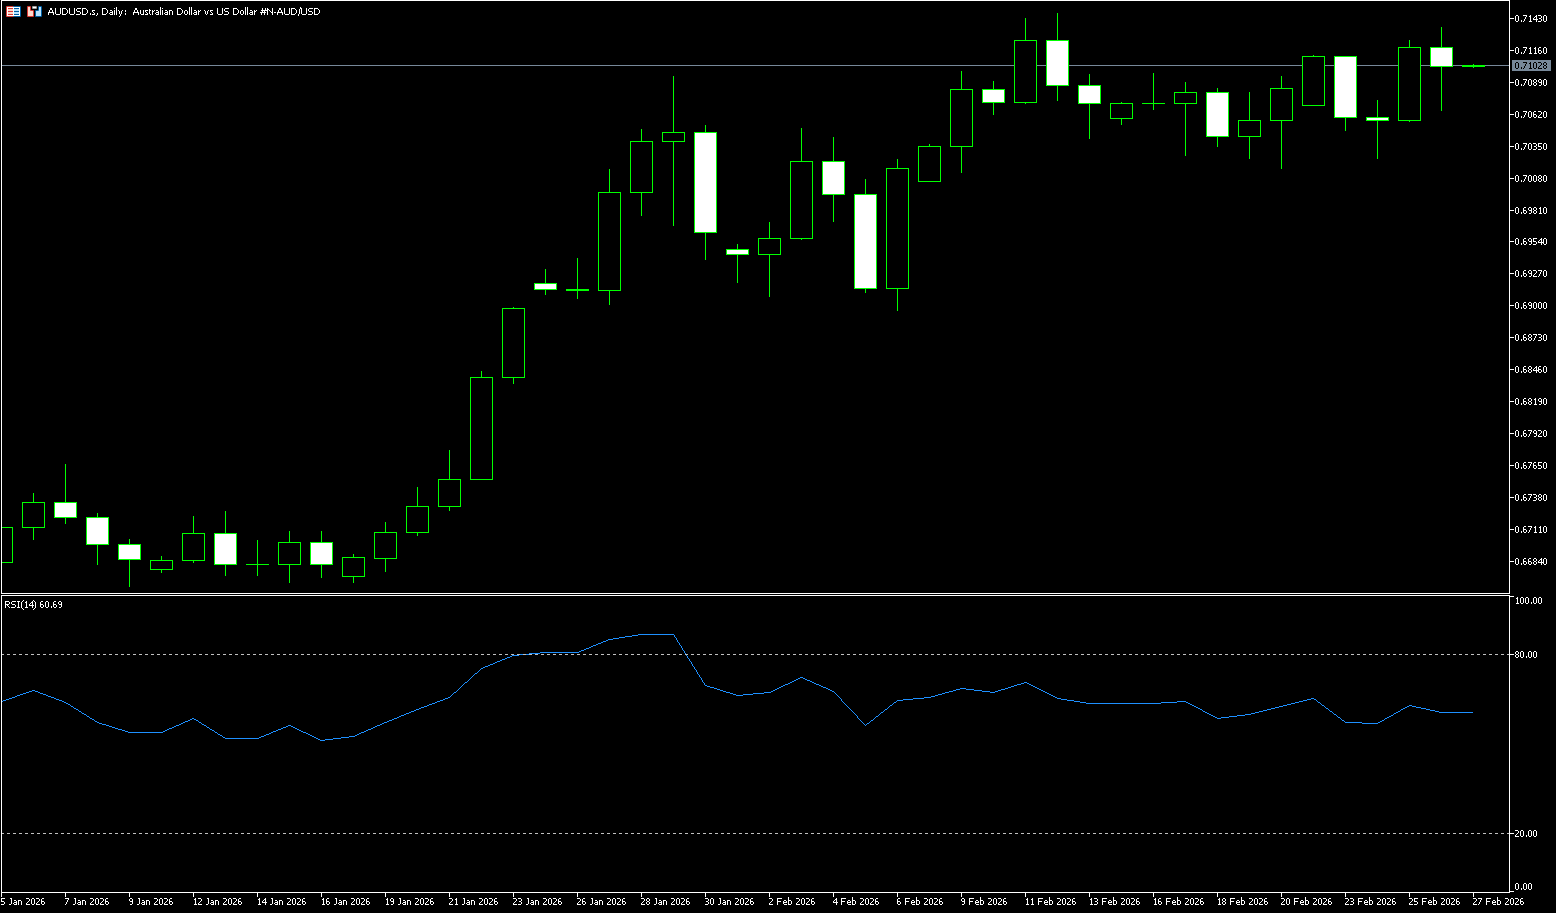
The Australian dollar rose to around $0.7130 on Thursday, reaching its highest level since early August 2022, as market expectations for another interest rate hike increased. The market anticipates an approximately 80% probability that the Reserve Bank of Australia will raise its 3.85% cash rate in May following an unexpected rise in inflation in January. The market also expects a total of about 40 basis points of rate hikes this year, although many analysts believe the terminal rate is close to 4.10%, roughly the peak reached during the post-pandemic inflation surge. Meanwhile, the likelihood of a rate hike in March appears less likely, as policymakers will not receive the full first-quarter inflation report until the end of April. Reserve Bank of Australia Governor Michelle Bullock reiterated that policy patience is necessary given the economy is near equilibrium, which dampened expectations of an aggressive tightening cycle. Focus now shifts to the final readings of next week's manufacturing PMI and GDP data for further clues about the country's economic momentum.
On the daily chart, AUD/USD is trading at 0.7110. The short-term bias is bullish, as the price has broken above the 50-day and 200-day simple moving averages, both trending upwards, forming an upward medium-term structure. The 14-day Relative Strength Index (RSI) is around 66, remaining in positive territory and not reaching overbought levels, while the Average Directional Index (ADX) above 40 shows a strong underlying trend, further reinforcing the upward bias as long as the pair stays above the converging moving averages. Immediate resistance lies at the February 12 high of 0.7147; a sustained break above this level would open the door to resistance at 0.7200. On the downside, initial support is at 0.7052 (20-day moving average), followed by the psychological level around 0.7000.
Consider going long on the Australian dollar around 0.7100 today; Stop loss: 0.7090; Target: 0.7150; 0.7140
GBP/USD
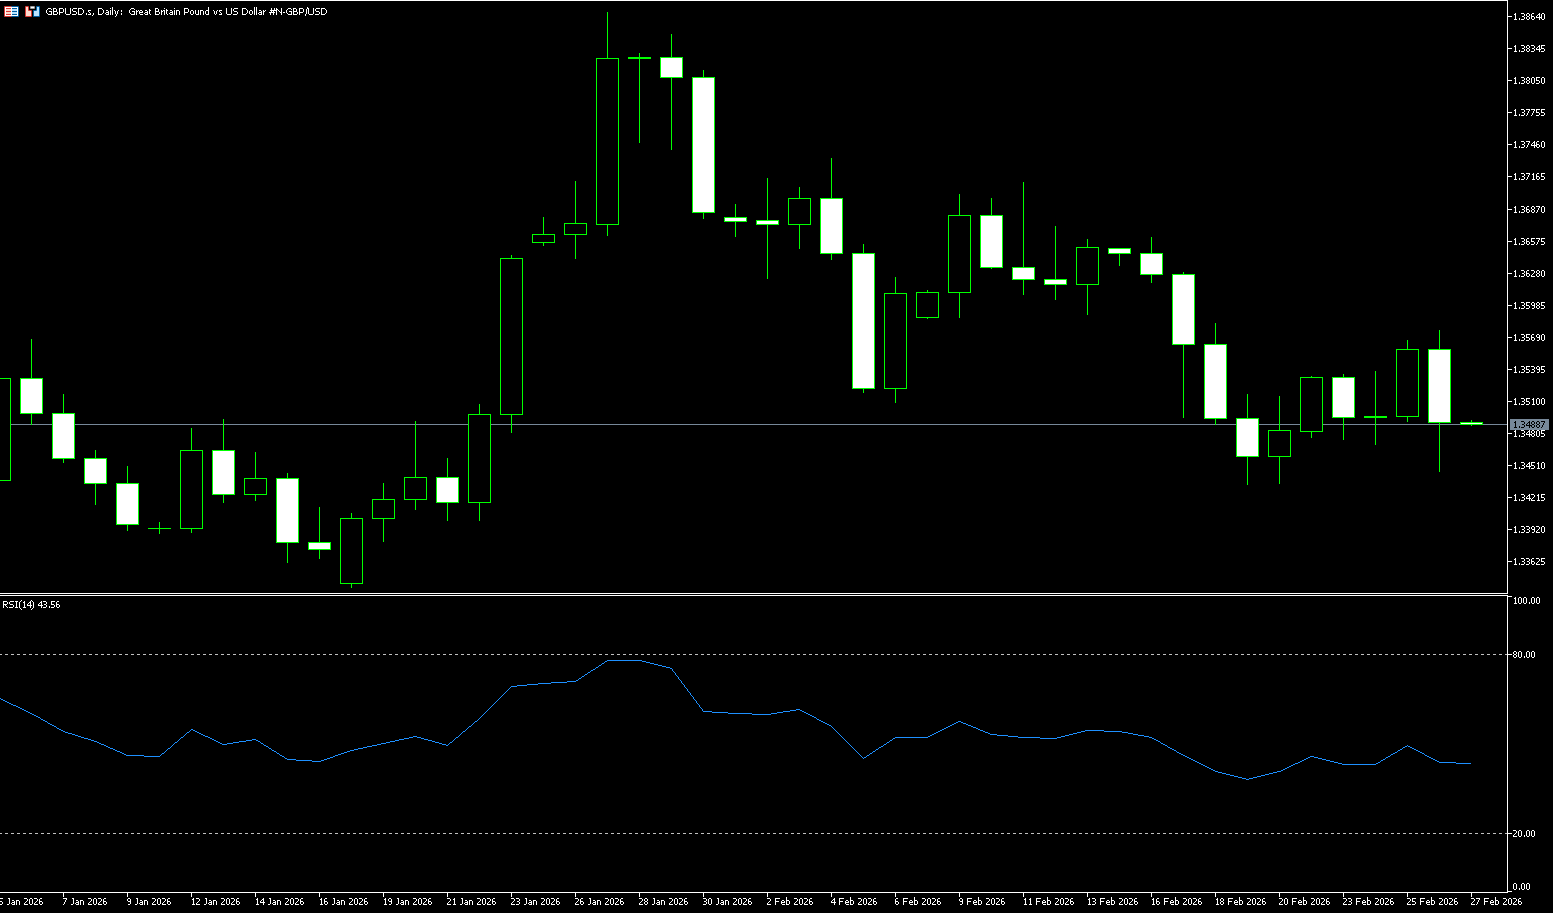
GBP/USD traded around 1.3485 on Thursday. GBP/USD traded firm due to uncertainty surrounding the outlook for US trade policy, while the dollar remained under pressure. This uncertainty stems from the Supreme Court's ruling on President Trump's tariffs, finding them "illegal" due to reliance on emergency economic powers. Meanwhile, market participants are concerned that Washington's trading partners may demand revisions to trade agreements to benefit from the Supreme Court's ruling. However, President Trump has warned that any country intending to non-compliance with trade agreements will face higher tariffs. As for the pound, the outlook for the currency is generally uncertain with expectations of a rate cut by the Bank of England at its March monetary policy meeting.
GBP/USD is trading around 1.3485. The currency pair is consolidating around 1.3500, limiting directional confidence. After a pullback from mid-month highs, the pair has stabilized, with the latest candlesticks clustered near the moving averages, indicating consolidation rather than a clear trend continuation. The 14-day Relative Strength Index (RSI) shows neutral momentum in the 45.00-50.00 range, reinforcing the sideways movement. Initial support is seen at the February 19 low of 1.3434, the recent low; failure to hold this level could lead to a move towards the 1.3400 level (psychological support) and the low of 1.3344. On the upside, a break above 1.3591 (20-day moving average) and the 1.3600 (psychological support) area could lead to a retest of the February 16 high of 1.3662.
Consider going long on GBP/JPY around 1.3474 today; Stop loss: 1.3464, Target: 1.3520; 1.3530
USD/JPY
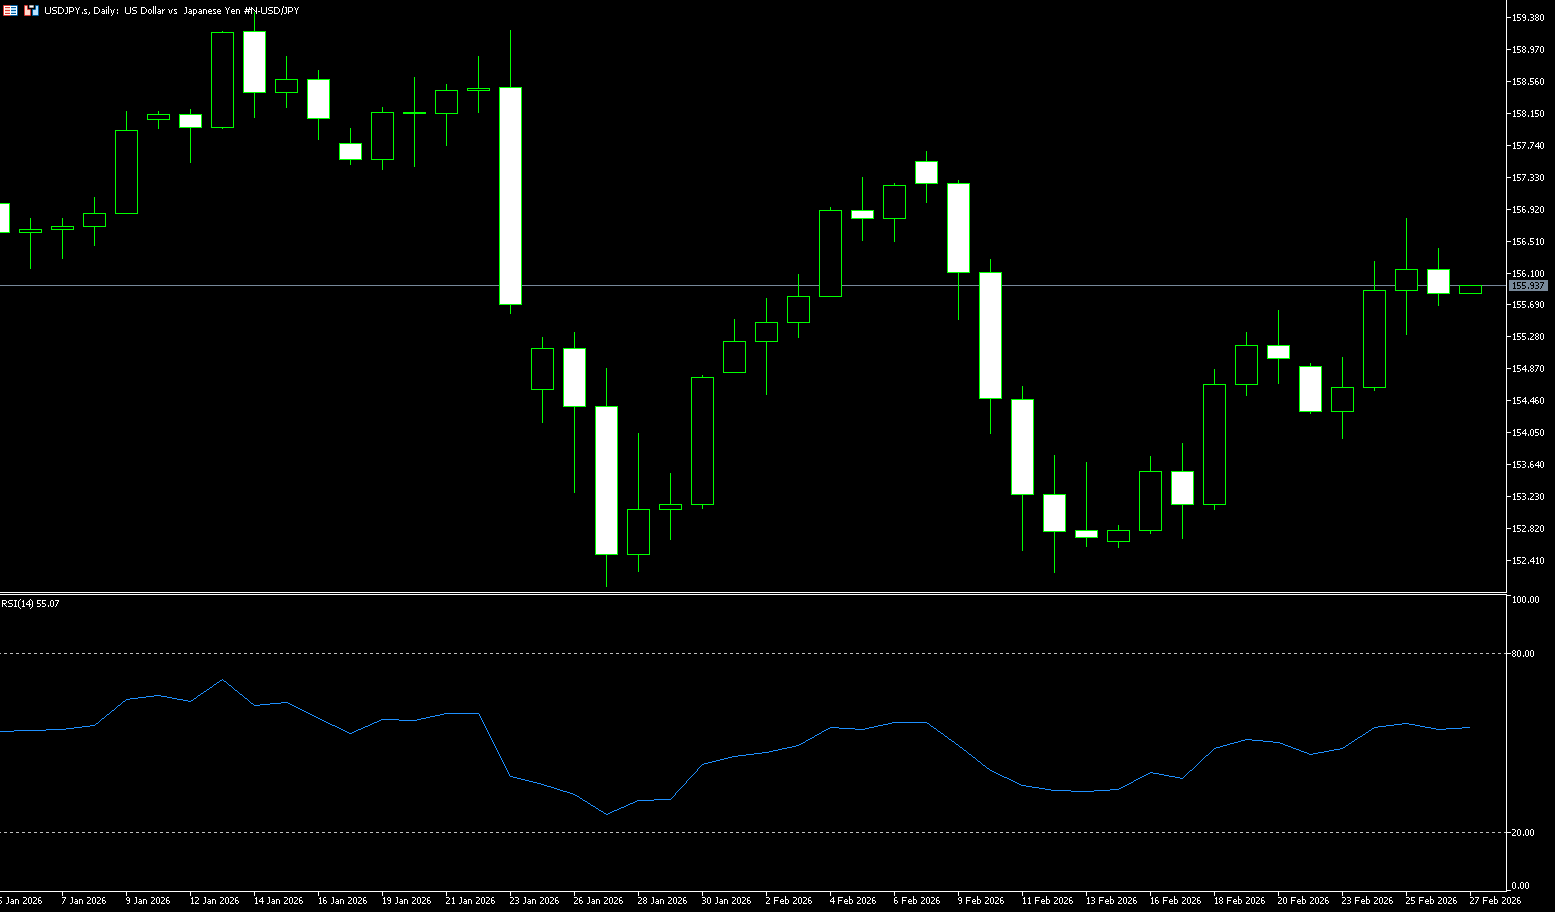
The yen appreciated by more than $156 on Thursday, ending two consecutive days of decline, as comments from Bank of Japan Governor Kazuo Ueda hinted at a possible near-term interest rate hike. Ueda stated that the Bank of Japan would carefully review economic data at its March and April meetings before deciding whether to raise rates. These comments came after the Japanese government nominated two inflationary scholars to the central bank's policy board, further reinforcing market expectations that the Bank of Japan would cautiously proceed with further policy tightening. Prime Minister Sanae Takaichi expressed concern about additional rate hikes during her meeting with Ueda last week. Takaichi is known for her support of stimulus policies, advocating for expansionary fiscal policy and loose monetary policy, which leaves some uncertainty about the pace of the Bank of Japan's normalization, despite expectations of gradual tightening later this year.
From a technical chart perspective, USD/JPY continues its strong trend. The current price is firmly above the 20-day moving average at 155.04. The MACD indicator shows the DIFF and DEA lines maintaining a golden cross above the zero line, indicating that although bulls still dominate the market, short-term momentum has slowed compared to the previous high (around 159.45). This technical pattern is consistent with the fundamentals. On one hand, the divergence in monetary policy expectations between the US and Japan continues to strongly support the US dollar; on the other hand, the sharp fluctuations in the Japanese bond market, especially the surge in ultra-long-term yields, have not effectively boosted the yen, but rather exacerbated the downward pressure on the yen. After breaking through the key level of 156.82 (Wednesday's high), the exchange rate shows an intention to test the psychological level of 157.00. Key short-term support areas to watch are the 20-day moving average at 155.04 and the 155.00 level. Failure to hold above this level will open the door further to the 154.54 (14-day moving average) level.
Today, consider shorting the US dollar around 156.25; Stop loss: 156.40; Target: 155.40; 155.30
EUR/USD
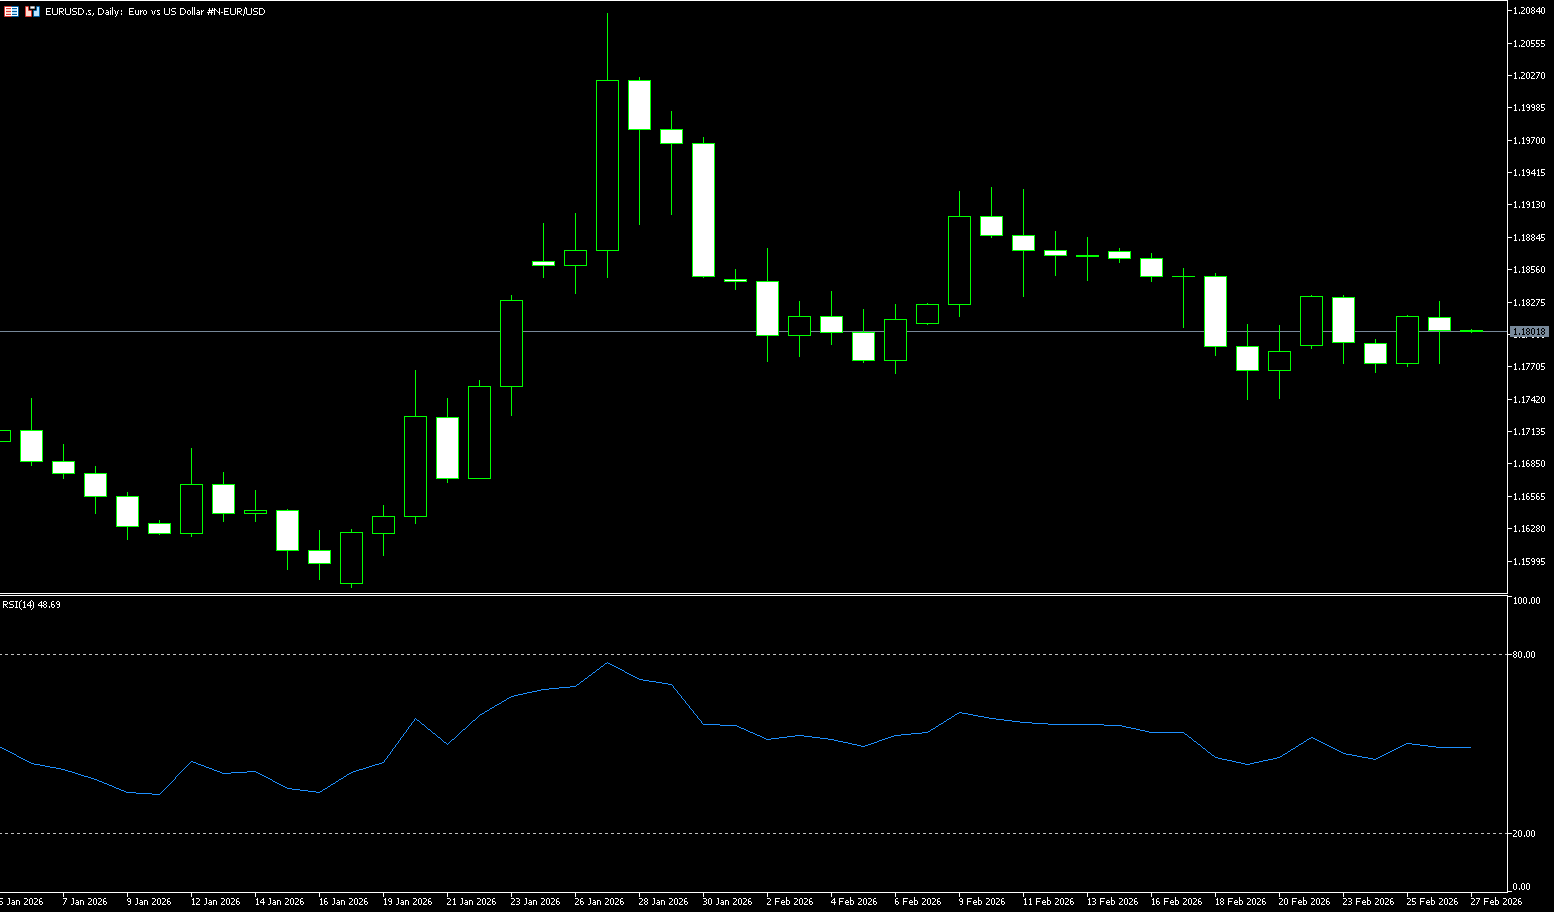
The euro/dollar pair continued its modest gains from the previous day on Thursday, attracting some buyers and rising for the second consecutive day despite a weaker dollar. However, spot prices lacked bullish momentum, trading in the 1.1800-1.1810 range. Despite the hawkish stance of the Federal Reserve, dollar bulls remained defensive due to renewed volatility in President Trump's trade policies. Trump stated in Wednesday's State of the Union address that the administration was working to raise tariffs to 15%. This, combined with underlying bullish sentiment, weakened the safe-haven dollar and became a key driver for the euro/dollar exchange rate. Furthermore, increasing signs that the European Central Bank has stopped cutting interest rates could continue to support the euro and provide support for further gains.
From a technical perspective, the 14-day Relative Strength Index (RSI) is at 61.60, indicating improving positive momentum, but it has not yet entered overbought territory, consistent with the recovery phase from the previous reading below 30. Furthermore, the Moving Average Convergence/Divergence (MACD) line is slightly above its signal line and slightly in positive territory, with a moderately positive histogram further reinforcing the gradual shift towards buyer control rather than an impulsive trend. Meanwhile, the intraday rally was capped near the 10-day simple moving average at {1.1810}. This should serve as a key turning point for intraday traders; a decisive break above this resistance would pave the way for the next upside targets of 1.1877 {last week's high} and 1.1900 {psychological level}. On the downside, immediate support at 1.1754 {65-day simple moving average} protects the path to the psychological level of 1.1700.
Consider going long on the Euro today around 1.1790; Stop loss: 1.1780; Targets: 1.1850, 1.1840
Disclaimer: The information contained herein (1) is proprietary to BCR and/or its content providers; (2) may not be copied or distributed; (3) is not warranted to be accurate, complete or timely; and, (4) does not constitute advice or a recommendation by BCR or its content providers in respect of the investment in financial instruments. Neither BCR or its content providers are responsible for any damages or losses arising from any use of this information. Past performance is no guarantee of future results.
Đảm Bảo Nhiều Hơn


Thông báo về Rủi ro:Các sản phẩm tài chính phái sinh được giao dịch ngoại trường với đòn bẩy, điều này đồng nghĩa với việc chúng mang mức độ rủi ro cao và có khả năng bạn có thể mất toàn bộ khoản đầu tư của mình. Các sản phẩm này không phù hợp cho tất cả các nhà đầu tư. Hãy đảm bảo bạn hiểu rõ mức độ rủi ro và xem xét cẩn thận tình hình tài chính và kinh nghiệm giao dịch của bạn trước khi giao dịch. Tìm kiếm lời khuyên tài chính độc lập nếu cần trước khi mở tài khoản với BCR.
BCR Co Pty Ltd (Số công ty 1975046) là công ty được thành lập theo luật pháp của Quần đảo Virgin thuộc Anh, có trụ sở đăng ký tại Trident Chambers, Wickham’s Cay 1, Road Town, Tortola, British Virgin Islands, và được cấp phép, quản lý bởi Ủy ban Dịch vụ Tài chính Quần đảo Virgin thuộc Anh theo Giấy phép số SIBA/L/19/1122.
Open Bridge Limited (Số công ty 16701394) là công ty được thành lập theo Đạo luật Công ty 2006 và đăng ký tại Anh và xứ Wales, với địa chỉ đăng ký tại Kemp House, 160 City Road, London, City Road, London, England, EC1V 2NX. Tổ chức này chỉ hoạt động như một đơn vị xử lý thanh toán và không cung cấp bất kỳ dịch vụ giao dịch hoặc đầu tư nào.

 English
 简体中文
简体中文
 繁體中文
繁體中文
 Bahasa
Melayu
Bahasa
Melayu
 Tiếng
Việt
Tiếng
Việt
 ไทย
ไทย
 日本語
日本語
 한국어
한국어
 ភាសាខ្មែរ
 español