


0
US Dollar Index
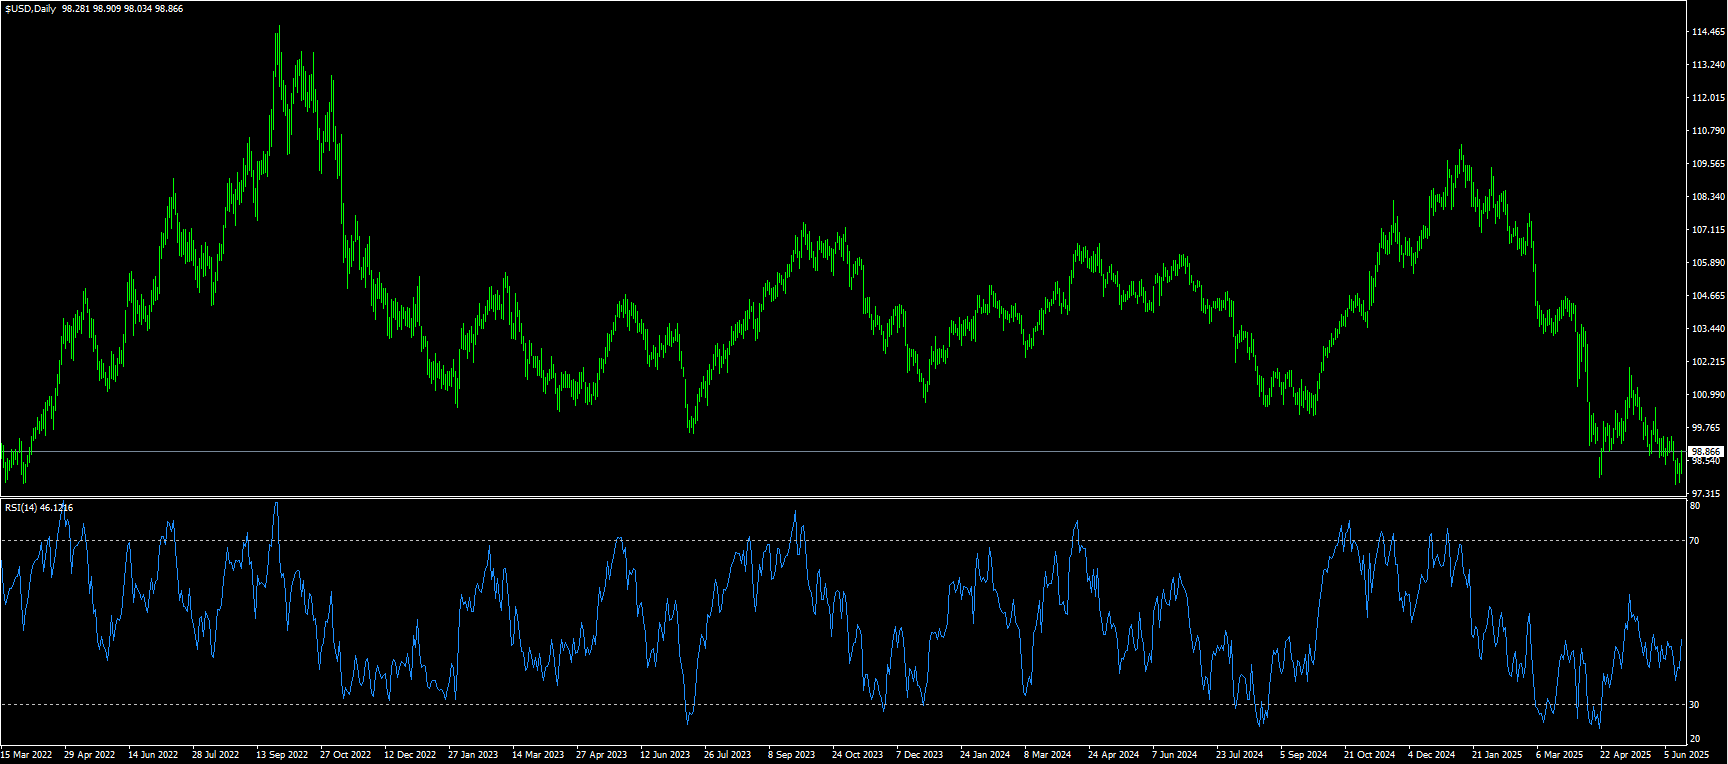
The US dollar index rebounded above 98.70 on Tuesday, reversing losses from the previous session, as ongoing tensions in the Middle East boosted demand for safe-haven currencies. The gains came as President Donald Trump called for a full withdrawal from Tehran, while Israel continued to carry out air strikes and Trump reiterated that Iran should sign his proposed nuclear deal. Meanwhile, investors turned their attention to this week's Federal Reserve policy decision, with the central bank widely expected to keep interest rates unchanged. The market focus will be on forward guidance on the path of interest rates, especially as traders reduce expectations for further rate cuts this year. Inflation concerns due to rising oil prices and ongoing trade uncertainty are also weighing on market sentiment. The dollar rose broadly, rising against the yen for the third consecutive trading day ahead of the Bank of Japan's policy announcement.
Against the backdrop of rising global uncertainty, the US dollar's role as a traditional safe-haven currency has attracted attention. Although the US dollar has generally risen in recent trading, the market is cautious about the sustainability of this trend. Daily momentum shows a slight bearish bias, while the 14-day relative strength index (RSI) of technical indicators shows signs of recovering from near oversold conditions. The technical downtrend of the US dollar index remains intact and the outlook remains negative. Resistance is at 99.00{round mark}, and 99.50. Support is at 98.00{round mark}, and if it breaks, it will test 97.60 (recent low) and 97.00{round mark} area.
Today, consider shorting the US dollar index around 98.90, stop loss: 99.00, target: 98.40, 97.30
WTI spot crude oil
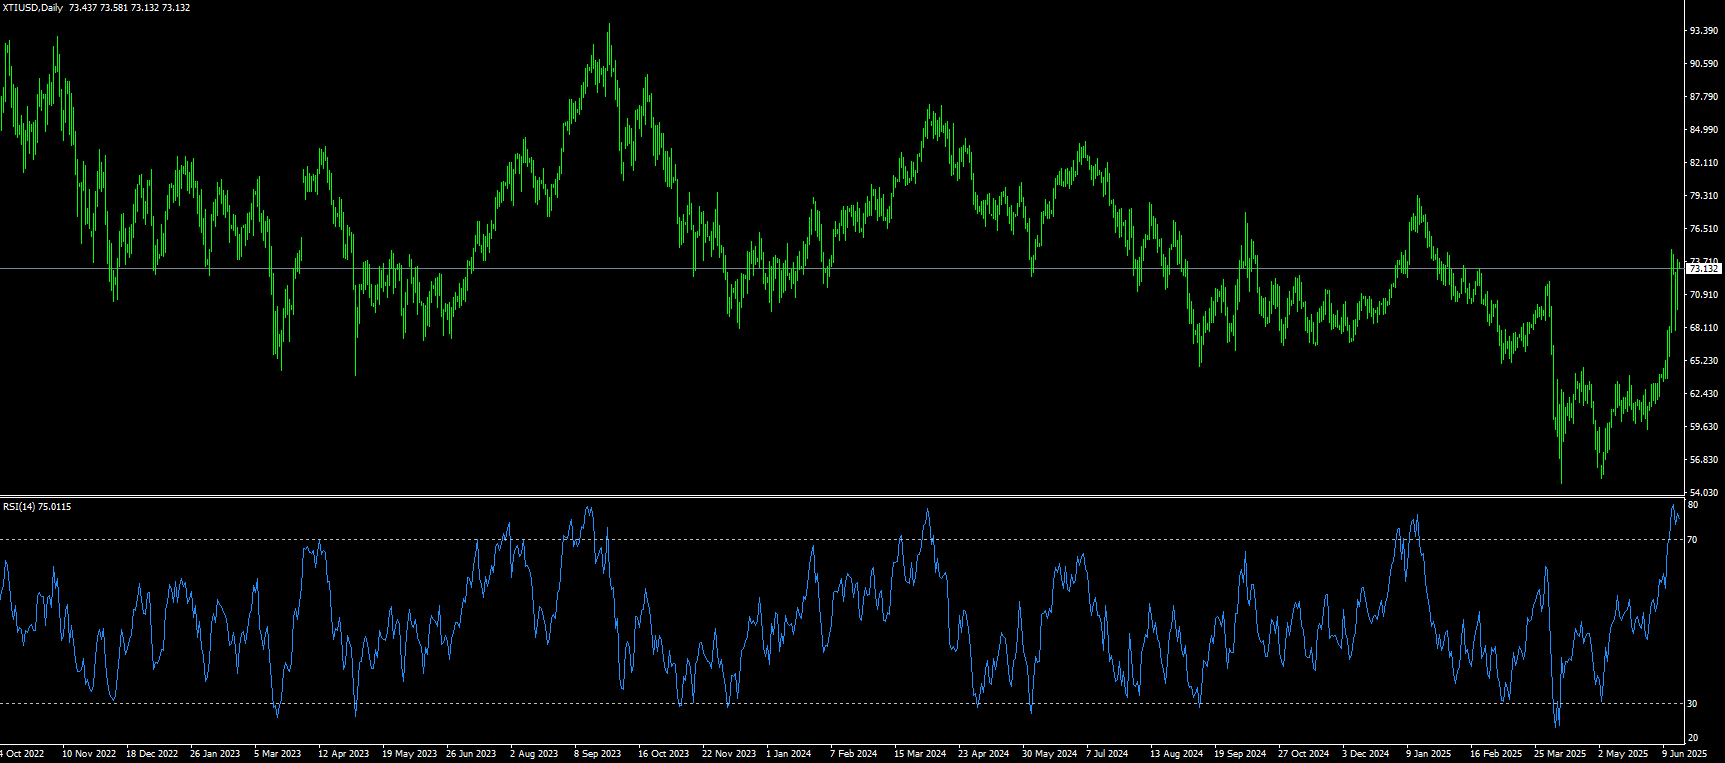
WTI crude oil rose more than 5.0% to around $73.66 per barrel on Tuesday, as Israel vowed to launch more strikes on Iran, raising market concerns that potential escalation could disrupt energy flows and important trade routes. U.S. President Donald Trump called for the withdrawal of Tehran on Monday after Israel stepped up air strikes on the Iranian capital, including on the state media building. These attacks continued despite reports that Iran was eager to end hostilities and resume negotiations on its nuclear program. The news eased some concerns about the conflict, leading to a volatile trading session on Monday, with oil prices fluctuating in an $8 range before closing lower. At the same time, traders are also dealing with the prospect of new tariffs that President Trump may impose in the coming weeks and the prospect of OPEC+ rapidly increasing production quotas, which may have a significant impact on the oil market.
From the daily chart, the price of US WTI crude oil has broken through the range of shocks and consolidation since mid-May. The daily chart shows that oil prices are currently steadily standing above the 10-day {66.42} and 20-day {63.90} simple moving averages, indicating a rebound in bullish sentiment. In terms of technical indicators, the 14-day relative strength index (RSI) is around 74.50, and the MACD indicator shows a golden cross trend, indicating that momentum is increasing. If it can be stabilized above $70.00 {integer mark} in the future, the next pressure level will point to $74.00 {integer mark}; a break will point to last week's high of $74.74. The support level below is concerned about the loss of the psychological mark of $70.00. Oil prices will continue to fall below $68.28 {200-day simple moving average}, and there is always the possibility of a correction to $67.07 {50.0% Fibonacci rebound from $79.37 to $54.78}.
Consider going long WTI crude oil around 73.45 today, stop loss: 73.30, target: 75.00, 75.50
Spot gold
Gold rose to just above about $3,400 an ounce on Tuesday as continued tensions in the Middle East drove demand for safe-haven assets. President Trump urged an immediate evacuation of Tehran after Israel stepped up its bombing of Iran, targeting Iran's elite military forces and state-owned media buildings. On Monday, gold prices fell 1.4%, the biggest single-day drop in a month, as Iran reportedly sought to ease hostilities with Israel and was willing to resume nuclear talks with the United States as long as Washington did not participate in Israel's attacks. On the economic front, investors will be watching May retail sales and industrial production data due later today to assess the strength of the U.S. economy. Markets are also focused on the Federal Reserve's two-day policy meeting, which will end on Wednesday. Given that the Fed is widely expected to keep interest rates unchanged, the market is eager for signals of potential rate cuts in the coming months.
From a technical perspective, gold is testing key support areas. A break below the $3,350 mark and the 14-day simple moving average of $3,355 could trigger fresh buying; if this level is broken, further declines to the $3,300 {round mark}, and $3,301 {50-day simple moving average} area levels will be tested. On the upside, resistance is close to the round mark of $3,400, and if bullish momentum resumes, initial static resistance is around the $3,450, and $3,452 {early week high} area. The next level of all-time highs of $3,500.20 is still possible. For now, the forecast maintains a cautiously bullish tone, provided that the $3,300-3,301 support area remains solid and the Fed avoids turning hawkish.
Consider going long on gold near $3,384 today, stop loss: 3,380, target: 3,410, 3,415

AUD/USD
The Australian dollar fell slightly to around $0.6476 on Tuesday as investors continued to weigh ongoing geopolitical tensions. U.S. President Trump called for an evacuation of Tehran after Israel intensified air strikes on the Iranian capital, including on state media facilities. These attacks came despite reports that Iran was eager to de-escalate and resume nuclear talks. In Australia, further interest rate cuts are expected in July, following two cuts earlier this year - moves welcomed by financially strapped households that are still recovering from the effects of high inflation in recent years. If the RBA cuts interest rates by 25 basis points at the board meeting on July 8, the cash rate will fall to 3.60%, which is the level not seen since April 2023.
AUD/USD was trading around 0.6480 on Tuesday. The bullish bias remains as technical analysis on the daily chart suggests that the pair is still in an uptrend phase. Moreover, the 14-day relative strength index (RSI) of the technical indicator remains above 50, indicating that the bullish outlook remains. Moreover, the pair is above the 30-day simple moving average of 0.6460, indicating strong short-term price momentum. The pair may target the seven-month high of 0.6552 reached on June 16. A break above this level may support the pair to target the 0.6600 round number mark, which could see an eight-month high of 0.6687, followed by the 0.6700 mark. On the downside, AUD/USD may test the 30-day simple moving average of 0.6460 and the early week low of 0.6466 area. Then comes the 0.6400 level.
Today, consider going long on AUD around 0.6460, stop loss: 0.6450, target: 0.6510, 0.6520

GBP/USD
GBP/USD lacks a clear intraday directional bias and oscillates around the 1.3450 level during Tuesday's session, keeping a wait-and-see attitude ahead of key data/central bank event risk releases to prepare for the next directional move. UK consumer inflation data will be released on Wednesday, followed by a key Bank of England policy meeting on Thursday, which will affect the pound. In addition, the Fed's interest rate decision on Wednesday will boost the dollar in the short term and provide some meaningful momentum for the GBP/USD pair. In addition, the growing geopolitical tensions in the Middle East also support the dollar's relative safe-haven status and limit the upside of the GBP/USD pair.
Despite breaking through the upper limit and pushing to a new multi-year high, the bulls have not yet been able to fully declare victory. GBP may face a new technical correction, which will make it possible for the price action to fall back to the still rising trendline around 1.2100. Technically, GBP/USD is still biased to the upside after rebounding from 1.3400{round mark}, which pushed the exchange rate back above the 26-day simple moving average of 1.3487 to the psychological level of 1.3500. The 14-day relative strength index (RSI) of the daily chart shows that bulls are in the lead, but the exchange rate may encounter resistance as the RSI fails to make a new high. On the upside, the first resistance level is the 26-day simple moving average of 1.3487, and the psychological level of 1.3500. On the other hand, the first support level for GBP/USD is the round mark of 1.3400, followed by the low of April 20 at 1.3334.
Consider going long GBP around 1.3410 today, Stop Loss: 1.3400, Target: 1.3460 , 1.3470

USD/JPY
The Bank of Japan announced on Tuesday that it would maintain its short-term interest rate target in the range of 0.4%-0.5% after concluding a two-day monetary policy review meeting. The decision was expected. The Bank of Japan extended the pause in its rate hike cycle to a third meeting, following a 25 basis point hike in January. The yen maintained its negative bias on the day and showed little reaction to the BoJ's decision. However, traders seemed reluctant to make aggressive directional bets, choosing to wait for more clues on the BoJ's policy outlook. Therefore, the focus will be on the post-meeting press conference, where Kazuo Ueda's comments should affect the yen. Meanwhile, market expectations that the BoJ may delay rate hikes until the first quarter of next year due to uncertainty over US tariff policy could weaken the yen.
From a technical perspective, continued strength and acceptance above the 145.00 psychological mark would confirm a bullish breakout through the multi-week trading range. Considering that the oscillators on the daily chart have just started to gain positive momentum, USD/JPY could surpass the monthly high, around the 145.45 area, and aim to conquer the 146.00 round number mark. The momentum could extend further to the 146.25-146.30 area, or the high of May 29. On the other hand, any corrective decline seems to now find some support around the 144.50-144.45 area, close to the 144.00 mark. A successful breakout of the latter could drag USD/JPY to the intermediate support of 143.55-143.50, and then to the 143.00 round number mark and last Friday's low, around the 142.80-142.75 area.
Consider shorting the dollar around 145.50 today, stop loss: 145.70, target: 144.50, 144.20

EUR/USD
EUR/USD fell to just below 1.1500 during the Asian session on Tuesday. The pair held its position near 1.1632, its highest since October 2021, hit on June 12. The euro gained support as concerns about rising tensions between Israel and Iran eased. The euro also gained support in trading against other currencies, mainly due to the divergence in policy paths between the European Central Bank and the U.S. Federal Reserve System. The probability of a rate cut by the European Central Bank in September fell to 50%, down from 60%, and the market expects the deposit rate to be 1.79% by the end of 2025. ECB policymaker Joachim Nagel supported maintaining policy flexibility, pointing to a complex global backdrop. Meanwhile, traders expect the Federal Reserve to keep interest rates unchanged on Wednesday. Investors will focus on updated economic forecasts and bitmaps as markets continue to price in a rate cut as early as September.
Hostilities between Israel and Iran began, which boosted the dollar's appeal. However, while both sides will continue to exchange fire and the risk of regional conflict has slightly decreased, the improvement in risk appetite has supported the euro. The uptrend of EUR/USD remains intact, although it faces strong resistance at 1.1600. Buyers failed to decisively break through the latter, opening the door for a pullback. The 14-day relative strength index (RSI), a technical indicator on the daily chart, shows a lack of commitment from buyers, and although the RSI is bullish, it is falling back towards the neutral line. If EUR/USD falls below 1.1500, the next target will be the trend channel support, which is closely followed, around the 1.1435-1.1430 area. After that is the 1.1400 level. On the other hand, if EUR/USD stabilizes above 1.1500, buyers may push the exchange rate to the 1.1550 mark. Next is 1.1600, a psychological market mark.
Today, you can consider going long on Euro around 1.1465, stop loss: 1.1450, target: 1.1520, 1.1530

Disclaimer: The information contained herein (1) is proprietary to BCR and/or its content providers; (2) may not be copied or distributed; (3) is not warranted to be accurate, complete or timely; and, (4) does not constitute advice or a recommendation by BCR or its content providers in respect of the investment in financial instruments. Neither BCR or its content providers are responsible for any damages or losses arising from any use of this information. Past performance is no guarantee of future results.
Lebih Liputan


Pendedahan Risiko:Instrumen derivatif diniagakan di luar bursa dengan margin, yang bermakna ia membawa tahap risiko yang tinggi dan terdapat kemungkinan anda boleh kehilangan seluruh pelaburan anda. Produk-produk ini tidak sesuai untuk semua pelabur. Pastikan anda memahami sepenuhnya risiko dan pertimbangkan dengan teliti keadaan kewangan dan pengalaman dagangan anda sebelum berdagang. Cari nasihat kewangan bebas jika perlu sebelum membuka akaun dengan BCR.

 English
 简体中文
简体中文
 繁體中文
繁體中文
 Bahasa
Melayu
Bahasa
Melayu
 Tiếng
Việt
Tiếng
Việt
 ไทย
ไทย
 日本語
日本語
 한국어
한국어
 ភាសាខ្មែរ
 español