


0
US Dollar Index
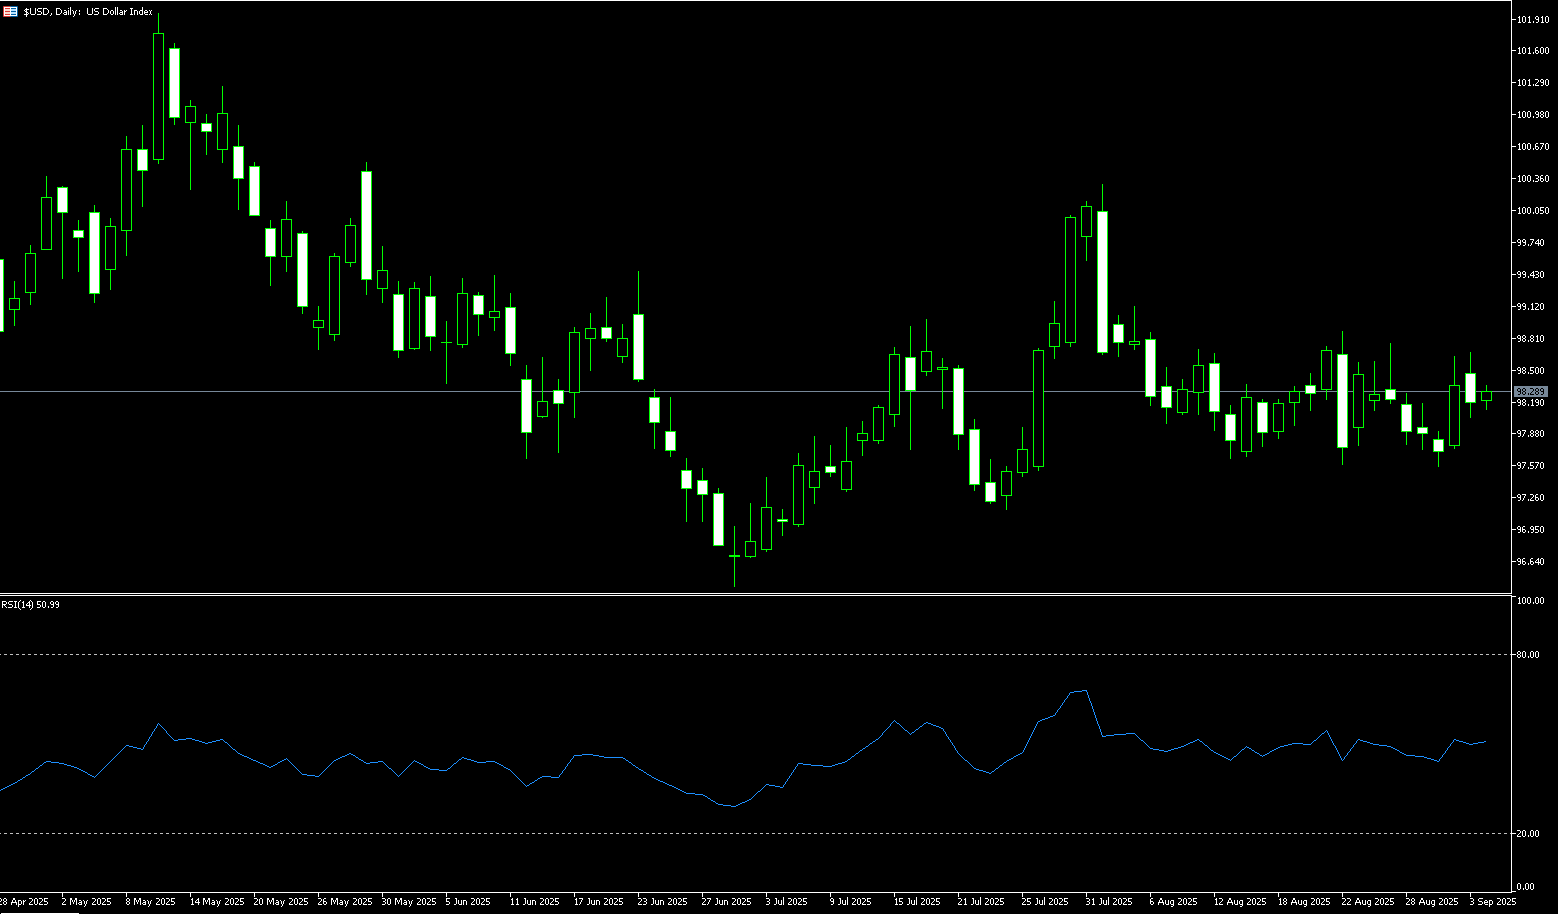
Last weekend, the US Department of Commerce released August PCE inflation data, showing that the headline PCE index rose to 2.7% year-on-year, while the core PCE index remained stable at 2.9%, both in line with market expectations. After a sharp rebound from last week's low of 97.21 to a near three-week high of 98.60, the US dollar index retreated to around 98.18 before the market closed last week. Despite persistent inflation and stronger-than-expected consumer spending, the US dollar index weakened slightly. The index retreated from its intraday high of 98.60, reflecting market hesitation around key technical levels. Fundamentally, Federal Reserve officials signaled a cautious approach to rate cuts, prioritizing data. Macroeconomic data showcased a combination of resilient growth and sticky inflation, driving the 10-year US Treasury yield back to around 4.2%. This convergence of macroeconomic and interest rate factors has stabilized the US dollar index above 98 in the short term, shifting its focus upward. However, any potential for a second wave of gains depends on the validation of a comprehensive package of inflation and labor market indicators. On the other hand, as long as the Federal Reserve maintains a cautious easing stance and inflation remains above target, the US dollar is likely to find support. However, for now, dollar bulls may need stronger data—or new policy signals—to definitively break through resistance.
The daily chart shows that the US dollar index has been fluctuating upward since stabilizing near the low of 96.22 on the 17th of this month, and is currently retesting the Bollinger Band 97.69. It has effectively reclaimed the Bollinger Band 97.69 and the 38.2% Fibonacci retracement level of 97.76 (the 100.26 to 96.22 high), and is now heading towards resistance at 98.60 (last Thursday's high) and 98.63 (the upper Bollinger Band line). A daily close above these levels would increase the probability of a move towards 99.00 (the round number mark) and 99.05 (the 134-day simple moving average). The breakout point is 99.30 {76.4% Fibonacci rebound level}. In terms of technical indicators, MACD provides a volume lead for the secondary impact of prices. RSI (14) is slightly above the center and has not reached the overbought zone. Combined with the mild convergence of the Bollinger Band opening, it reflects the mean reversion characteristics of "rising in the oscillation". In addition, if the US dollar index does not rise but falls, and retreats below the support below the 98.00 mark, it will retest the combined support of 97.69 of the Bollinger Band center axis and 97.76 {38.2% Fibonacci rebound level}, and then 97.17 {23.6% Fibonacci rebound level}. At that time, the market will switch from "retracement of the upward channel" to "box oscillation".
Consider shorting the US Dollar Index at 98.30 today. Stop-loss: 98.42 Targets: 97.90, 97.80
WTI Spot Crude Oil
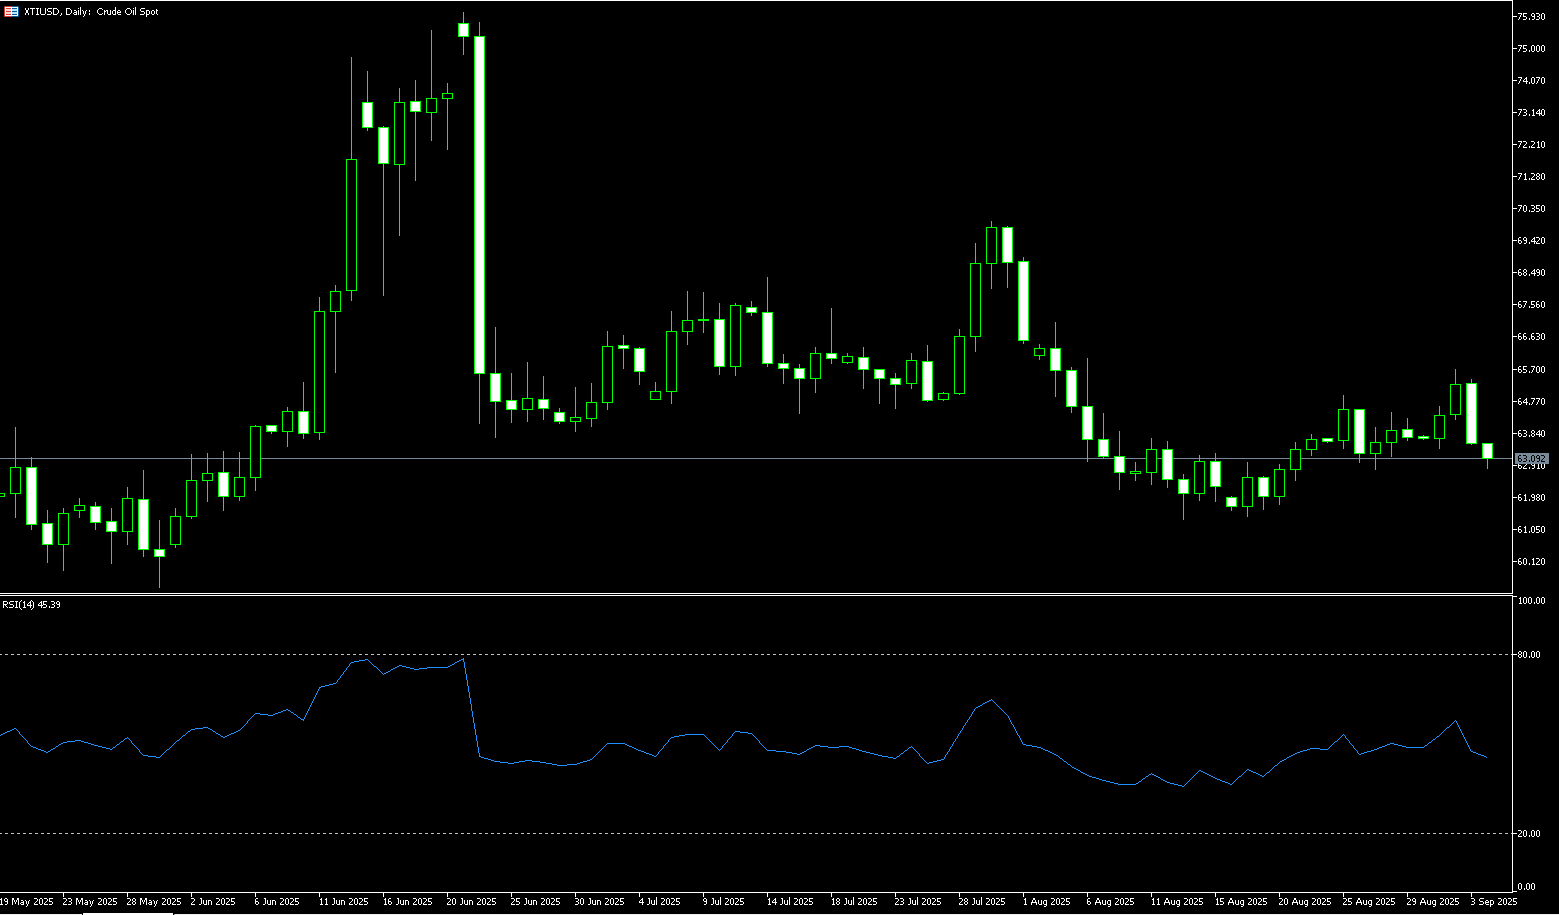
Last week, WTI crude oil rose to $65.20 per barrel, near a three-week high and poised for its strongest weekly gain since early June. Both Brent and WTI rose over 4%. Ukraine's continued attacks on Russian energy facilities have forced Moscow to restrict fuel exports and nearly cut crude oil production. Meanwhile, strong US economic data and news of the resumption of exports from the Kurdish region have somewhat limited gains. Russian oil is under pressure from the conflict, raising supply concerns. US President Trump urged Turkish President Recep Tayyip Erdogan to halt imports from Russia, tightening restrictions on Moscow in response to the Ukrainian conflict. Ukrainian attacks on Russian energy infrastructure early last week also prompted Moscow to restrict fuel exports and consider cutting crude oil production. Russian Deputy Prime Minister Alexander Novak announced an extension of the partial diesel export ban until the end of the year and an extension of the gasoline export ban, as reduced refining capacity has led to shortages of certain fuel grades. The resumption of some Kurdish oil exports and the dampening of expectations for US interest rate cuts may support economic growth and boost demand, but also increase further downside risks.
The current rise in oil prices reflects both supply concerns stemming from geopolitical conflicts and fundamental support from declining US inventories. However, stronger-than-expected US economic data suggests the Federal Reserve may delay rate cuts, dampening demand expectations. Future oil price trends will continue to revolve around two core factors: tight supply and monetary policy. On the daily chart, WTI crude oil prices have broken through the upper limit of their previous range and are temporarily trading above the 5-day (64.11) and 50-day (64.05) simple moving averages, technically indicating strengthening bullish momentum. The 5-day and 50-day moving averages have formed a short-term bullish "golden cross" pattern, while the MACD indicator is diverging upward, suggesting a continued upward trend. However, there is strong resistance above $65.61 (the 50.0% Fibonacci retracement level from $70.02 to $61.20) and $66.53 (the 200-day moving average). If it breaks through, oil prices could see consolidation between $67.94 (the 76.4% Fibonacci retracement level) and $68.00. On the downside, the 5-day simple moving average (64.07) and the 50-day simple moving average (64.04) should be watched. A break below this level could lead to a test of the $63.28 (the 23.6% Fibonacci retracement level) and the $63.00 support level.
Consider going long on crude oil at $64.80 today. Stop-loss: $64.60, target: $66.30, $66.50.
Spot Gold
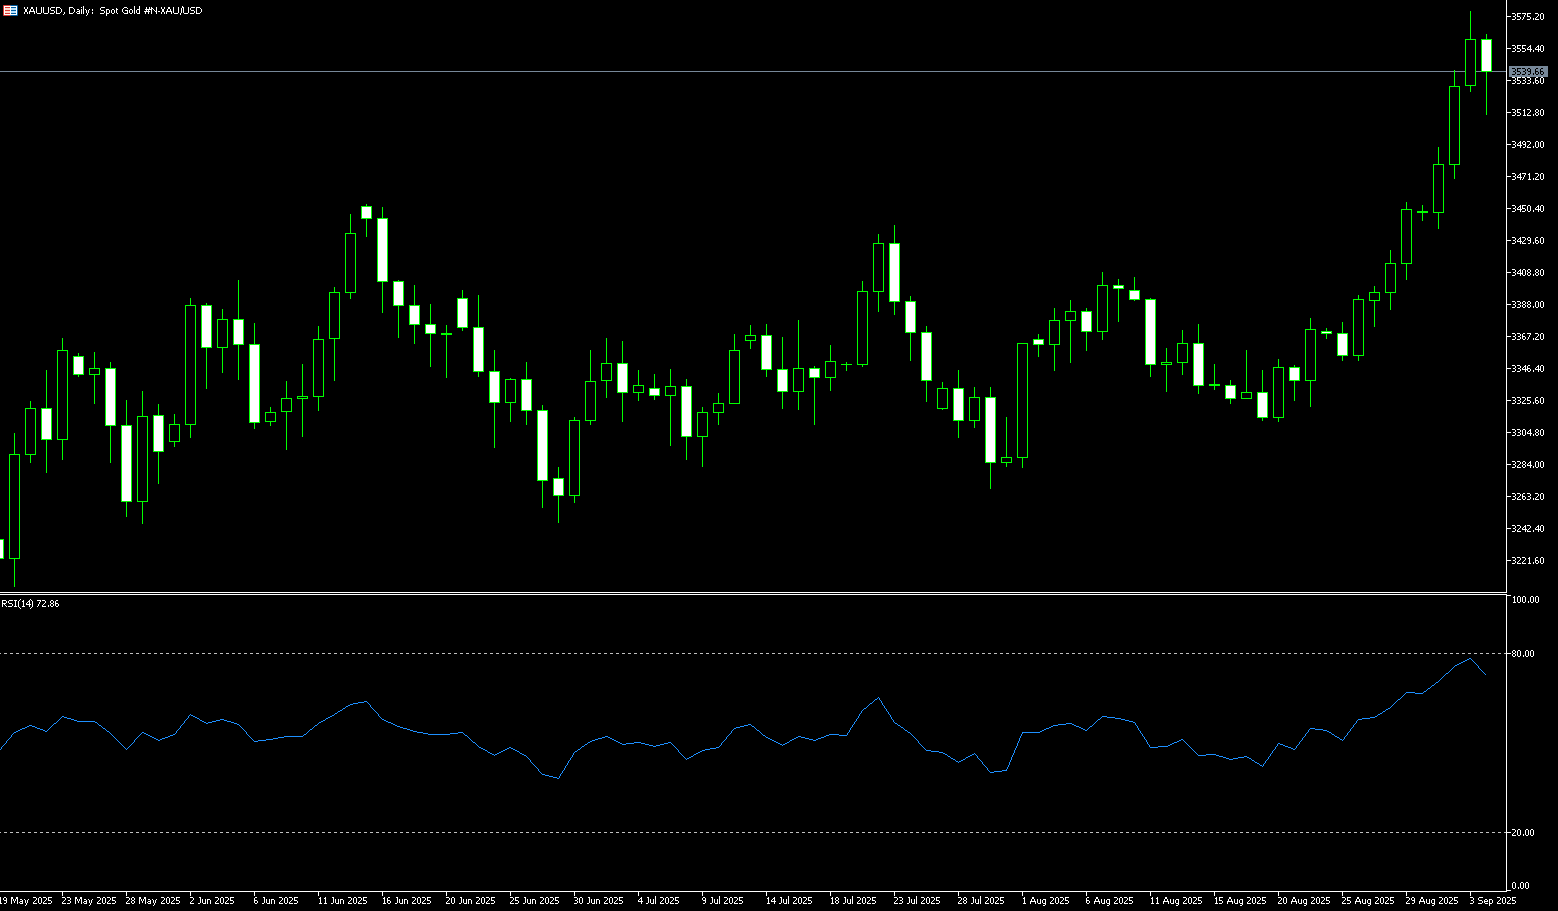
Gold continued its upward trend heading into the weekend, breaking out of its recent range of $3,760-3,720 as the US dollar retreated after the latest personal consumption expenditures inflation report failed to offer any new upside surprises. Gold prices reached a high of around $3,784, hovering below the all-time high of $3,791 reached earlier this week. The metal is on track for its sixth consecutive week of gains, supported by safe-haven demand amidst rising trade tensions and geopolitical risks. After hitting a new all-time high of $3,791.20 last week, spot gold faced some selling pressure, reaching a weekly low of $3,717.50 despite a significant upward revision to US second-quarter GDP growth. Gold prices have maintained their position above the $3,700 per ounce mark. Meanwhile, bets that the Federal Reserve (Fed) will further lower borrowing costs in October and December have prompted profit-taking in the US dollar following its recent rebound to a three-week high. This, in turn, is seen as a tailwind for non-yielding gold. Furthermore, concerns about the potential economic impact of US President Trump's new round of tariffs on a wide range of commodities, as well as growing geopolitical tensions, have become further factors favoring safe-haven gold.
Spot gold hit a new all-time high of $3,791.20 last week. Currently teetering above $3,750, the daily chart has repeatedly touched the 5-day simple moving average (3749.80), with each rebound weaker than the last. As $3,750 is a key level and a recent target for bulls, if it is breached by bears again, gold prices will likely seek support near last week's low of $3,717.50 and the $3,700.00 round-figure mark. If continued weakness leads to a break below the $3,700 level, it could trigger some technical selling and pave the way for a continuation of this week's pullback from all-time highs. A subsequent decline could drag gold prices down to the intermediate support level of $3,650 and further down to the $3,632 area (September 19 low). Meanwhile, gold needs to break above the descending trendline near $3,752.00 and the 5-day simple moving average of $3,749.80 for bulls to maintain control, acting as a strong resistance for gold prices. A sustained breakout could set the stage for a challenge of the all-time high of $3,791.20 reached on Tuesday. Any follow-through buying and acceptance above the $3,800 mark would be seen as a new trigger for gold/USD bulls, which in turn should pave the way for the resumption of the favorable uptrend witnessed over the past month or so.
Consider going long on gold at 3,755 today, with a stop-loss at 3,750 and targets at 3,780 and 3,790.
AUD/USD
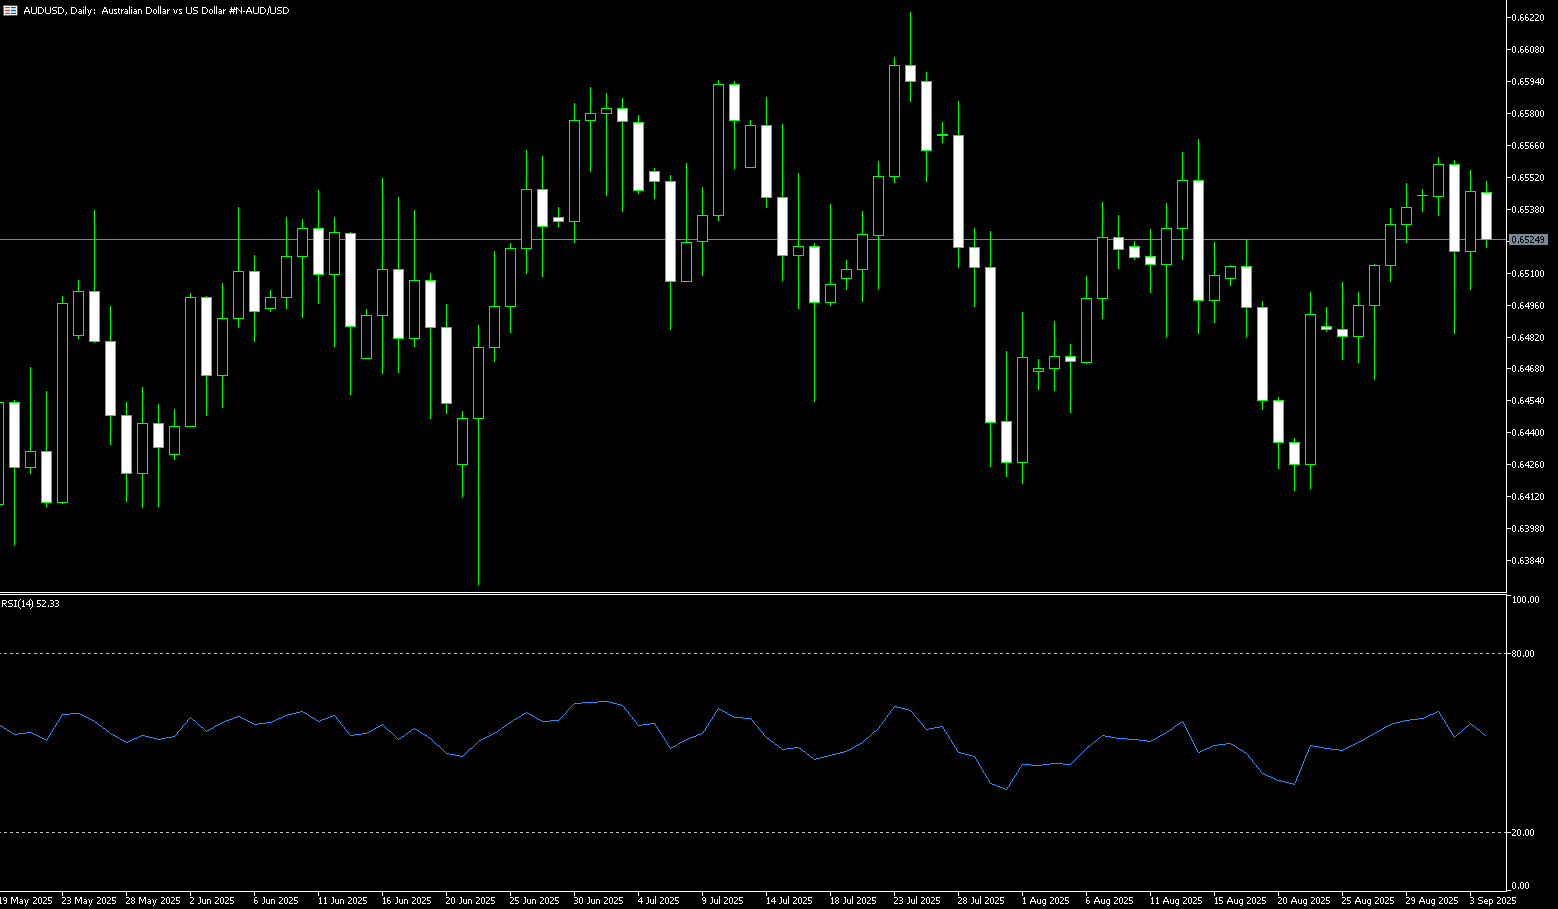
The US dollar strengthened after stronger-than-expected US data, dampening hopes for further Federal Reserve rate cuts. Late last week, the Australian dollar fell sharply against the US dollar, extending losses to its lowest level in nearly three weeks at 0.6526. This decline occurred after a broad rally in the US dollar following a series of stronger-than-expected US economic data, boosting confidence in the resilience of the world's largest economy and dampening risk sentiment. Market sentiment was also impacted by US President Trump's announcement of new tariffs. Domestically, recent data showed that Australia's monthly consumer price index (CPI) rose 3.0% year-on-year in August, compared to a 2.8% increase in July. ASX 30-day interbank cash rate futures indicate that the market is currently pricing in only a 4% chance of a September rate cut. According to Reuters, the probability of a rate cut by the Reserve Bank of Australia (RBA) at its November meeting has fallen from nearly 70% before the data release to 50%. After a sharp decline heading into the weekend, the Australian Dollar (AUD/USD) has temporarily stabilized.
After hitting an 11-month high of 0.6707 last week, AUD/USD plunged sharply, falling below the psychological level of 0.6600 to a near three-week low of 0.6526. Technical analysis on the daily chart shows that the pair is currently trading below its short-term moving averages (9-day, 0.6601) and 20-day, 0.6593 simple moving averages, indicating weak short-term price momentum. Furthermore, the 14-day relative strength index (RSI) is below the 50-4480 level, indicating a strong bearish bias. This strengthens the bearish bias. On the downside, AUD/USD faces initial support at the 0.6500 round-figure mark and the monthly low of 0.6483 set on September 2. A break below these levels would push the pair towards the 150-day simple moving average, which is at 0.6450. Initial resistance is the 20-day simple moving average at 0.6593, followed by the psychologically important 0.6600 level. A break above these levels would improve short- and medium-term price momentum and bring the pair closer to the 11-month high of 0.6707 reached on September 17.
Consider a long position on the Australian dollar at 0.6533 today, with a stop-loss at 0.6520 and targets at 0.6590 and 0.6580.
GBP/USD
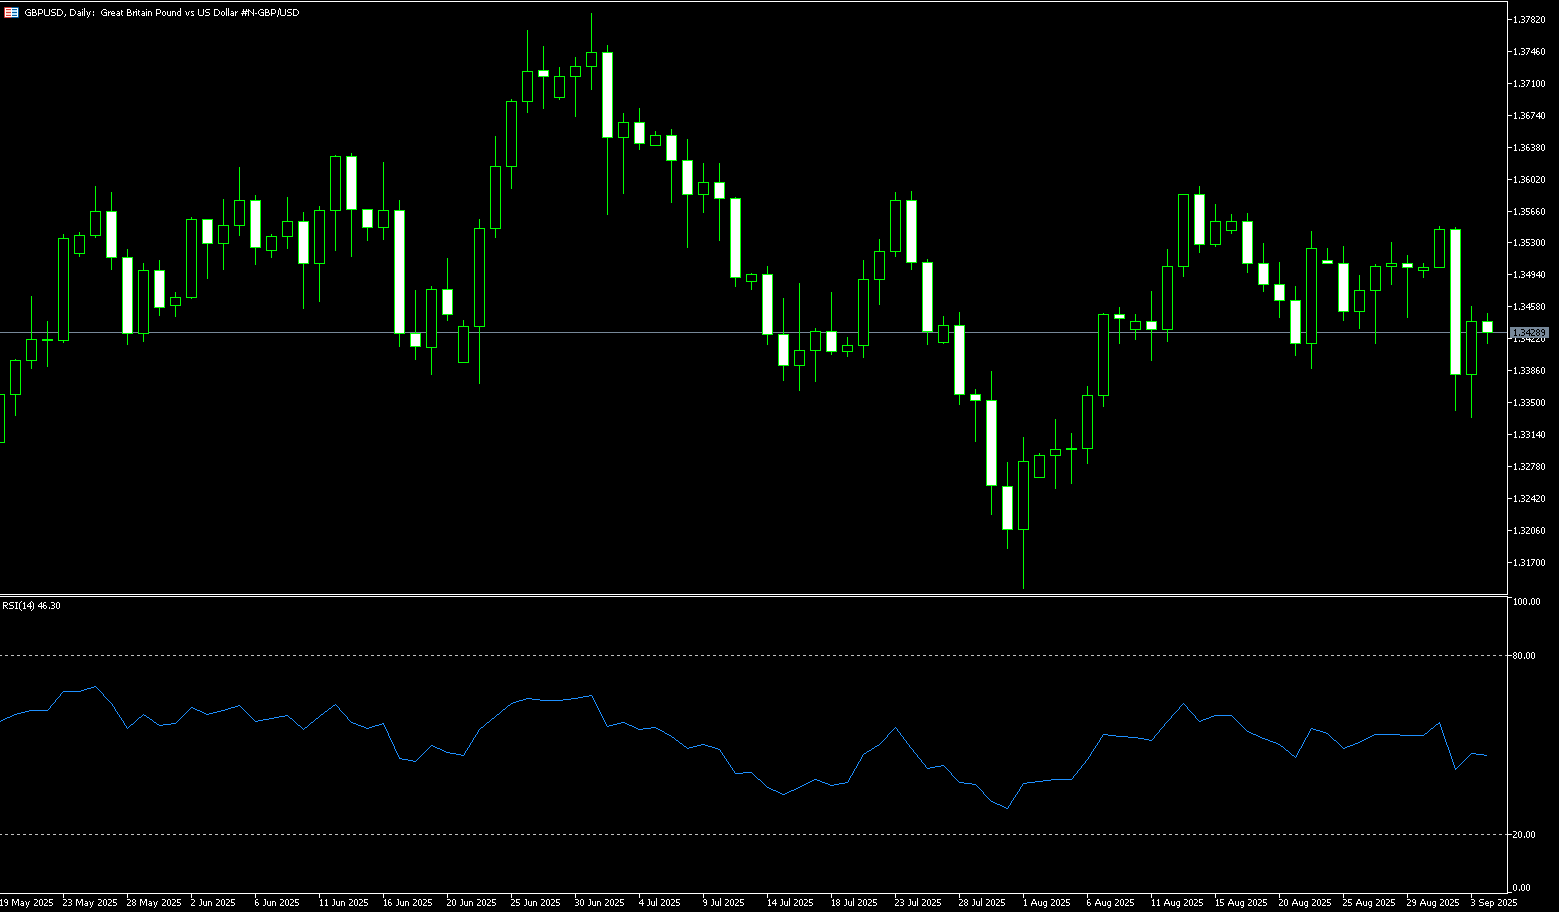
The British pound retreated to a near seven-week low of 1.3324 late last week. GBP/USD is facing selling pressure. The dollar retreated after the release of the PCE data; GBP/USD is now trading above 1.3400. In the US, a series of upbeat macroeconomic data eased recession fears. To make matters worse, US President Trump rattled the market with a new round of tariffs. President Trump's announcement of new tariffs on heavy trucks, brand-name pharmaceuticals, and kitchen cabinets has reignited concerns about global trade uncertainty and dampened risk appetite. Meanwhile, data from the U.S. Bureau of Economic Analysis revealed that second-quarter gross domestic product (GDP) growth was stronger than previously estimated. This good news, coupled with solid growth in durable goods orders in August and an unexpected drop in weekly jobless claims, has prompted investors to scale back bets on a Federal Reserve rate cut and provided a fresh boost to the dollar. Last week, the Fed cut its first interest rate at its monetary policy meeting. According to the CME FedWatch tool, the probability of a 50 basis point rate cut by the end of the year has fallen from 78.6% a week ago to 62%.
GBP/USD stabilized last week after two days of sharp declines. The dollar retreated after the release of the PCE data; GBP/USD re-entered and is now hovering above 1.3400. Furthermore, the pound may find support from inflation risks in the UK and the uncertain Bank of England's policy stance, potentially limiting its downside. The daily chart suggests GBP/USD may remain vulnerable. The pair weakened after breaking below an ascending channel pattern, leading to a bearish reversal. The short-term trend is bearish as the pair remains below the 5-day (1.3447) and 120-day (1.3457) simple moving averages. Furthermore, a bearish "death cross" pattern has formed between the 5-day and 120-day moving averages, while the 14-day relative strength index (RSI) is in negative territory near 43.00. If the RSI holds below this level, renewed bearish momentum will emerge. Looking down, the first key support level lies at 1.3300. A break below this level could extend the decline to 1.3255 (the 170-day simple moving average) and the psychologically important 1.3200 level. Looking up, 1.3413 (last Friday's high) becomes the first resistance area, followed by 1.3467 (September 25 high). Key resistance lies at the psychologically important 1.3500 level, a break of which could point to 1.3537 (last week's high).
Today, consider going long on the British pound at 1.3390. Stop-loss: 1.3380. Targets: 1.3450, 1.3460.
USD/JPY
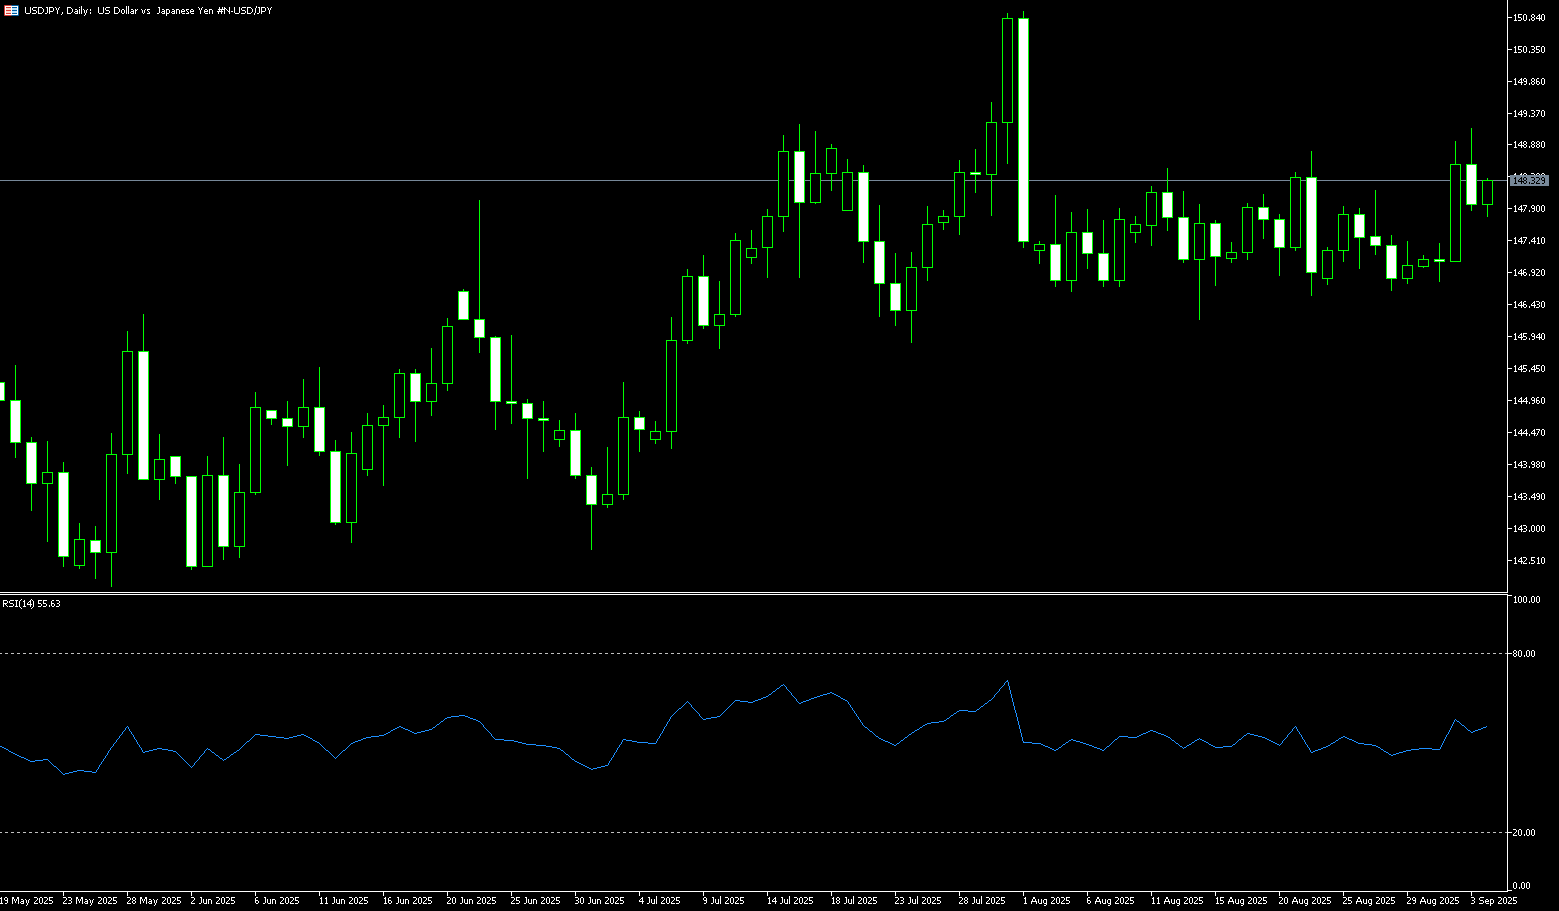
Following a series of stronger-than-expected US economic data, USD/JPY surged to a near two-month high of 149.87 in late last week, approaching the psychological 150 level. The driving force behind the exchange rate is US interest rates, particularly at the front end of the yield curve, which has been closely correlated with the exchange rate over the past two weeks. Market pricing in a Federal Reserve rate cut is driving USD/JPY movements. Meanwhile, barring shocking results from recent Japanese data, US data is likely to be the primary catalyst for USD/JPY volatility. In reality, the US calendar is more influential on USD/JPY—but this is primarily due to the data's close correlation with short-term US Treasury yields, rather than necessarily the core PCE deflator itself. While PCE is the Fed's preferred core inflation indicator, it rarely offers significant surprises in the current environment. Regardless of the details, the market will be closely watching the speeches scheduled by Fed officials following the data release. If the Fed intends to convey a message, it is more likely to be conveyed through these speeches than through prior appearances.
As market expectations for a Federal Reserve rate cut gradually recede, the USD/JPY pair has finally broken out of the sideways trading range (145.70-148.50) it had been trapped in since the release of the July non-farm payroll report in early August. It is now stabilizing above the top of this range and approaching the psychological support level of 150.00. Both the 14-day Relative Strength Index (RSI) and the MACD on the daily chart suggest increasing upward momentum, favoring bulls over bears in the short term. At this point, the currency's strong breakout above the 200-day simple moving average at 148.47 and the upper Bollinger Band at 149.20, achieved mid-last week, may now serve as support, potentially paving the way for a retest of the psychologically important 150.00 level or even the resistance level of 150.92 (August 1 high). A break below this level would target the 152.22 (February 18 high). Currently, While price and momentum signals are clearly bullish, it's important to note that several attempts by USD/JPY to break above its 200-day simple moving average this year have proven short-lived. This highlights the need for further observation regarding the currency pair's long-term trajectory. Therefore, on the downside, watch for the 200-day simple moving average at 148.48 and the upper Bollinger Band at 149.20. If these levels break, watch for USD/JPY to test the Bollinger Band 147.87 and last week's low at 147.46.
Consider shorting the USD at 149.75 today. Stop-loss: 150.00, targets: 148.60, 148.40.
EUR/USD
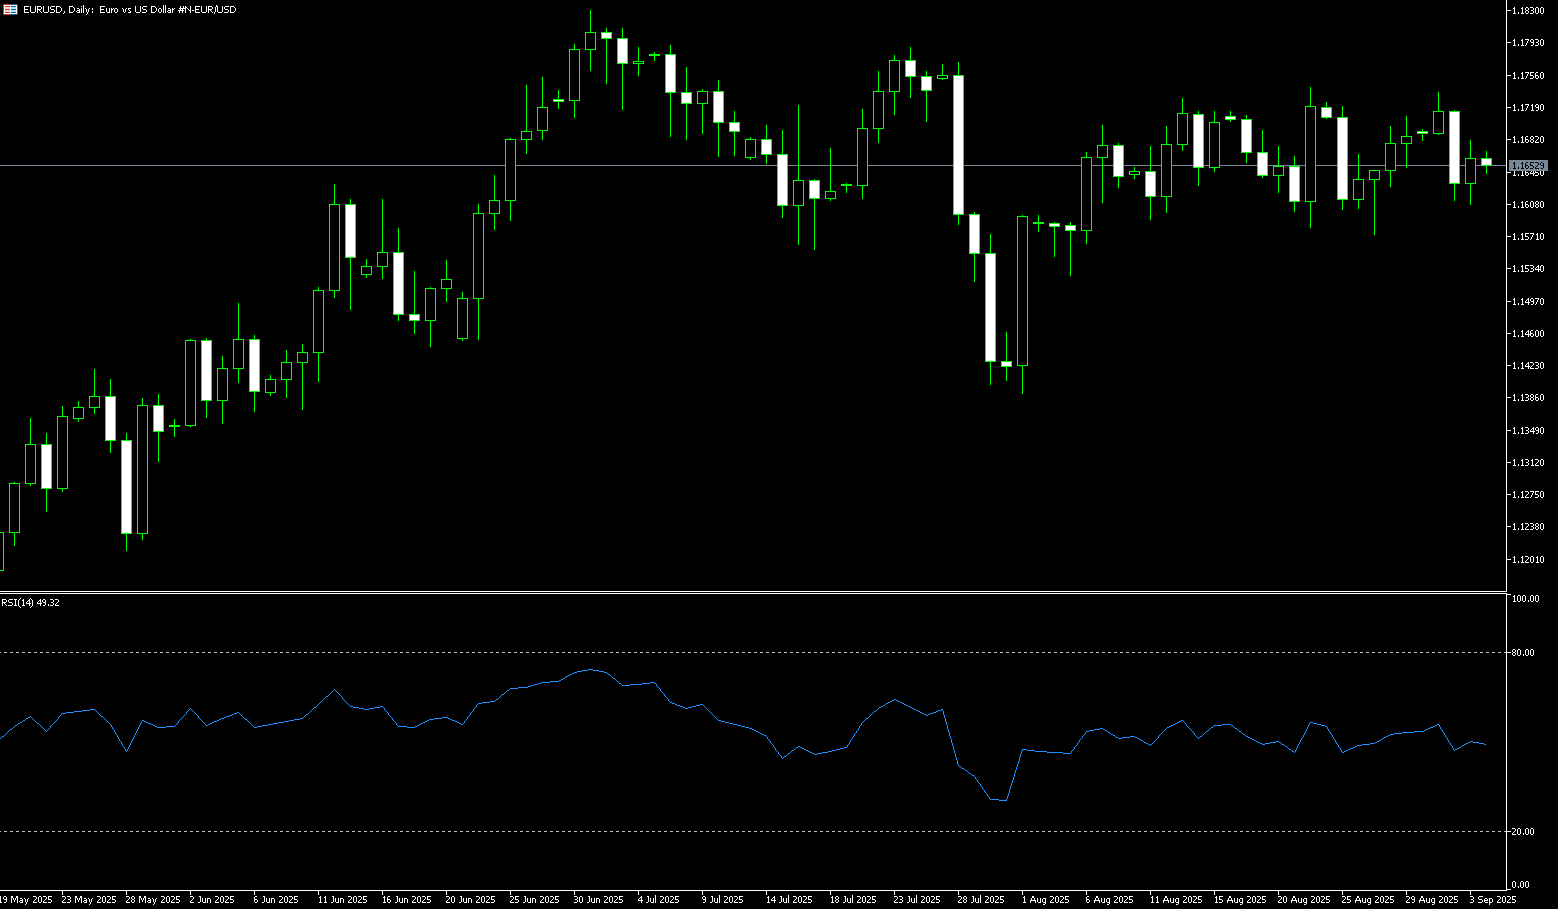
After a sharp drop to a near three-week low of 1.1645 mid-last week, EUR/USD rebounded on Friday as traders grew more confident that the Federal Reserve would cut interest rates following the release of the latest US PCE inflation report. The pair traded above 1.1700, recovering from its mid-week low of 1.1645. A slew of upbeat macroeconomic data in the US eased recession fears, while in Europe, last week's data was lackluster. To make matters worse, US President Trump rattled the market with a new round of tariffs. The president's announcement of new tariffs on heavy trucks, brand-name pharmaceuticals, and kitchen cabinets reignited concerns about global trade uncertainty and dampened risk appetite. On the other hand, Data from the U.S. Bureau of Economic Analysis revealed that second-quarter gross domestic product (GDP) growth was stronger than previously estimated. This good news, coupled with solid growth in durable goods orders in August and an unexpected drop in weekly U.S. jobless claims, prompted investors to scale back bets on a Federal Reserve rate cut and provided a fresh boost to the dollar. In Europe, expectations point to the possible end of the easing cycle after the European Central Bank held interest rates steady for the second consecutive meeting in September. Economic indicators continue to paint a mixed picture, with the services purchasing managers' index showing signs of recovery while the manufacturing slump deepens.
The euro fell below $1.17 in late September, erasing its gains since its early 2021 high, and is expected to end the month roughly flat as traders weigh the outlook for monetary policy against renewed trade tensions. The daily chart shows... EUR/USD confirmed its bearish shift last Thursday after breaking below trendline support. The pair managed to trim some losses on Friday, but momentum indicators remain in bearish territory. Mid-week's trend is forming an "evening star" pattern. This bearish candlestick pattern suggests the pair may remain vulnerable. Therefore, initial support lies near last week's low of 1.1645, which supported the pair both last Thursday and on September 11. Further below lies the lows of September 2nd and 3rd, near 1.1610, and 1.1600 (round number). A break below the 120-day simple moving average at 1.1543 is the next target. Looking up, support at 1.1725, near the lows of September 19th and 20th, may act as resistance, followed by the inverse trendline now at 1.1755 and the psychological market level of 1.1800.
Consider a long EUR at 1.1690 today, with a stop loss of 1.1678 and a target of 1.1678. 1.1750 ; 1.1760
Disclaimer: The information contained herein (1) is proprietary to BCR and/or its content providers; (2) may not be copied or distributed; (3) is not warranted to be accurate, complete or timely; and, (4) does not constitute advice or a recommendation by BCR or its content providers in respect of the investment in financial instruments. Neither BCR or its content providers are responsible for any damages or losses arising from any use of this information. Past performance is no guarantee of future results.
Lebih Liputan


Pendedahan Risiko:Instrumen derivatif diniagakan di luar bursa dengan margin, yang bermakna ia membawa tahap risiko yang tinggi dan terdapat kemungkinan anda boleh kehilangan seluruh pelaburan anda. Produk-produk ini tidak sesuai untuk semua pelabur. Pastikan anda memahami sepenuhnya risiko dan pertimbangkan dengan teliti keadaan kewangan dan pengalaman dagangan anda sebelum berdagang. Cari nasihat kewangan bebas jika perlu sebelum membuka akaun dengan BCR.

 English
 简体中文
简体中文
 繁體中文
繁體中文
 Bahasa
Melayu
Bahasa
Melayu
 Tiếng
Việt
Tiếng
Việt
 ไทย
ไทย
 日本語
日本語
 한국어
한국어
 ភាសាខ្មែរ
 español