


0
US Dollar Index
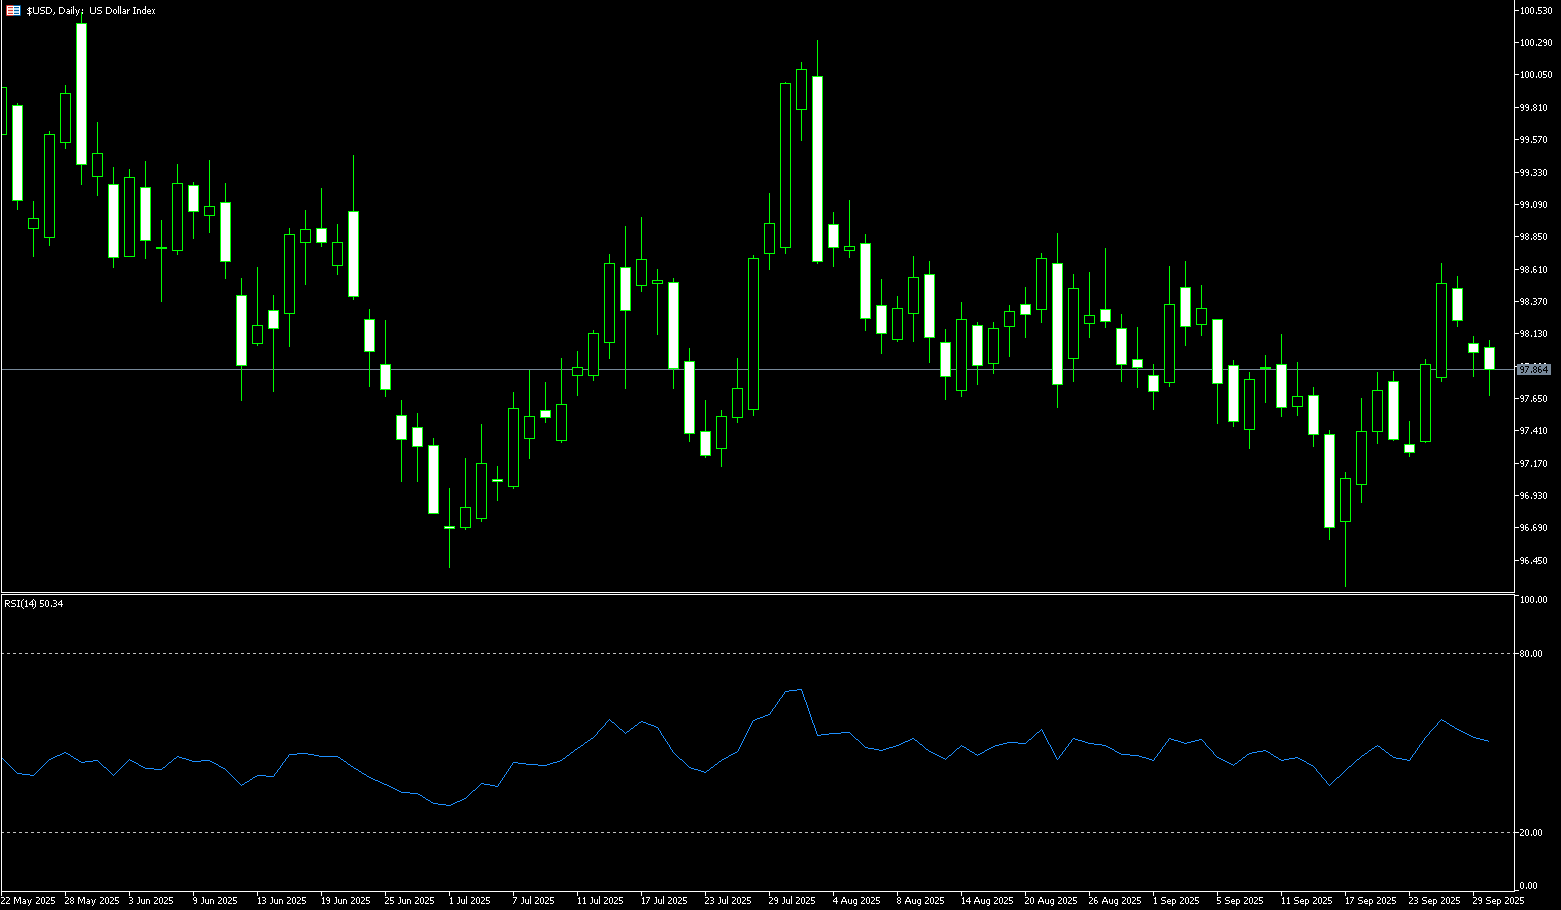
At the beginning of the week, the US dollar index fell below its 50-day moving average, trading at 97.77. Traders were assessing the risk of a looming government shutdown while also monitoring a series of US economic data releases. Concerns about a potential US government shutdown weighed on market sentiment as the September 30 funding deadline approached. Failure to pass a spending bill would force the closure of multiple government agencies, and the first day of fiscal year 2026 falls on Wednesday, October 1. The US dollar typically weakens before a government shutdown but tends to rebound once the issue is resolved. However, this particular situation presents a heightened risk to the market: a prolonged shutdown could delay the release of key economic data, including Friday's non-farm payroll report. Meanwhile, traders expect the Federal Reserve to cut interest rates by 40 basis points by December and 110 basis points by the end of 2026. This expectation reflects heightened expectations of easing Fed policy following recent hawkish data releases.
Traders will continue to monitor the progress of the government shutdown and labor market data—these factors could recalibrate market expectations for Fed rate hikes and, in turn, influence the US dollar. The US dollar index has fallen below its 50-day moving average at 98.08 and faces a test of the Bollinger Band 97.69; the 38.2% Fibonacci retracement level from 100.26 to 96.22 at 97.76; and Monday's low at 97.77. This is followed by the 23.6% Fibonacci retracement level at 97.17 and the key support level at 97.00. A break below this level would confirm a trend reversal. On the upside, the double-peak resistance level of 98.62, last Thursday's high, and the upper Bollinger Band at 98.63 are key resistance levels, followed by the 99.00 round number.
Consider shorting the US Dollar Index at 97.90 today. Stop-loss: 98.00. Target: 97.50, 97.40.
WTI Spot Crude Oil
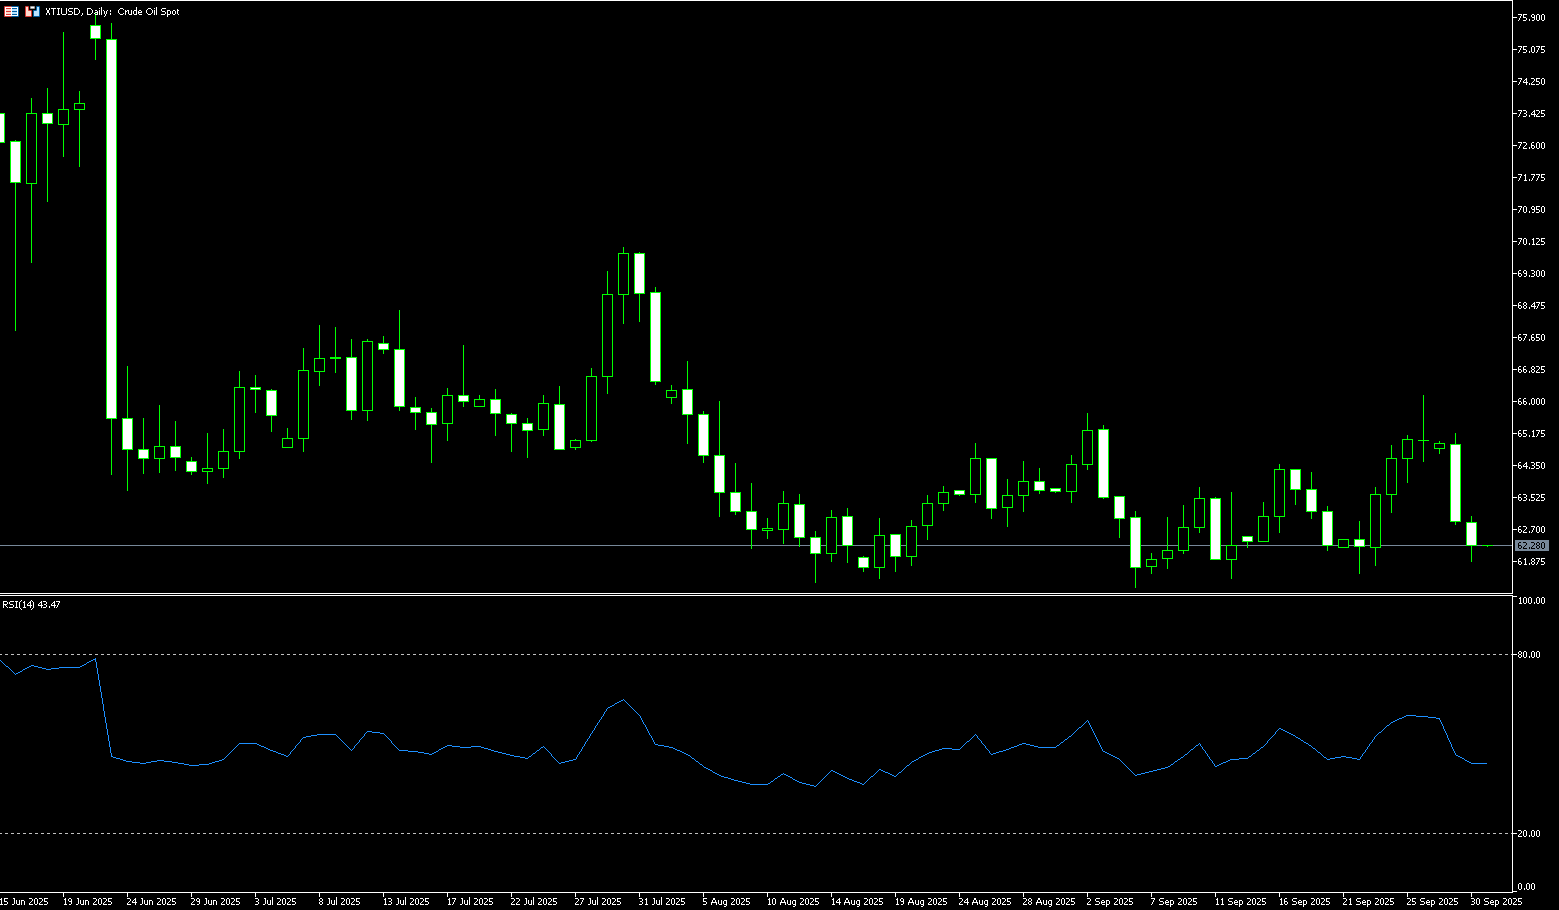
WTI crude oil fell below $63 per barrel on Tuesday, extending losses from the previous session, as traders weighed the prospect of increased global supply and the possibility of a ceasefire in Gaza. Reports indicate that OPEC+ may approve an additional 137,000 barrels per day (bpd) production increase for November at its meeting on Sunday. Additionally, oil exports from the Iraqi Kurdistan Region via the Iraq-Turkey pipeline resumed on Saturday, ending a two-and-a-half-year suspension. Geopolitically, US President Donald Trump and Israeli Prime Minister Benjamin Netanyahu said on Monday they had reached a preliminary agreement on a 20-point US peace plan for Gaza, but Hamas has not yet agreed. However, Trump warned that if Hamas rejects the plan, Israel will have his permission and full support to "get the job done." Meanwhile, the potential risk of a US government shutdown has raised demand concerns.
The daily chart shows that US crude oil briefly reached $66.20 last Friday (September 26th). After failing to reach the upper limit of the range, it quickly retreated and is currently supported by the 50% percentile of the range. Oscillator indicators suggest a bullish outlook for oil prices. However, the MACD has been above zero for less than five days in the past two months, the RSI has fluctuated around 50, and the MACD has not recently produced a significant long red candlestick pattern. Overall, oil prices remain volatile, with no clear bullish trend. Therefore, upward resistance lies at the 5-day (64.13) and 50-day (63.94) simple moving averages, as well as $65.61 (the 50.0% Fibonacci retracement level from $70.02 to $61.20). Downward support lies at $61.87 (the low of September 23rd). A break below this level could lead to a test of the $61.00 support area.
Consider going long on crude oil at 62.15 today. Stop-loss: 62.00, target: 64.0, 64.30.
Spot Gold
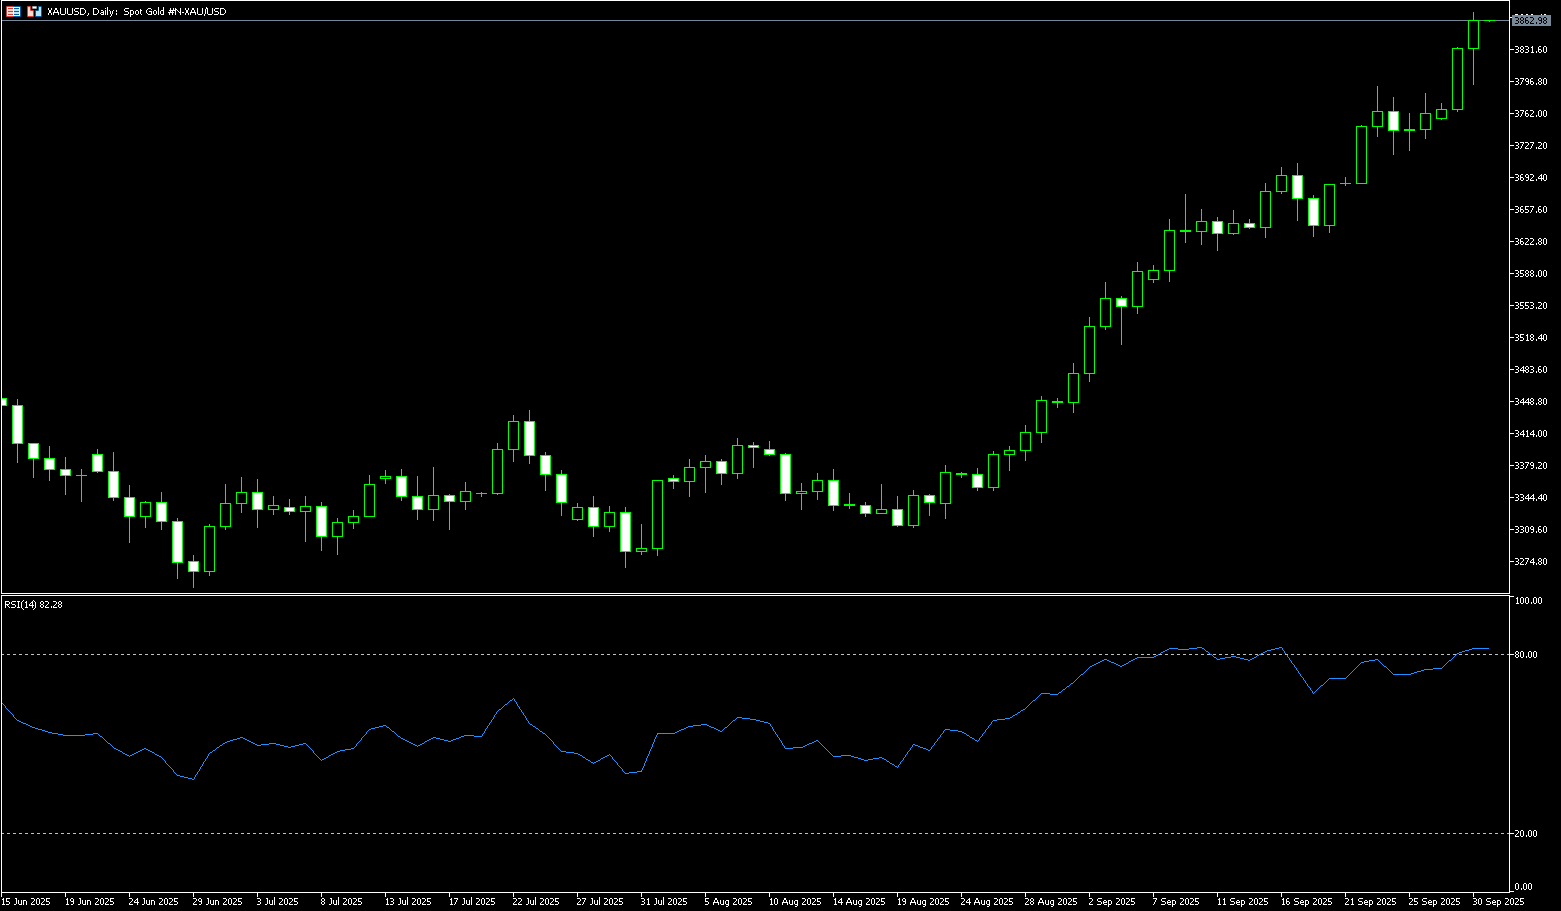
Gold prices fell sharply during Tuesday's European session after hitting a new all-time high of $3,871.70 in the morning, dropping as much as $74 to $3,797.00. Currently trading at $3,850.00. Amid seemingly unfavorable market information, there are potential bearish factors besides profit-taking on the short-term overshoot in gold prices. Gold continued its record-breaking rally in early Asian trading, continuing to draw support from a combination of factors. However, the US ultimatum to Hamas and Vance's confirmation of the US government shutdown, both potentially negative and realized, have put a pause on gold's rally. Driven by expectations of an easing Federal Reserve, the US dollar has continued its sell-off for the third consecutive trading day, which may further support gold prices. The US President stated that the US is close to brokering peace in the Gaza war and unveiled a 20-point peace plan. This statement demonstrates the US's resolve to end the war and the strengthening of US influence behind it. If these events unfold in the direction advocated by the US, they would be detrimental to gold prices.
From a technical perspective, gold bulls have a clear advantage overall in the near-term. The next upside target for bulls is to push gold prices above the key resistance level of $4,000/oz, a psychologically significant level. The immediate downside target for bears is to push gold prices below the key technical support level of $3,700/oz. Although the 14-day Relative Strength Index (RSI) on the daily chart is at a severely overbought level of 80, the market's bullish bias has been further strengthened. First resistance is seen at $3,875/oz, with further resistance at $3,900/oz. First support is seen at $3,800/oz, with further support at the weekly low of $3,785.50 reached overnight. A break below this level points to the $3,750.00 mark.
Consider going long on gold at $3,845 today, with a stop-loss at $3,840 and targets at $3,880 or $3,890.
AUD/USD
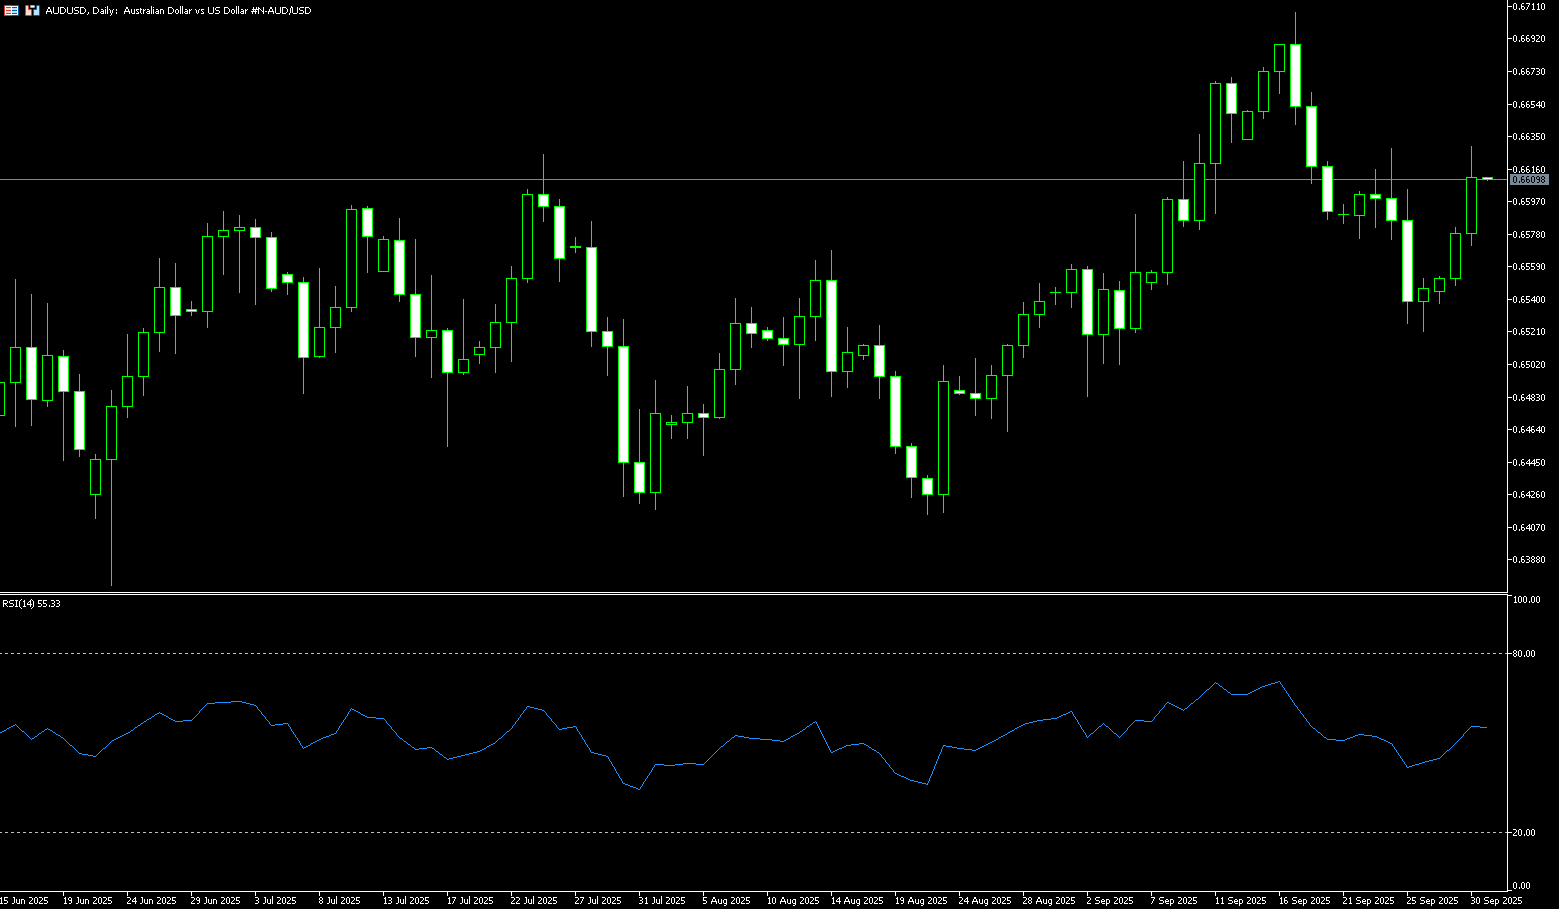
The Australian dollar rose on Tuesday, extending its gains for the third consecutive trading day. The AUD remained strong following the release of China's NBS Purchasing Managers' Index (PMI) and Australian building permits data. The Reserve Bank of Australia (RBA) announced on Tuesday that it would maintain the official cash rate (OCR) at 3.6% following its September monetary policy meeting. This decision was in line with market expectations. AUD/USD revisited the psychologically important $0.660 level. China's National Bureau of Statistics' manufacturing PMI improved to 49.8 in September, up from 49.4 in August. This reading was above the market consensus of 49.6. The NBS non-manufacturing PMI fell slightly to 50.0 in September, down from 50.3 in August and falling short of expectations for a reading of 50.3. Australian building approvals fell 6% month-over-month in August, exceeding expectations for a 5.5% decline following an 8.2% drop in July.
AUD/USD is continuing its rebound from a three-week low of 0.6521. A cautious and steady stance could fuel a further rally, targeting last week's high of 0.6628. The 14-day Relative Strength Index (RSI) on the daily chart is attempting a bottom-up crossover above its midline, confirming a renewed uptrend. A sustained break above the psychological resistance level of 0.6600 would test last week's high of 0.6628. A break below this level would target 0.6707 (the September high). A dovish signal from the Reserve Bank of Australia could trigger renewed selling pressure against the AUD/USD pair. The exchange rate could revisit the three-week low of 0.6521 (which coincides with the 100-day simple moving average at 0.6520). A daily close below this support could trigger a decline towards the September 2 low near 0.6483, and towards the psychological level of 0.6450.
Consider a long position on the Australian dollar at 0.6600 today. Stop-loss: 0.6587 Target: 0.6640, 0.6650
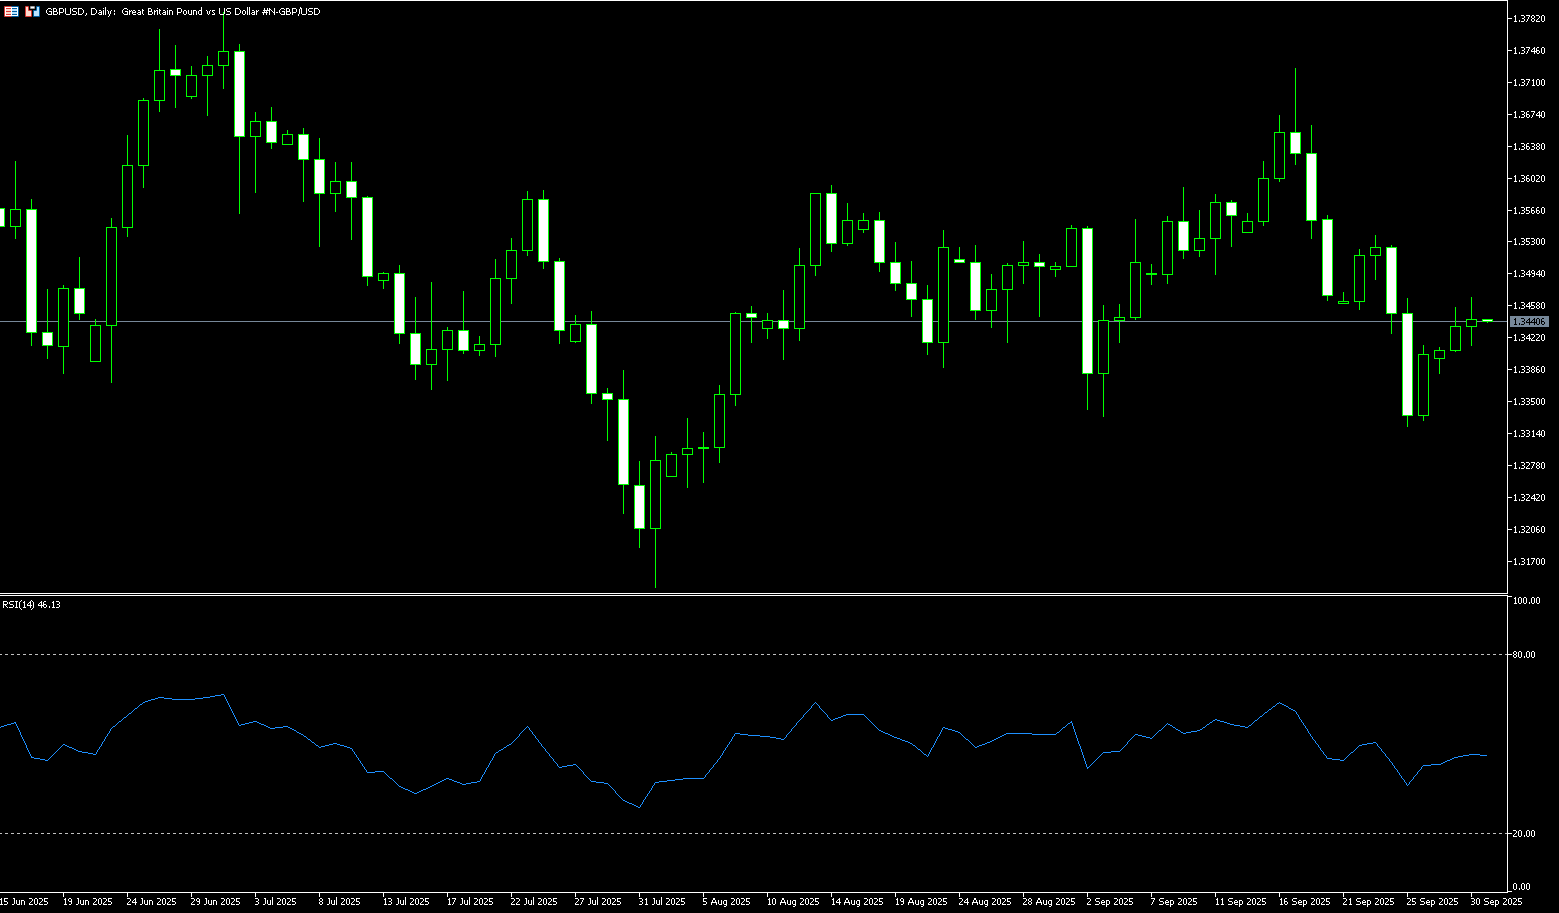
GBP/USD
GBP/USD remained subdued after two days of gains, trading around 1.3440 on Tuesday. Traders are taking a cautious approach amid concerns that this week's US jobs report may be delayed, with the government nearing a potential funding freeze and shutdown. Traders are looking forward to the September non-farm payroll report for insights into the labor market, with data on job openings, private sector employment, and the ISM manufacturing purchasing managers' index also closely watched. US President Trump warned that if Congress fails to pass a funding bill, it would lead to massive federal layoffs, effectively putting his own administration at risk and threatening further disruption to federal operations. Market uncertainty intensified after President Trump shared plans to impose a 100% tariff on imported branded or patented pharmaceuticals, effective October 1st, unless pharmaceutical companies establish manufacturing facilities in the United States.
In recent weeks, the British pound has continued its slow and painful bullish recovery after falling to a seven-week low of 1.3324 last Thursday. GBP/USD has rebounded above its 5-day simple moving average of 1.3412, but short-term price action could face further downside pressure from the 50-day simple moving average of 1.3466. A break below this level could lead to technical resistance near 1.3500, a key market level. This level is fraught with potential pitfalls for bulls. Conversely, the 14-day relative strength index (RSI) remains below 50, suggesting a persistent bearish bias. GBP/USD is testing the September 26 low of 1.3395. A break below this level would strengthen the bearish bias and exert downward pressure on the pair, pushing it towards the monthly low of 1.3333 reached on September 3.
Consider a long position on GBP at 1.3428 today, with a stop-loss at 1.3415 and a target of 1.3490 or 1.3480.
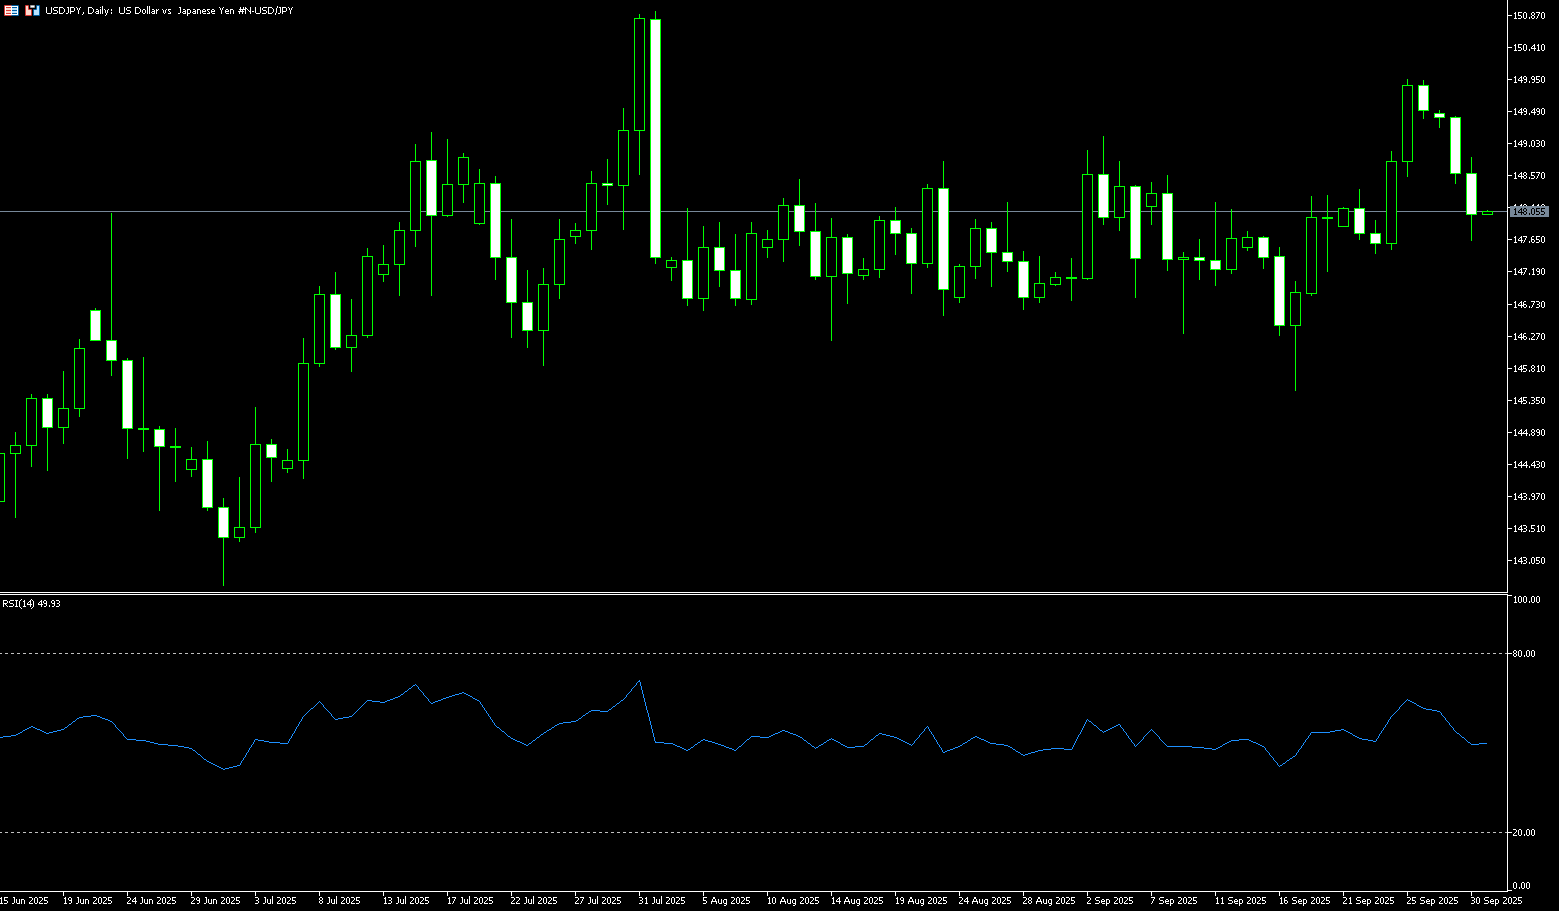
USD/JPY
The yen rose for a third consecutive day against a generally weaker dollar on Tuesday, dragging USD/JPY below its 200-day simple moving average of 148.39. Despite a mixed message from the Bank of Japan (BOJ), investors appear confident that the central bank will stick to its policy normalization path. This, combined with continued safe-haven buying, has been a key factor driving flows into the yen. Meanwhile, the BoJ's hawkish outlook diverged significantly from market bets on two Federal Reserve rate cuts before the end of the year. This latter trend has kept the dollar subdued, benefiting the low-yielding yen. Furthermore, a break below the 200-day simple moving average further supported USD/JPY. The exchange rate extended its decline from the pullback near the psychological level of 150.00, a near two-month high reached last week.
USD/JPY found some support and defended the technically important 200-day simple moving average at 148.39. Furthermore, while oscillators on the daily chart have lost some momentum, they remain in positive territory. This favors bullish traders and supports the possibility of further gains. However, any further gains may face resistance near the 149.00 level. A sustained strong breakout would reaffirm the positive outlook and allow the spot price to make another attempt to conquer the psychological level of 150.00, with some intermediate resistance around the 149.40-149.45 area. On the other hand, a break below the 200-day simple moving average, currently located near the 148.39 area, could pave the way for a decline towards the 148.00 round number. Some follow-through selling would negate any short-term positive bias and put the pair at risk of accelerating its decline towards the 147.50 area, passing through the 147.20-147.15 zone. The next level is the 147.00 mark, a decisive break of which could shift the short-term bias in favor of bearish traders.
Consider shorting the USD at 148.20 today. Stop-loss: 148.40, target: 147.40, 147.20.
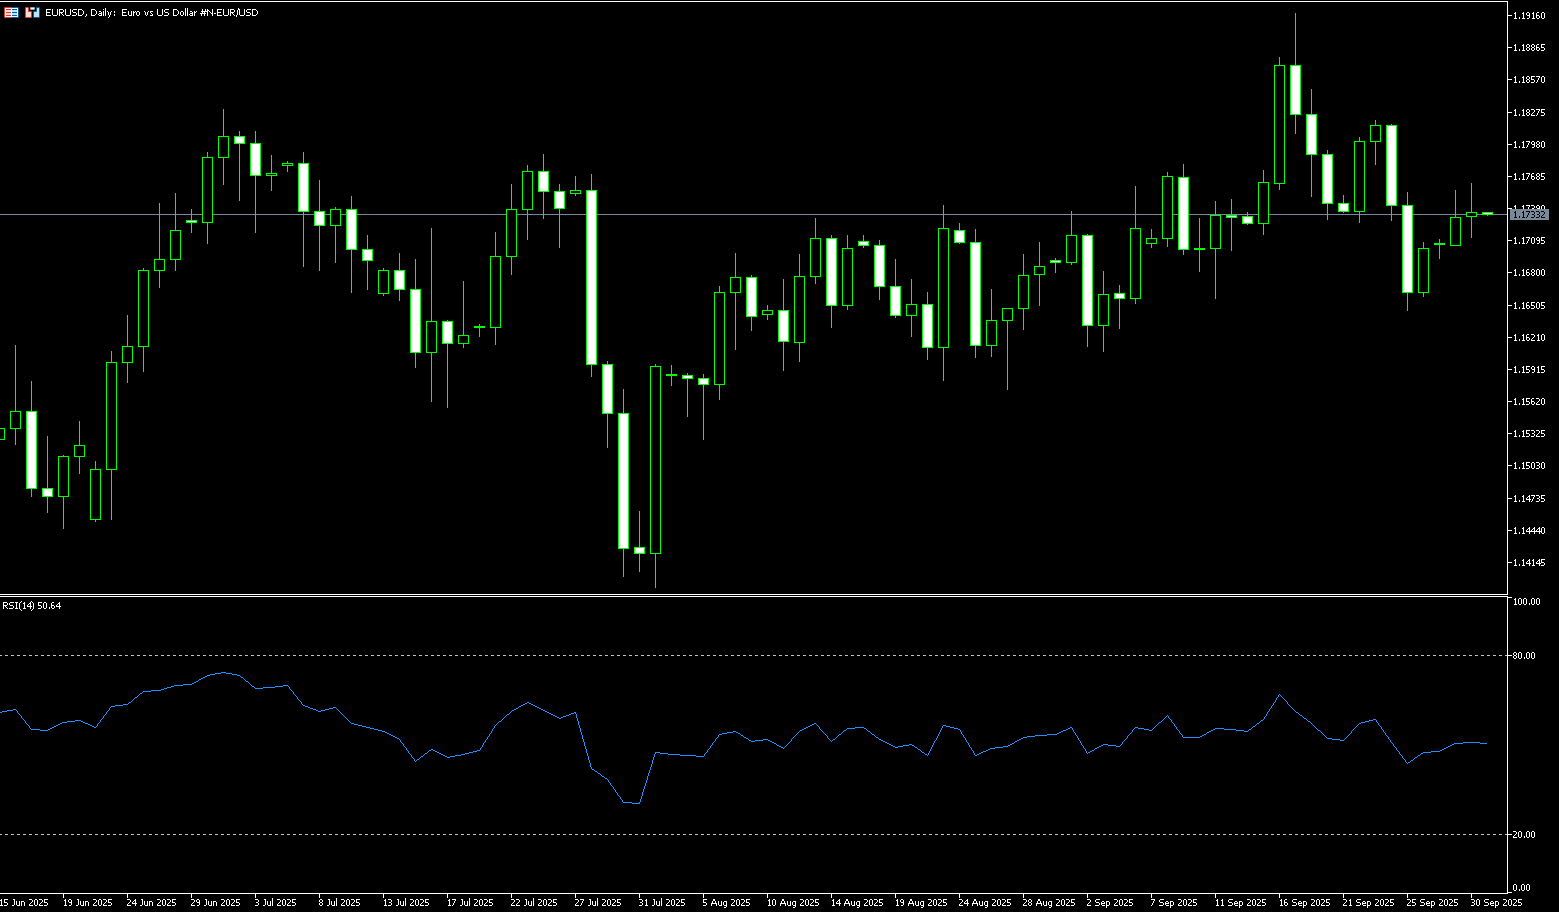
EUR/USD
During the European session on Tuesday, the euro/dollar traded in a narrow range around 1.1730, failing to extend the gains of the previous two sessions. Despite Eurozone data showing improved market sentiment, the euro's exchange rate was unable to gain significant ground. The dollar weakened against most G20 currencies following US President Trump's meeting with Senate and House Democratic leaders. Senate Democratic Leader Schumer stated after the meeting that "significant differences existed between the two sides," while House Democratic Leader Jeffries explicitly opposed "partisan Republican bills that undermine healthcare." Meanwhile, Bloomberg's headline reported that Vice President Cyrus Vance said the US is "heading for a government shutdown after talks with Democrats." In the Eurozone, the September consumer confidence index rose slightly from -15.5 to -14.9; the industrial confidence index dipped slightly from -10.2 to -10.3, still beating the forecast of -10.9; and the services confidence index fell from 3.8 to 3.6, below the consensus forecast of 3.7.
EUR/USD has experienced two consecutive days of bullish activity but is expected to consolidate around current levels, near its 20-day simple moving average of 1.1741. The 14-day relative strength index (RSI) is flat near neutral levels (currently at 51.15), suggesting that the pair may consolidate around current levels. If EUR/USD breaks above 1.1740, the next resistance level will be 1.1800 (a psychological market barrier), followed by the yearly high of 1.1918. Conversely, if bears break through the 1.1700 level, this would expose support at 1.1642 (the 89-day SMA), which could then challenge the 1.1600 round-number level and the 100-day SMA at 1.1599.
Consider a long EUR at 1.1725 today, with a stop loss of 1.1712 and targets of 1.1780 and 1.1770.
Disclaimer: The information contained herein (1) is proprietary to BCR and/or its content providers; (2) may not be copied or distributed; (3) is not warranted to be accurate, complete or timely; and, (4) does not constitute advice or a recommendation by BCR or its content providers in respect of the investment in financial instruments. Neither BCR or its content providers are responsible for any damages or losses arising from any use of this information. Past performance is no guarantee of future results.
Lebih Liputan


Pendedahan Risiko:Instrumen derivatif diniagakan di luar bursa dengan margin, yang bermakna ia membawa tahap risiko yang tinggi dan terdapat kemungkinan anda boleh kehilangan seluruh pelaburan anda. Produk-produk ini tidak sesuai untuk semua pelabur. Pastikan anda memahami sepenuhnya risiko dan pertimbangkan dengan teliti keadaan kewangan dan pengalaman dagangan anda sebelum berdagang. Cari nasihat kewangan bebas jika perlu sebelum membuka akaun dengan BCR.

 English
 简体中文
简体中文
 繁體中文
繁體中文
 Bahasa
Melayu
Bahasa
Melayu
 Tiếng
Việt
Tiếng
Việt
 ไทย
ไทย
 日本語
日本語
 한국어
한국어
 ភាសាខ្មែរ
 español