


0
US Dollar Index
Short-Term Bearish Outlook for the US Dollar
The outbreak of the Israeli-Palestinian conflict continues to escalate, and the US dollar has returned to an upward trend. Several Federal Reserve officials have started to express dovish statements, making it increasingly likely that a November rate hike will be postponed. US September PPI and CPI inflation figures remain stubborn, and the October University of Michigan Consumer Confidence Index has deteriorated, with surging inflation expectations attracting investors back to the US dollar. However, in the medium to long term, the short-term market volatility caused by geopolitical conflicts may only affect short-term market trends and is not the core driver of the market. During this period, the US dollar index has continued to decline. The key factors currently dominating the market are still the Federal Reserve's fundamental policy stance. Looking at it from another perspective, there is still a risk of a "phase-wise top" for the US dollar's rally that began in mid-July this year, and the recent outbreak of the "Israeli-Palestinian conflict" may further raise the risk of a war in the "Middle East region." However, fundamentally, the US economy is robust and is currently the best-performing economy among developed countries. Additionally, the Bank of Japan is adhering to its "accommodative monetary policy," the Eurozone is experiencing weak growth, and the Chinese economic recovery is not as strong as expected. These factors continue to support the US dollar's ascent, even if the Federal Reserve does not raise interest rates.
From the daily chart, the US dollar index traded in a narrow range between 105.97 and 106.67 last week and is currently oscillating within a descending triangle. From a technical perspective, the US dollar index is testing the resistance line of the descending triangle at 106.40. If the bulls break through 106.40, it would signal the failure of the bearish pattern of the descending triangle, and the US dollar index could further challenge and break through 107.00 (upper boundary of the Bollinger Bands) and 107.34 (previous high), continuing its bullish trend. At present, the daily chart of the US dollar index shows a "hidden bearish divergence" between the price and the RSI indicator, implying a weakening of upward momentum. If the US dollar adjusts downward this week, the first support levels to watch are 105.56 (lower boundary of the Bollinger Bands) and 105.55 (support line of the descending triangle), with a potential target at the 50-day moving average at 105.11. In the 4-hour chart, signs of a temporary top are becoming more apparent, potentially forming a "head and shoulders" bearish pattern. Even without a head and shoulders pattern, there is a significant potential for bears to retain control until a clear breakout above 107.00-107.34, creating new highs.
This Week's Conclusion: The Israeli-Palestinian conflict has driven risk aversion, with gold showing significantly stronger performance than the US dollar. The influence of the US dollar index on the overall market is starting to wane. Along with the dovish comments from Fed Chair Powell and other Fed officials in the early hours of today, the expectations for a November rate hike have cooled, leading to a failed rebound in the US dollar. The expected trading range for this week is between 105.10 and 107.34. This week's strategy: It is recommended to sell the US dollar index on rallies.

WTI Crude Oil
Oil Prices Poised to Challenge the $100 Mark
Recent developments in the Middle East have not significantly boosted WTI crude oil prices, and the ten-year US Treasury bond yield continues to climb, nearing 5%, which could hinder oil prices due to deteriorating risk sentiment. From a technical perspective, WTI crude oil prices face resistance at a crucial level, and short-term downside correction risks should be monitored. Concerns about an escalation of Middle East conflicts have not materialized in the short term, limiting the upward movement of WTI oil prices. However, the development of conflicts is unpredictable, and if major oil-producing nations in the Middle East become directly involved in a war, oil prices will undoubtedly rise. There was also a minor incident last week that briefly boosted oil prices: Iran called for Arab countries to impose an oil embargo on Israel, causing WTI crude oil to spike. However, this was later denied by OPEC, stating that they would not weaponize crude oil. Regardless of how the situation in the Middle East unfolds, one risk that oil traders should closely monitor is the continued sharp drop in the US bond market and rising yields. The latest data shows that the yield on the ten-year US Treasury bond is nearing 5%, continuing to hit multi-year highs. Traditionally, US bonds, seen as a safe haven for capital, are experiencing sustained sell-offs and soaring yields. This unusual phenomenon may make investors holding risk assets generally uneasy. US stock indices are ending their rebound and correcting lower. If market risk sentiment deteriorates further, WTI crude oil prices are likely to be affected.
Oil prices are steadily achieving the "goal" of consecutive gains for the second week. Last week, as the market prepared for a potential ground assault on the northern Gaza Strip, oil prices surged at one point. Currently, oil prices have formed a "golden cross" bullish pattern. WTI crude oil is approaching $90.00 (a psychological level) and the September swing high of $93.94. If it continues to rise, there is the possibility of oil prices further testing the important psychological level of $100. Oil prices are currently facing resistance in the short term around the high level formed by the range from $81.40 (October 12th low) to $88.50 (October 4th high). The resistance around $88.50 is limiting further upward movement, and short-term downside risks should be watched. In case of a downward correction, initial support is around $87.27 (50% Fibonacci retracement level of the range from $80.60 to $93.94), with further support around $85.71 (9-day moving average) and $85.69 (38.2% Fibonacci retracement level). If this support zone is breached, WTI oil prices may face further declines.
This Week's Conclusion: Oil prices are expected to face a short-term directional choice. The technical divergence lies in whether the rapid decline in oil prices at the beginning of October has completed a larger cycle of correction, as such adjustments often accompany rapid and significant corrections within a long-term uptrend. If so, it implies that oil prices have re-entered a new uptrend and are likely to challenge the $100 psychological mark.
Expected trading range for this week: $85.00 - $93.94. This week's strategy: Consider buying crude oil on dips.

XAUUSD
The Gold Market May Resume Its Uptrend Towards $2081.80
In the past couple of weeks, gold prices have been benefiting from the Israel-Palestine conflict. Despite the ten-year US Treasury bond yields surpassing the 5% level, both gold and oil have continued their strong upward trajectory over the last two weeks. Gold prices climbed further to $1997.30 last week, marking a new high since May 16. Meanwhile, Federal Reserve Chairman Powell's dovish speech last week provided additional support. The ongoing escalation of tensions in the Middle East has placed safe-haven asset gold in a favorable position, even though the rising US bond yields have reduced the appeal of gold, which doesn't offer any yield. From a more dovish perspective, Powell's mention of higher yields as a boost to maintaining a restrictive monetary policy environment has been seen as anticipated by the market. However, the money market has repriced the dovish interest rate outlook, expecting the Fed's first rate cut to occur in July next year, instead of the previously anticipated September, before Powell's speech. Any further developments that could force the US to confront the conflict will accelerate gold's uptrend. The longer the conflict in the Middle East lasts, and the more it remains unresolved or without a ceasefire, the more likely gold is to reach the previous high of $2081.80 in May. Therefore, closely monitor the progress of the Israel-Palestine conflict and the extent of US involvement in the coming days.
From a technical standpoint, gold rose by more than 2.50% to a five-month high of $1997.30 last week. Since the Israel-Palestine conflict began earlier this month, gold has risen over 9% from its low near $1810.50, and this upward movement has seen few retracements. On Friday, it even reached a high of $1997.30 per ounce. Given the current complexity of the geopolitical situation, with the possibility of multiple countries being involved in the Israel-Palestine conflict, it's reasonable to maintain a bullish outlook for this week, with an initial target of $2017.70 (the 76.4% Fibonacci retracement level of the range from $2081.80 to $1810.50). Looking lower, the next level to watch is $2048.20 (the high from May 10), and a more optimistic scenario is not ruling out the possibility of gold revisiting the previous high of $2081.80 this week. Regarding the downside, because the RSI technical indicator has entered overbought territory, you should first keep an eye on $1972.40 (last Friday's low and the high around July 31), as long as it doesn't break the critical support zone of $1953.50 (the 23.6% Fibonacci retracement level of the range from $1810.50 to $1997.70) and the $1953.00 level (around the high from September 1), the market may resume its uptrend towards the previous high of $2081.80.
This Week's Conclusion: As market participants' risk aversion rises, gold prices continued their ascent to $1997 last week. The escalation of the Israel-Palestine conflict has heightened market risk aversion, helping gold prices accelerate towards the previous high of $2081.
Expected trading range for this week: $1953 - $2081. This week's strategy: Consider buying gold on dips.

XAGUSD
Silver Prices Surge Amid Geopolitical Concerns
Silver prices have surged due to geopolitical concerns, and with the backdrop of escalating tensions in the Middle East, short positions in silver have been covered. Potential safe-haven buying has lifted silver prices this month. Dovish comments from Federal Reserve officials imply that the central bank has changed its policy on interest rates, which has also provided support for silver. In this regard, the market believes that there is about a 90% chance that the Federal Reserve will keep rates unchanged at the next rate decision. While the intensification of geopolitical uncertainties can lead to bets on precious metals, the least resistance path for silver remains flat to downward, unless there is a broader reversal in the trends of US Treasury yields/real yields. Geopolitics is one of the risks that could slow down or reverse silver's decline. Regional conflicts often lead to a rise in risk aversion in financial markets, which is positive for silver. On the issue of the Israel-Palestine conflict, apart from its impact on absolute prices, the logical change in the gold-silver ratio needs to be monitored. In terms of safe-haven sentiment, silver is relatively weaker compared to gold. Therefore, the previous logic of gold-silver ratio repair may reverse in the context of the Israel-Palestine conflict.
The daily chart shows that silver's recent rebound has brought it back into the uptrend channel that started at the beginning of the month, suggesting that the downtrend in silver prices since the early May high of $26.135 has slowed. The recent rebound in silver last week encountered resistance in the region of 24.05, which is the upper boundary of the uptrend channel, and 24.18 (a downward extension trendline originating from the May high of $26.135). There is also resistance at 24.85, which has converted from support (the 76.4% Fibonacci retracement level of the range from $26.135 to $20.688). Above this lies the May high at $26.135. From a broader perspective, silver prices need to break through the resistance convergence zone around 24.05 (consisting of the 61.8% Fibonacci retracement level and the upper boundary of the uptrend channel) for the outlook to turn bullish. If silver falls below 22.76 (the 38.2% Fibonacci retracement level) and last Thursday's low of 22.63, it may approach the 350-day moving average at 22.12.
Conclusion for the Week: Overall, in the context of the Israel-Palestine conflict, silver is expected to rise more easily than fall. From the perspective of precious metals, there may be some short-term changes, but the medium to long-term outlook is still moving in a direction favorable to silver prices. Considering the characteristics of silver, which has higher volatility compared to other commodities like gold and base metals, both positive and negative factors can be influenced by shifts in fund flows, which are reflected in the market in advance.
Expected trading range for this week: $22.63 - $23.85. This week's strategy: Consider buying silver on dips.

AUDUSD
The Australian Dollar couldn't break free from its bearish trend.
Last week's disappointing Australian labor market data for September showed the creation of only 6,700 new jobs, which was well below the revised figure of 63,300 in August and lower than the market's expectation of 20,000 jobs. The unemployment rate fell from 3.7% in August to 3.6%, but this was mainly due to a sharp drop in the labor force participation rate from 67.0% to 66.7%. Despite the Reserve Bank of Australia's (RBA) adoption of aggressive tightening policies, the Australian labor market unexpectedly showed strength. However, when looking back over the past six months, the situation becomes somewhat complicated, as job growth has been limited to temporary positions, with little growth in full-time jobs. The main reason for this is more people giving up on job searching. This result alone may not be enough to offset the RBA's concerns about inflation. The recent hawkish rhetoric from the RBA has increased the possibility of a rate hike in November, and next week's inflation data will provide critical evidence. Australia's third-quarter Consumer Price Index (CPI) will be published on October 25, and some analysts believe that the core inflation rate may rise more than the RBA's own forecast of 0.9%. If the inflation rate continues to rise, it will raise expectations for further rate hikes by the RBA, which could give the Australian Dollar a boost.
On the 4-hour chart, the AUD/USD is still trading below 0.6350, unable to break free from its bearish trend. The key support levels are formed by the triple bottom at 0.6285 and 0.6286. If these levels are breached, the next target is the 2022 trend low at 0.6170. If these levels can hold, there's potential for a bottoming rebound to see if it can develop a recovery rally towards 0.6380 (formed by the downtrend resistance line from the July high of 0.6895 and the 250-hour moving average of 0.6402). Currently, the AUD/USD appears to be gradually declining, with the exchange rate oscillating within a descending triangle pattern on the 4-hour chart. The continuous lower highs and lower lows suggest that the downside risks remain predominant. If the AUD/USD breaks below 0.6300 (the support line of the descending triangle) and 0.6285-0.6286 (the triple bottom low), the next target could be 0.6170, which is the low from 2022.
Weekly Conclusion: From a technical perspective, if the AUD/USD breaks below 0.6300 (the support line of the descending triangle) and 0.6285-0.6286 (the triple bottom low), the next target could be 0.6170 (the 2022 low). Weekly Expected Range: 0.6200 - 0.6402. Weekly Strategy: Selling the Australian Dollar on rallies appears to be a suitable strategy for this week.

USDJPY
USD/JPY is attempting to challenge the 150 level The U.S.
Dollar against the Japanese Yen may establish new highs as Japanese bond yields rise, but U.S. bond yields rise even more. The Bank of Japan (BoJ) will hold a rate policy meeting later this month, and if they adjust their policy, USD/JPY is looking to challenge the 150 level. The market is closely watching the BoJ's every move, as a sharp decline in the Japanese Yen could trigger intervention from the central bank. Currently, USD/JPY is trading just below the 150 level. Overall, the USD/JPY trend continues to be relatively consistent with the U.S. Dollar Index and the U.S.-Japan interest rate differential. In the U.S., inflation pressures are still present, and the slow rate of decline in inflation provides a basis for the Federal Reserve to maintain high-interest rates, which will be crucial in supporting the strength of the U.S. Dollar. In Japan, the country's weak domestic demand continues to be a significant drag on the economy, and there remains uncertainty about the impact of the global slowdown on Japan's export-oriented economy. Moreover, the Bank of Japan maintains its accommodative policy stance, which is not enough to reverse the trend of Yen depreciation. Previously, the market had widely expected the BoJ to intervene in the currency markets when the Yen depreciated to around 145, but in reality, that situation did not occur. Considering Japan's domestic economic conditions, Yen depreciation isn't necessarily a conscious choice.
In recent weeks, USD/JPY has been trading in an extremely narrow range. Currently, it struggles to break above the psychological level of 150 but also has limited downside movement. Investors are mainly in a wait-and-see mode for this currency pair. The Bank of Japan is expected to keep its monetary policy unchanged at the central bank meeting on October 31, while the market is betting that the BoJ will further tighten its policy. USD/JPY is approaching a 12-month high it set earlier this month at 150.16. If it breaks through that level, the exchange rate will rise toward last year's 33-year high at 151.95. On the 4-hour chart, USD/JPY is currently trading within a narrow range in a horizontal channel, with upper and lower levels at 150.10 and 149.60, respectively. Short-term direction is entirely unclear. However, as the exchange rate is above the 34-hour (149.70) and 50-hour (149.53) moving averages, this may suggest bullish momentum developing. On the downside, support levels are seen at recent lows of 148.76 (October 17 low) and the 50-day moving average at 147.75. If it goes further down, it may decline to the support zone of 145.05 - 145.10.
Weekly Conclusion: The Bank of Japan's intervention to devalue the Yen is likely to remain cautious and won't change the overall trend of Yen weakening, driven by a stronger U.S. Dollar and widening U.S.-Japan interest rate differentials. In the near term, USD/JPY is expected to continue trading in a narrow range around the 150 level. Weekly Expected Range: 147.75 - 150.90. Weekly Strategy: Considering long positions on dips in the USD.

GBPUSD
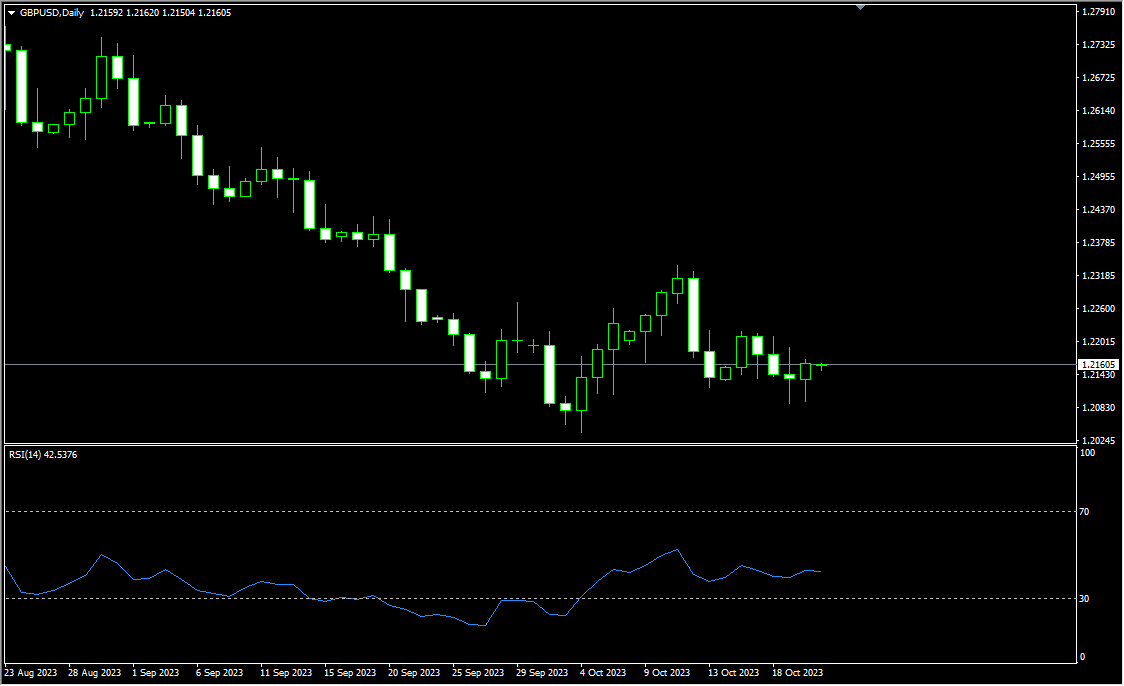
The British Pound is weakening in the short term within a large downtrend channel.
Last week, the GBP/EUR fell to its lowest level in five months, putting pressure on the GBP/USD as soft economic data intensified concerns about the health of the UK economy. The British Pound is typically sensitive to global sentiment swings, and with the ongoing Middle East conflict and the continuous rise in US Treasury yields, investors have been pushed towards safe-haven assets. This has led to a decline in the British Pound along with assets like stocks. Last week, the UK's Office for National Statistics reported a 0.9% decline in retail sales this month, following a 0.4% growth in August, which was much worse than the expected 0.2% decline as per a Reuters survey. Weak retail sales and a noticeable drop in consumer confidence, even though both are among the most volatile data the UK releases. Due to the more challenging prospects that the UK faces compared to the Eurozone, it is expected that the GBP exchange rate will continue to weaken in the coming year. Driven by the data, the British Pound has further declined against the US Dollar, as it reinforces the notion that the Bank of England may find it difficult to pivot back to a rate hike after a recent pause.
On the daily chart, GBP/USD has been repeatedly testing the lows within a large downtrend channel since July. In early October, it briefly fell below the lower channel line to a 7-month low of 1.2037, before bouncing slightly above 1.2300 but the upside was capped by the upper channel line, and it once again rested near 1.2100. Currently, it seems that the exchange rate is still looking for a bottom. Key support levels are at last Thursday's low of 1.2090, 1.2060 (the midline of the descending channel), and 1.2037 (low of October 4). If the exchange rate drops below these support areas, speculative long positions in the Pound will likely be further hit, so the exchange rate appears to be in an oversold condition. However, there is no evidence that the price will reverse until it drops near the strong convergence support level of around 1.1800, the early 2023 low. Short-term rebounds may first target the 25-day moving average of 1.2211, with the next level at 1.2260 (upper channel line).
Weekly Conclusion: The UK government must start reducing the deficit significantly, and the extent of the cuts needs to be greater than that of the Eurozone for investors to reduce their negative views on the British Pound. Weekly Expected Range: 1.2000 - 1.2260. Weekly Strategy: Trading strategy can consider selling the British Pound on rallies.
EURUSD
Short-term rebound in the Euro faces challenges.
Since last week, the Euro has rebounded from its lows, showing a volatile uptrend. However, due to the resilience of the U.S. economy and the dovish stance of the European Central Bank (ECB), the Euro's gains are limited, and its upward movement may face challenges, keeping it in a low-level oscillating trend. From a fundamental perspective, the strong performance of the U.S. economy reinforces confidence in a soft landing, putting pressure on the Euro's trend. Federal Reserve Chairman Jerome Powell's slightly dovish speech at an economic forum, where he reiterated that rates would be maintained at higher levels for a longer period, added to this sentiment. In Europe, the October ZEW Economic Sentiment Index for the Eurozone and Germany came in at 2.3 and -1.1, respectively, showing significant improvements compared to the previous values and expectations, indicating a slight recovery in economic expectations. However, the recovery is weak, and the German Economic Sentiment Index remains in negative territory. In terms of inflation, the Eurozone's September CPI year-on-year growth rate was significantly lower than the previous value and the expected value, suggesting a slowdown in inflationary pressures. The European Central Bank (ECB) is set to announce its rate decision this week, and the market generally expects this rate hike cycle to be near its end, keeping the Euro under pressure.
On the daily chart, the primary trend for EUR/USD is still leaning towards a downward movement, with technical indicators pointing downwards. In October, the pair has been trading within the range of 1.0448-1.0640, with preliminary support and resistance levels established on October 3 and October 12, respectively. Currently, EUR/USD has been repeatedly declining within a large downtrend channel over the past three months. It briefly broke above the upper channel line (currently at 1.0560) at the end of last week. If it moves further upwards this week, resistance levels can be seen around the previous high at 1.0689 (50-day moving average). Beyond this level, another previous high and turning point near 1.0769 (September 12 high) may form resistance. A key support for EUR/USD is at the 1.0500 level, which is relatively robust and may not be easy to break, at least upon the initial test, especially considering the substantial decline in the exchange rate in recent weeks. If it truly falls below the 1.05 support, the exchange rate will retest 1.0448 (October 3 low) and 1.0420 (the midline of the downward channel
Weekly Conclusion: The European Central Bank (ECB) is expected to announce its rate decision this week, and the market generally expects this rate hike cycle to be near its end, keeping the Euro under pressure.
Weekly Expected Range: 1.0448 - 1.0689
Weekly Strategy: Selling the Euro on rallies is still a consideration for this week.

USDCNH
China's trade surplus provides support for the Renminbi
Over the past two years, the Renminbi exchange rate has been under pressure due to a mix of domestic and international factors. In recent months, the USD/CNH exchange rate has fluctuated around 7.3, maintaining relative stability at a reasonable equilibrium level. With the influence of global economic and trade cycles, differences in asset yield spreads, and market expectations regarding the U.S. interest rate hike, can the Renminbi exchange rate emerge from its lows, and what trends will it display in the fourth quarter? In the third quarter of this year, the global trade situation has been less than satisfactory, with a decrease in global merchandise trade volume. The weakening of global trade is adding to the downward pressure on the global economy. The trend towards deglobalization has a negative impact on global trade and investment growth, making economic recovery more challenging. The Renminbi's performance is not as expected. The United States has the world's largest trade deficit in goods, reflecting differences between the two countries in terms of industrial structure and competitive advantages. The impact of this on the Renminbi exchange rate is complex and two-sided. A slowdown in trade can lead to volatility in the Renminbi exchange rate, while China's trade surplus provides support for the Renminbi exchange rate.
The 4-hour chart shows that the USD/CNH exchange rate has continued to trade within an upward channel over the past two weeks. Last week, the USD exchange rate briefly rose above the upper channel line at 7.3440, near the high from September 11. Due to the lack of follow-through buying interest in the USD at these levels, the exchange rate retreated to around 7.3250 (the midline of the downward channel) before the weekend. If there is an opportunity for the USD/CNH to move lower and effectively break below 7.3000 (a key psychological level) and the area of support around 7.2895 (the low from October 12), it could confirm a potential reversal of the overall trend, leading to further declines towards the level of 7.2616 (the 89-day moving average). As for the upside, attention should first be on last week's high at 7.3470, with the next level to watch being 7.3650 (the high from September 11) and the previous high at 7.3680.
Weekly Conclusion: In terms of market expectations, the strengthening of the U.S. dollar and expectations of a higher and more prolonged rate hike by the Federal Reserve are likely to weigh on the Renminbi exchange rate. Since the Renminbi exchange rate tends to have a negative correlation with the U.S. dollar index, if the market's expectations of a "higher and longer" rate hike by the Federal Reserve continue to rise and exceed the potential hedging measures that the People's Bank of China may take, it may put downward pressure on the Renminbi exchange rate.
Weekly Expected Range: 7.2616 - 7.3470
Weekly Strategy: Selling the USD on rallies is advisable this week.

Disclaimer:
The information contained herein (1) is proprietary to BCR and/or its content providers; (2) may not be copied or distributed; (3) is not warranted to be accurate, complete or timely; and, (4) does not constitute advice or a recommendation by BCR or its content providers in respect of the investment in financial instruments. Neither BCR or its content providers are responsible for any damages or losses arising from any use of this information. Past performance is no guarantee of future results.
More Coverage


Risk Disclosure:Derivatives are traded over-the-counter on margin, which means they carry a high level of risk and there is a possibility you could lose all of your investment. These products are not suitable for all investors. Please ensure you fully understand the risks and carefully consider your financial situation and trading experience before trading. Seek independent financial advice if necessary before opening an account with BCR.

 English
 简体中文
简体中文
 繁體中文
繁體中文
 Bahasa
Melayu
Bahasa
Melayu
 Tiếng
Việt
Tiếng
Việt
 ไทย
ไทย
 日本語
日本語
 한국어
한국어
 ភាសាខ្មែរ
 español