


0
As the "Israeli-Palestinian conflict" unfolds, the subsequent impact of this conflict on the global political and economic landscape remains to be further observed. Additionally, the shift in tone of several Federal Reserve officials towards a "dovish" stance may serve as an important indicator of the Federal Reserve's potential shift. The APEC summit for this year is scheduled for November 15th in San Francisco, United States, while the Federal Reserve's next interest rate decision will be announced on November 1st, local time. It is expected that a high-level meeting between China and the United States will take place during the APEC summit in November, which could be a key time window for significant changes in the U.S.-China relationship and for the Federal Reserve to signal a policy shift.
The Chief Spokesperson of the Israeli military stated on Friday, October 27th, that the Israeli Air Force and ground forces are intensifying their operations in the Gaza Strip, following reports of intense bombardment in the besieged Gaza Strip. Gold broke through the $2,000 mark in an instant. The price of gold rose from around $1,985 to near $2,000, ultimately reaching an intraday high of $2,009.50 per ounce. The strength of the U.S. dollar and uncertainty about the economic outlook appear to be troubling factors for oil. Due to concerns that the tense situation between Israel and Gaza could escalate into a broader conflict, potentially disrupting global oil supplies, oil prices rose on Friday but ended the week down more than 3%.
Influenced by the sustained strength of the U.S. economy, imbalances in the U.S. bond market, higher inflation expectations, and rising long-term U.S. bond yields, the yield on the 10-year U.S. Treasury bond has surged to a high of 5%. However, at this juncture, major players in the U.S. bond market have shifted their stance. In the current situation, holding long-term U.S. bonds may be a good investment choice over the long term. The U.S. stock market experienced mixed movements last Friday. At the close in New York, the Dow Jones Industrial Average fell by 1.12%, reaching a six-month low, while the S&P 500 index dropped by 0.48%, and the Nasdaq Composite Index rose by 0.38%. The possibility of a significant decline in the U.S. stock market is still significant.
The Federal Reserve and the U.S. government remain optimistic about the U.S. economy or a soft landing. As the risk of war in the "Israeli-Palestinian conflict" increases and with risk aversion, there is the potential for the ongoing U.S. dollar rally to extend further if the yield on the U.S. 10-year Treasury bond surges above 5%. Additionally, the Bank of Japan remains committed to "accommodative monetary policy," and its Yield Curve Control (YCC) policy remains unchanged. The European region is experiencing weak growth, and the Chinese economic recovery is falling short of expectations. Even in the case of a shift in the Federal Reserve's monetary policy, the U.S. dollar may continue to maintain its strength. The strong performance of the U.S. dollar may continue to exert pressure on various currencies. The Japanese yen could test lower levels around 155.00 yen after breaking below 150. The euro may retest 1.0405, the pound could go below 1.20, and the Australian dollar may head towards 0.62. At the same time, caution is needed, as if the upcoming economic data indicates a significant increase in the risk of a U.S. economic downturn, it will release the "dollar depreciation pressure" that is already brewing.
Outlook for the week:
The market is gearing up for a busy week ahead. Not only will the Federal Reserve hold its monetary policy meeting as scheduled, but the Bank of England and the Bank of Japan will also have policy meetings. In addition, inflation data for the Eurozone and employment data for the United States, New Zealand, and Canada will be released. Furthermore, the United States will publish the ISM Services report, and China will release Manufacturing Purchasing Managers' Index (PMI) data. Geopolitical events continue to be a key factor in the market, and investors will continue to monitor corporate earnings results.
This week, the Federal Reserve will announce its monetary policy decision. Market expectations suggest that policy will remain unchanged, with inflation slowing but still above the target. In terms of economic data, the focus will be on employment data, including the ADP Private Employment report on Wednesday, initial jobless claims on Thursday, and the non-farm employment report on Friday. The Employment Cost Index to be released on Tuesday (the day before the Federal Open Market Committee decision) is also very important.
Eurozone inflation data will be published this week, including preliminary data for October. The rebound in inflation rates may change the central bank's outlook, but it may not necessarily boost the euro. The Bank of Japan will announce its monetary policy decision on Tuesday, and there may be news about raising the upper limit for 10-year yield targets. If policy remains unchanged, it could affect the yen and increase concerns about Japanese authorities intervening to curb the yen's weakness.
The Bank of England will hold a monetary policy meeting, with no change expected in the market. This week, Chinese data, including the Purchasing Managers' Index (PMI), will be very important for market sentiment, especially for the Australian dollar. Despite factors such as a strong U.S. dollar, geopolitical issues, and the U.S. economy, the Australian currency still faces pressure, with trading prices approaching monthly lows.
Next week's important event overview (Beijing time):
Monday (October 30): Australian September retail sales month-over-month (%), Eurozone final consumer confidence index for October, Germany's initial consumer price index year-on-year, European Central Bank's Lane speech, and Dallas Federal Reserve Manufacturing Index for October.
Tuesday (October 31): China's official manufacturing and non-manufacturing PMI for October, Bank of Japan monetary policy statement and interest rate decision, and the U.S. Conference Board Consumer Confidence Index for October.
Wednesday (November 1): U.S. API crude oil inventory change (barrels) for the week, U.S. ISM Manufacturing PMI for October, U.S. JOLTs job openings for September, and U.S. ADP employment numbers for October.
Thursday (November 2): U.S. initial jobless claims, Bank of England interest rate decision for November, Bank of England publishes the minutes of the monetary policy meeting, speech by Bank of England Governor Andrew Bailey, U.S. Federal Reserve interest rate decision, and the Federal Reserve's FOMC monetary policy statement.
Friday (November 3): UK Markit Services PMI for October, Eurozone unemployment rate for September, U.S. seasonally adjusted non-farm employment change and unemployment rate for October, U.S. average hourly earnings month-over-month (%), and U.S. ISM Non-Manufacturing PMI for October.
USD
The U.S. Dollar: Good News Not Leading to Gains is a Danger for Bulls.
Last weekend, Israel expanded its ground activities, and Gaza experienced heavy bombing. Gold instantly broke through $2,000, crude oil surged 3%, but the U.S. Dollar Index did not rise; in fact, it declined. Despite a series of better-than-expected economic data released by the U.S. last week, including the U.S. Q3 GDP annualized growth rate, PCE price index, and durable goods orders, the dollar failed to find substantial support, and the U.S. Dollar Index encountered resistance multiple times around the 106.90 level. The dollar has failed to break through the 107 mark. The U.S. Dollar Index traded narrowly around the 106.50 level. It seems the market is skeptical of the GDP data, and there are doubts about whether the U.S. economy is truly as strong as the GDP data suggests. Furthermore, following the stellar GDP data, the probability of another rate hike by the Federal Reserve did not increase; instead, traders intensified their bets on the Fed maintaining rates unchanged for the year. In a situation with many doubts and no boost to expectations of a Fed rate hike this year, it's understandable that the dollar didn't gain support. This could also reflect a risk of exhaustion in the dollar's uptrend. For bulls, good news (at least on the surface) not leading to gains is a danger.
Looking at the weekly chart, the U.S. Dollar Index rose to a high near 114.78 in the week of September 26th last year and continued to decline, reaching a low of 99.57 in the week of July 10th. It rebounded after hitting the low and reached a high near 107.34 in the week of October 2nd but was subsequently blocked and fell to a low of 105.36 last week. However, the U.S. Dollar Index found support in the range between 105.10 (50-week moving average) and 105.50 (23.6% Fibonacci retracement of the move from 99.57 to 107.34) before expanding its decline. In the future, continue to keep an eye on this range, and if it is effectively breached, there may be an increased risk of a temporary peak, with downside targets possibly pointing to the levels around 104.42 (the low in the week of September 11th) and 104.37 (38.2% Fibonacci retracement level). Conversely, if the 107.00 and 107.34 (the high on October 3rd) levels are effectively breached to the upside, the bulls are expected to gain more encouragement, and the future may see further increases toward the levels around 107.55 (a resistance trendline extended from the high in March at 105.88) and 107.80 (the lower boundary of an ascending channel).
Conclusion for the week: In the future, keep an eye on the range between 105.10 (50-week moving average) and 105.50 (23.6% Fibonacci retracement of the move from 99.57 to 107.34). If it is effectively breached, there may be an increased risk of a temporary peak, with downside targets pointing to the levels around 104.42 and 104.37.
Weekly Range: 105.10-107.55 Strategy for the week: Suggest selling the U.S. Dollar Index on rallies this week.

WTI Crude Oil
Rising U.S. Dollar and Economic Uncertainty Troubling Oil Prices
Last week, WTI crude oil exhibited a pattern of initial gains followed by declines, reversing the early-week rally. There were indications that Israel was responding to international calls to prevent a ground invasion of Gaza, while U.S. demand showed signs of weakness. Investors can keep an eye on the meeting of OPEC member countries scheduled for the end of November. Crude oil prices initially rose to just below $88.0 early in the week but later retreated to a low of $81.85 for the week. However, they remained within the trading range formed by the levels of $81.40 to $88.50. Deteriorating prospects in Europe have left oil traders skeptical about whether global oil demand will remain resilient next year. On the other hand, stronger-than-expected U.S. GDP data for the third quarter continued to reflect robust economic growth. The rising U.S. dollar and economic uncertainty appear to be concerning factors for oil. Over the weekend, concerns that the tense situation between Israel and Gaza could escalate into a broader conflict, disrupting global crude oil supplies, led to an increase in oil prices.
The current shape of the oil market does not clearly indicate strength or weakness. On the weekly chart, WTI crude oil prices are still oscillating within the range of $81.40 to $88.50. In the short term, the market intensified the battle for the critical support zone around $81.40 to $81.85. At this crucial moment, the market is waiting for a weekly closing breakout to determine its direction. After repeated testing of last week's low at $81.85 and the vicinity of $81.40, if there is a third touch in this area, there is a possibility of a breakout, and it could potentially form a triple bottom and trigger a rebound. If $81.85 to $81.40 is broken downward, the initial support levels to watch are the 21-week moving average at $80.76, $80.63 (100-day moving average), and the support area composed of $80.60 (October 6th low). If the price continues to fall below $80.00 (a psychological market level), the next downside test could be at $78.62 (150-day moving average). Currently, the upward movement of WTI crude oil prices is being hindered by the 10-week moving average at $86.29 and the resistance zone of $88.65 (formed by extending a resistance trendline from January 18th high of $82.63). Key resistance should be monitored at $89.58 (October 20th high).
Conclusion for the week:
Last week, reports from the London Oil Exchange suggested signs of weakness in the spot oil market, indicating that they are likely to spread to the futures market, pushing down benchmark prices. Demand is now stagnating globally, and the market will witness an increase in crude oil supply from non-OPEC countries.
Weekly Range: $81.85—$88.65. Strategy for the week: Consider buying crude oil on dips this week.

Spot Gold
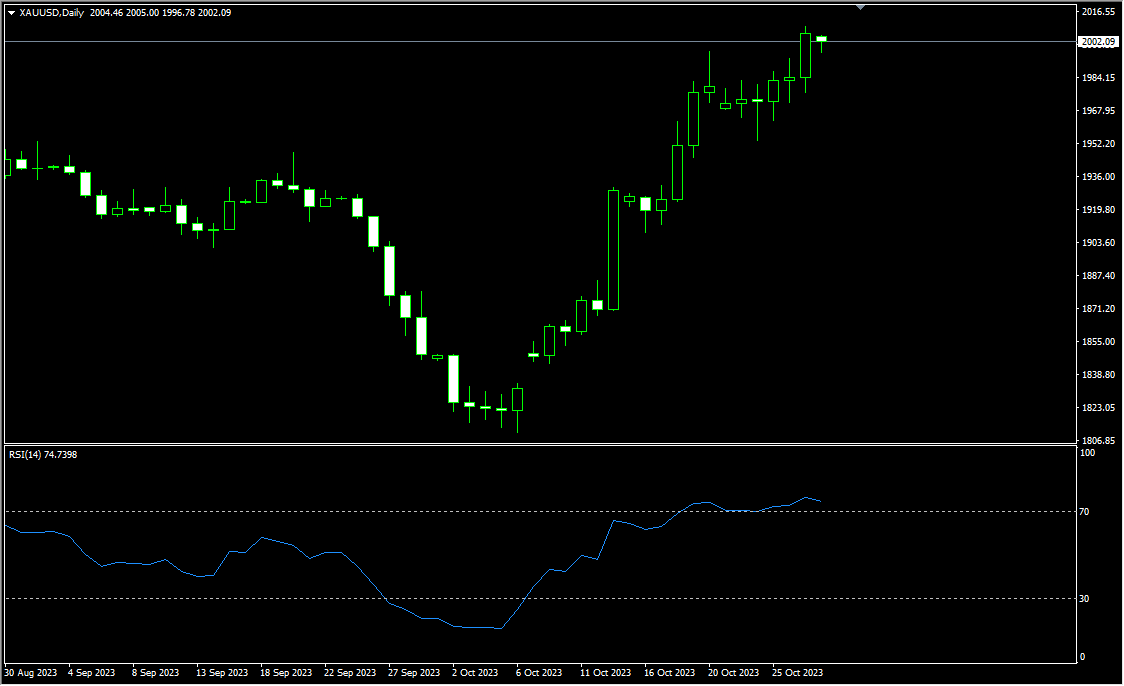
Gold Target Price of $2081.80 Just Around the Corner
Gold hit a record high of around $2081.80 in early May this year but continued to decline. On October 2, it reached a low of $1810.50 and then began to rebound. After the outbreak of the "Israeli-Palestinian conflict," the rally rapidly expanded, breaking through the downtrend channel that had formed from May to September. Last Friday, the Israeli Air Force and ground forces intensified their actions in the Gaza Strip, which had been reportedly under heavy bombardment due to being surrounded. Gold instantly broke through the $2000 psychological barrier, reaching a near five-month high of around $2009.50. Additionally, there were bullish technical signals. A "hidden bullish divergence" has formed between the daily candlestick chart and the RSI indicator from early March to early October. If gold prices continue to rise, they may reach the $2048-$2081 range. Otherwise, a retracement to the $1948-$1930 area could occur. In theory, gold prices have an inverse relationship with real interest rates. Powell's recent remarks have essentially clarified that there will be no rate hike at least at the "November rate meeting." When market expectations for long-term inflation continue to rise, and when the rate of inflation exceeds the rate of interest rate hikes, the expected level of real interest rates is declining, which is why gold has surged. Another reason is the "safe haven sentiment" triggered by the "Israeli-Palestinian conflict," which has fully utilized gold's safe-haven attributes, overshadowing the impact of interest rates.
International and regional conflicts are ongoing, and with the future developments of the "Israeli-Palestinian conflict" and the "Russia-Ukraine conflict" still uncertain, major central banks around the world tend to stabilize their national currencies by increasing their gold reserves, which is favorable for gold. Last weekend, spot gold maintained strong upward momentum, easily surpassing the $2000 mark to reach a near five-month high of around $2009.50. Gold moving averages continue to diverge upward. After a week of minor consolidation, gold has formed a bullish pattern with a golden cross between the 10-week and 50-week moving averages, and it is once again moving towards higher levels. Currently, gold has broken the psychological barrier of $2000, and various technical indicators continue to emit signals in the strongly positive zone, indicating strong bullish momentum. Upward, it will continue to test the $2017.70 level (76.4% Fibonacci retracement from $2081.80 to $1810.50). If it can break through, the next target will be around $2048.50 (double top highs from April and May). Currently, $2000 provides initial support, followed by $1978 (61.8%). If these support levels do not hold, the risk of a pullback increases.
Conclusion for the week: The high probability event is that the Federal Reserve will end this tightening rate hike cycle by 2024. Meanwhile, in the second half of 2024, the expectation of the Federal Reserve starting to cut interest rates may suppress real interest rates and the U.S. dollar index, which is favorable for gold.
Weekly Range: $1978—$2081. Strategy for the week: Consider buying gold on dips this week.
Spot Silver
Gold-to-Silver Ratio Expands to 86.877
Spot silver closed at $23.09 last week, up over 16% from the low of $19.90 in February and briefly exceeding 25% if we consider the high of $25.007 at the end of August. Since early September, silver has seen a sharp pullback to $20.696. However, silver prices have shown signs of heading higher since the outbreak and rapid escalation of the Israeli-Palestinian conflict in October. Given the evolving factors, it's crucial to reevaluate the logic behind silver prices at this juncture. Local conflicts often lead to increased safe-haven sentiment in financial markets, benefiting silver. In the context of the Israeli-Palestinian conflict, besides the impact on absolute prices, changes in the gold-to-silver ratio need attention. In terms of safe-haven sentiment, silver is less valuable than gold. Take last week as an example: silver fell by 1.11% for the entire week, while gold rose by 1.26% and broke the key level of $2000, expanding the gold-to-silver ratio to 86.877. Given the backdrop of the Israeli-Palestinian conflict, silver is expected to rise rather than fall. Looking at the logic of precious metals, there may be some short-term changes, but the medium to long term is still expected to move in favor of silver prices. Silver's characteristics include higher volatility compared to other commodities like gold, so both bullish and bearish sentiments will be influenced by shifts in fund flows, which are reflected in the market ahead of time. Spot silver closed at $23.09 last week, up over 16% from the low of $19.90 in February and briefly exceeding 25% if we consider the high of $25.007 at the end of August. It fell 1.11% last week, but the closing formed a "hammer" bullish pattern. It is expected that at the beginning of this week, silver prices may test the initial resistance zone of $23.31 (50-week moving average) and $23.41 (50% Fibonacci retracement from $26.135 to $20.688). After a breakthrough, attention can be shifted to $24.05 (61.8% Fibonacci retracement) and $24.30 (upper channel line). As for the downside, first consider $22.76 (38.2% Fibonacci retracement) and $22.65 (mid-channel line). Once the above support areas are broken by the bears, the next target could be $21.05 (lower channel line).
Conclusion for the week: In the context of the Israeli-Palestinian conflict, silver is expected to rise rather than fall, and at the beginning of this week, silver prices may test the initial resistance zone of $23.31.
Weekly Range: $22.30—$24.05. Strategy for the week: Consider buying silver on dips this week.

AUDUSD
Short-Term Australian Dollar Faces Significant Selling Pressure
Last week, the Australian Dollar (AUD) to US Dollar (USD) exchange rate experienced a sharp decline to the lowest levels since 2022, briefly touching 0.6270. However, it rebounded slightly above 0.6350 towards the end of the week, indicating a highly volatile and unpredictable market. Due to the unstable market conditions and challenging circumstances, geopolitical concerns continue to play a significant role in driving investments towards the stable US Dollar, further enhancing the appeal of the USD. As a result, the Australian Dollar is under significant pressure, making recovery difficult. Nevertheless, there seems to be a glimmer of hope as the currency has fallen to extremely low levels, suggesting a potential rebound. Historical trends indicate that each rebound is met with strong selling, forming a cycle that can offer substantial opportunities for traders. An important resistance area to watch is the 0.64 level, which has been repeatedly tested and remains a key obstacle. Surprisingly high inflation data released last Wednesday, which was in line with policymakers' expectations, has raised the question of whether there is a reason to raise interest rates. Interest rate futures responded by increasing the probability of a rate hike at the November 7 meeting from around 35% before the data was published to about 63%.
From the weekly chart, the AUD/USD fell below 0.6300 (a key psychological level) last week but found short-term support around 0.6270 (the support line of a descending triangle) and 0.6245 (the lower boundary of a descending wedge), acting as a market "bottom." This week, the presence of 0.6360 (the upper boundary of the descending wedge) and 0.6368 (last Friday's high) adds an additional layer of resistance, reinforcing the idea that the market is likely to continue facing upward pressure. If it manages to break above 0.64 (the resistance line of the descending triangle, also last Wednesday's high), it may pave the way for the market to target the 0.6511 level (the high from September 21), which has significant psychological significance and may attract more buying interest. On the other hand, a drop below the 0.6270-0.6245 area could trigger a selling wave, pushing the market towards the 0.6170 level (the 2022 low) and possibly down to the 0.60 level (another key psychological level).
Conclusion for the week: Although the fate of the Australian Dollar is closely tied to global economic growth and the commodity markets, the prevailing "sell the rallies" sentiment suggests that selling opportunities may persist unless any unforeseen developments occur.
Weekly Range: 0.6200-0.6446. Strategy for the week: Consider selling the Australian Dollar on rallies.

USDJPY
The US Dollar Hit a 1-Year High at 150.78 Against the Japanese Yen Last Week
Last Thursday (October 26th), the USD/JPY exchange rate briefly fell below the key level of 150 to 150.78, marking a one-year high. This has raised the possibility of Japanese government intervention in the foreign exchange market and has put pressure on the Bank of Japan to tighten its policies. Last year, when the yen exchange rate fell below 150, touching a 32-year low, the Japanese government intervened with up to $600 billion to boost the yen. As a result, this new drop below 150 has sparked speculation among investors about the possibility of further government intervention in the currency market. On October 3rd this month, the yen exchange rate also dropped to a low of 150.16 but then rebounded significantly, and the Japanese government did not intervene at that time. Unlike the situation in October last year, this time most of the depreciation pressure on the yen comes from the widening interest rate spread between Japan and the United States. Currently, the Bank of Japan is the only major central bank that maintains a negative interest rate policy, while most other major central banks, especially the Federal Reserve, have carried out a series of significant interest rate hikes. In this context, the yen has slumped against the US dollar, making it one of the worst-performing currencies in Asia this year. Year-to-date, the yen has already fallen by more than 12%. The Bank of Japan has essentially maintained its dovish stance over the past year, citing the need for further economic support. The Bank of Japan has also maintained its controversial yield curve control policy and intervened in the bond market earlier this month to curb the rise in Japanese government bond yields. However, media reports suggest that the Bank of Japan is currently considering changing its yield curve control policy to better align with US interest rates, which could boost the yen.
The USD/JPY continued to rise for four consecutive trading days last week and surpassed the 150.00 psychological level, but it retreated sharply by 100 pips from its high of 150.78 to 149.46 before the weekend. Currently, it is still holding below the 150 level. On the daily chart, the USD/JPY is trading below the 10-day moving average at 149.86 and above the 50-day moving average at 148.18, indicating a bullish bias. If the USD/JPY manages to break above 150.00 again, as well as 150.78 (last week's high), it's important to watch for potential intervention by the Bank of Japan. If the Bank of Japan does intervene in the market, significant support levels may be found at the 50-day moving average at 148.18, followed by 145.90 (September 11th low) and the 146.00 psychological support area. On the upside, should the USD/JPY break last week's high of 150.78, it could retest the 151.70 level (the upper boundary of the upward channel) and the previous high at 151.94.
Conclusion for the week: Looking ahead, investors should closely monitor the Bank of Japan's monetary policy meeting scheduled for this week, although the Bank of Japan is unlikely to change its dovish stance. Therefore, the USD/JPY exchange rate is expected to continue pushing higher in the near term. Weekly Range: 146.00-151.00. Strategy for the week: Consider selling the US Dollar on rallies.

GBPUSD
The British Pound is approaching a retreat to 1.20
In recent months, the British Pound has faced significant pressure from the US Dollar, which has strengthened due to the consistent tightening of monetary policy by the Federal Reserve. Geopolitical concerns have also played a role in channeling funds towards the United States, thereby boosting the US Dollar's exchange rate. Robust US bond yields only increase its appeal, attracting traders seeking yield. Against the backdrop of economic difficulties and geopolitical uncertainties, the British Pound is facing ongoing downward pressure. While short-term technical rebounds are possible, given the recent trend of unexpected upside surprises in US data such as non-farm payrolls, US retail sales, PCE, and even GDP, new unexpected upside data releases may further stimulate the US Dollar. In the absence of bullish momentum for the British Pound ahead of favorable US data, the broader trend remains bearish, especially considering recent disappointing economic data from the UK. In this environment, the prevailing sentiment continues to favor selling on rallies, a strategy that has been successful in various US Dollar-denominated currency pairs. With the passage of time, the likelihood of a further collapse in the British Pound is increasing, with a retreat to the psychological level of 1.20 imminent.
As seen on the daily chart, the British Pound rebounded to a high of 1.2288 last Tuesday but was rejected at the 38-day moving average (reported at 1.2295), and the daily chart closed with a bearish naked bar, suggesting possible further declines. However, the US Dollar strengthened at the end of last week, leading to a drop in the GBP/USD exchange rate, which briefly reached a three-week low of 1.2070. Although it closed slightly above 1.21 before the weekend. Nevertheless, the weekly chart shows a "head and shoulders" pattern and a "death cross" double bearish signal. If the levels of 1.2070 (last week's low) and 1.2037 (October 4th low) are breached, the British Pound's future direction may lead to a drop towards the psychological level of 1.20. If the fundamentals align, breaking below 1.2000 could trigger a swift plunge in the British Pound, further opening the door to a retreat to 1.1850, a key support area that has been tested multiple times. On the upside, if the Federal Reserve makes dovish comments again after its interest rate decision, the GBP/USD has the opportunity to rebound to 1.2202 (30-day moving average) and 1.2260 (resistance trendline extended from the July high of 1.3143).
Conclusion for the week: The British Pound experiences brief rebounds only to give back gains quickly, succumbing to continued downward pressure. A bearish flag pattern seems to be forming as market dynamics continue to unfold. A critical moment for traders to watch is the breakthrough below the recent volatility low of 1.20.
Weekly Range: 1.2000-1.2260. Strategy for the week: Consider selling the British Pound on rallies.

EURUSD
Short-term Rebound of Euro Faces Challenges
After touching a monthly high of 1.0694 last week, the Euro against the US Dollar encountered resistance at 1.0690 and 1.0685, which are the convergence points of the 55-week (1.0690) and 100-week (1.0685) simple moving averages. It then retreated to below 1.05, indicating a potential further weakness in this currency pair. The imminent economic recession in the European Union is one of the significant factors seriously impacting the future of the Euro, with Germany preparing to face significant challenges in the coming winter. These economic forecasts, along with the Federal Reserve's commitment to maintaining high interest rates in the United States for an extended period, are attracting investors towards the US Dollar, making it more appealing. Furthermore, the European Central Bank is likely to adopt more flexible monetary policies in the short term compared to the Federal Reserve. This policy divergence increases the downward pressure on the Euro. Technical charts show a clear downward trend. Despite recent volatility, the overall trend appears favorable for further declines. The Euro has been struggling to gain sustainable momentum. Given the current economic challenges and policy differences between the Eurozone and the United States, the path of least resistance for the Euro seems to be on the downside.
The weekly chart shows that the Euro/US Dollar retraced from its high last week, closing with a long upper shadow doji star bearish pattern. The future faces ongoing challenges, intensifying the prevailing bearish sentiment in the market. The Euro has been trapped in a volatile environment and seems to be forming a bearish trend within a downward channel. If the Euro falls towards 1.0522 (last week's low) and 1.0500 (psychological level), it may even drop to the key support level of 1.0448 (October 3rd low). The level of 1.0250 (lower boundary of the downward channel) is a crucial near-term support area for the Euro. A break below this level may lead to further declines, possibly even reaching parity (1.00). On the other hand, the upside may first consider 1.0610 (38.2% Fibonacci retracement level of the move from 0.9535 to 1.1275), followed by the moderate resistance of the 50-day moving average at 1.0763. A decisive breakthrough of this level can be seen as a bullish signal. While this scenario is not easy to predict, it is worth considering as a possible alternative outcome.
Conclusion for the week: The Euro's journey remains turbulent, with a dominant bearish trend. Despite the potential for unexpected reversals, the broader economic backdrop and political nuances suggest that the Euro's struggle is far from over, making it a cautious market for traders.
Weekly Range: 1.0448-1.0763 Strategy for the week: Continue to consider selling the Euro on rallies.

USDCNH
China's Trade Surplus Supports the Renminbi
Last week, China announced the issuance of 1 trillion yuan in government bonds, primarily for infrastructure development. This move is expected to alleviate issues with local special bonds and boost consumer demand. The national fiscal deficit rate will increase from 3% to around 3.8%, with profound implications. The A-shares recorded an intraday gain, but the offshore renminbi (CNH) exchange rate remained relatively stable. China appointed a new Minister of Finance, Liao Fu'an, which has sparked various speculations in the market. Given the issuance of special government bonds, how the new finance minister will utilize these funds becomes a focal point of interest. Additionally, the increase in the national fiscal deficit rate from 3% to around 3.8% breaks the previous pattern of a long-term deficit rate below 3%, known as the international warning line. The size of the deficit to be announced by the Ministry of Finance next year will also be closely watched. Since the Political Bureau meeting in July, the authorities have introduced a series of supportive measures, including interest rate cuts, reserve requirement ratio reductions, ongoing adjustments and optimization of real estate policies, reductions in first-time homebuyer mortgage rates, and reductions in foreign exchange deposit reserve ratios. These measures aim to stimulate economic recovery and restore market confidence. If this trend continues, market confidence in economic growth may be just around the corner.
The offshore renminbi (CNH) has not shown significant changes against the US dollar. Currently, it is still trading slightly below the previous high of 7.3470 and the resistance level of 7.3565 (the upper boundary of the sideways channel). As such, the exchange rate seems to have ended the uptrend that began in early 2023, and it may find it difficult to break above the resistance levels in the near future. The US dollar against the offshore renminbi is expected to start a sideways consolidation trend. The daily chart shows that the USD/CNH exchange rate has been in a narrow trading range within a sideways channel for the past month and a half, with high and low levels at 7.3565 and 7.2990, respectively. This pattern typically indicates a lack of a clear short-term trend, and if there is a breakout to the upside or downside, it could give rise to a one-sided trend, thereby increasing the possibility of a trend reversal. If the USD/CNH rate continues to fall below 7.30 (a psychological level) and 7.2990 (the lower boundary of the sideways channel), the downside direction may target the support areas around 7.2916 (65-day moving average), 7.2697 (October 10th low), and 7.2421 (50% Fibonacci retracement of the move from 7.1160 to 7.3682). If there is a rebound, the upper resistance levels to watch include 7.3565 (the upper boundary of the sideways channel) and 7.3682 (September 8th high).
Conclusion for the week: Based on market expectations, if China's economy continues to recover and restore market confidence, renewed confidence in economic growth may be on the horizon. A return to an uptrend for the renminbi exchange rate may also be in the cards.
Weekly Range: 7.2697-7.3565 Strategy for the week: Consider selling the US dollar on rallies this week.

Disclaimer:
The information contained herein (1) is proprietary to BCR and/or its content providers; (2) may not be copied or distributed; (3) is not warranted to be accurate, complete or timely; and, (4) does not constitute advice or a recommendation by BCR or its content providers in respect of the investment in financial instruments. Neither BCR or its content providers are responsible for any damages or losses arising from any use of this information. Past performance is no guarantee of future results.
More Coverage


Risk Disclosure:Derivatives are traded over-the-counter on margin, which means they carry a high level of risk and there is a possibility you could lose all of your investment. These products are not suitable for all investors. Please ensure you fully understand the risks and carefully consider your financial situation and trading experience before trading. Seek independent financial advice if necessary before opening an account with BCR.

 English
 简体中文
简体中文
 繁體中文
繁體中文
 Bahasa
Melayu
Bahasa
Melayu
 Tiếng
Việt
Tiếng
Việt
 ไทย
ไทย
 日本語
日本語
 한국어
한국어
 ភាសាខ្មែរ
 español