


0
US Dollar Index
The dollar index held recent gains around 98.85 on Wednesday, having pared early losses after Federal Reserve Chairman Jerome Powell warned that tariffs could lead to significant price increases. As expected, the Fed kept the federal funds rate steady for the fourth consecutive meeting. However, the Fed adjusted its outlook, reflecting faster inflation and slower economic growth this year and next. Still, the Fed maintained its guidance for two 25 basis point rate cuts in 2025, surprising some investors who had expected only one rate cut. The conflict between Israel and Iran has escalated. President Donald Trump has further heightened geopolitical tensions, demanding "unconditional surrender" from Iran. On the economic front, U.S. retail sales data for May came in below expectations, although underlying consumer spending remained strong, supported by wage growth.
Against the backdrop of heightened global uncertainty, the dollar's role as a traditional safe-haven currency has come under the spotlight. Although the dollar has generally risen in recent trading, the market is cautious about the sustainability of the trend. Daily momentum shows a slight bearish bias, while the 14-day relative strength index (RSI) of the technical indicator shows signs of recovering from a near oversold state. The technical downtrend of the US dollar index remains intact and the outlook remains negative. Resistance is at 99.00{integer mark}, and 99.50. Support is at 98.50, and if it breaks, it will test 98.00{integer mark}, area.
Today, you can consider shorting the US dollar index around 99.00, stop loss: 99.10, target: 98.50, 98.40

WTI spot crude oil
WTI crude oil rose nearly 1% on Wednesday, trading around $73.85/barrel before pulling back to $73.00. Oil prices benefited from geopolitical tensions while also benefiting from API showing that inventory data fell by more than 10 million barrels, the largest weekly drop since the week of August 25, 2023. Oil prices climbed more than 5% on Tuesday as the conflict between Iran and Israel continues with no end in sight, although key oil and gas infrastructure and trade have not been materially affected so far. The Iran-Israel conflict remains a key factor supporting oil prices. As OPEC's third-largest oil producer, Iran faces scrutiny over whether escalating tensions will threaten its crude exports. Although there is no direct evidence of supply disruptions, traders remain cautious given the strategic importance of the Strait of Hormuz, through which about 19 million barrels of oil and refined products pass every day.
WTI crude oil rose, rebounding from Monday's sharp drop, with geopolitical risks and key technical levels dominating market sentiment. The 14-day relative strength index (RSI), a technical indicator on the daily chart, is around 73.50, indicating increased momentum. The rebound encountered immediate resistance near last week's high of $74.74, with stronger resistance ahead at $76.27 {January 22 high}. On the downside, focus on $71.26 {5-day simple moving average}, and the psychological level of $70.00. If the decline continues, oil prices will continue to fall below $68.28 {200-day simple moving average}, and will always face the possibility of a correction to $67.07 {50.0% Fibonacci rebound from $79.37 to $54.78}.
Today, you can consider going long on WTI crude oil around 72.80, stop loss: 72.60, target: 74.500, 75.00

Spot gold
Gold spot gold traded around $3,370/ounce on Wednesday; geopolitical tensions in the Middle East continued, and Iran's Supreme Leader Khamenei said that Israel must be hit hard and never compromised. Geopolitical uncertainty and the possibility that the Israeli-Iranian war may escalate and then ease will provide support for market safe-haven buying. As the Israeli-Iranian air war continued for the fifth day, US President Trump said he hoped the nuclear dispute with Iran would be "truly over" and said he might send senior US officials to meet with Iranian officials. Also, if the US gets close to defaulting, as it has happened a few times in the past, that in itself is very bullish for gold. But if the debt ceiling is raised, they start issuing 10-year and 20-year bonds, and even some 30-year bonds, and the Fed ends up being the main buyer, that is very bullish for gold. Quantitative easing is just insanely bullish for gold because it is pumping money into the economy and setting off an inflationary spiral.
The uptrend in gold prices remains intact and the trend continues to improve, forming a series of higher highs and lower lows. Any pullback can be seen as a buying opportunity, and the momentum measured by the 14-day relative strength index (RSI), a technical indicator on the daily chart, remains bullish. Therefore, the first resistance level for the XAU/USD will be around $3,400, followed by $3,450 and $3,452 {early week high} area. The next level is the all-time high of $3,500. Conversely, if XAU/USD stays below the $3,400 round mark, the pullback could extend to $3,360 {14-day simple moving average}, or even lower. The next key support will be the 34-day simple moving average at $3,320.
Consider going long on gold near $3,365 today, stop loss: 3,360, target: 3,390, 3,395

AUD/USD
The Australian dollar appreciated to around $0.6500 on Wednesday, recovering some of the losses from the previous session, as oil prices rose, supported demand for commodity-related currencies driven by geopolitical tensions. The conflict between Israel and Iran entered its sixth day, with President Trump demanding Iran's unconditional surrender and hinting at possible US intervention, and market anxiety escalated. In response, oil prices continued to climb, providing support for the Australian dollar due to its close correlation with commodity markets. However, the Australian dollar may find it difficult to maintain its position as Israel and Iran continue to attack each other. Meanwhile, the latest data showed that Australia's leading economic index fell 0.1% in May, indicating a fragile economic recovery amid rising domestic pressures and sluggish demand. The focus now turns to Thursday's labor market data, which could provide fresh impetus to the economy and influence market expectations of the RBA's policy outlook.
On Wednesday, the AUD/USD pair rebounded to a high of around 0.6500, and technical analysis on the daily chart shows that the pair is still within an ascending channel with an overall bullish bias. In addition, the 14-day relative strength index (RSI) of the technical indicator is slightly above 50, indicating a bullish outlook. However, the pair failed to break above this week's high of 0.6552, indicating that short-term price momentum is weakening and poses immediate resistance. A subsequent break above this level may support the pair to target the high of 0.6581 on November 12 last year, and then 0.6600 {market psychological level}. On the downside, the AUD/USD pair may target the 50-day simple moving average of around 0.6431. A break below this level will weaken the bullish bias and prompt the pair to test the 0.6400 round number level.
Consider going long on AUD near 0.6490 today, stop loss: 0.6478, target: 0.6540, 0.6550

GBP/USD
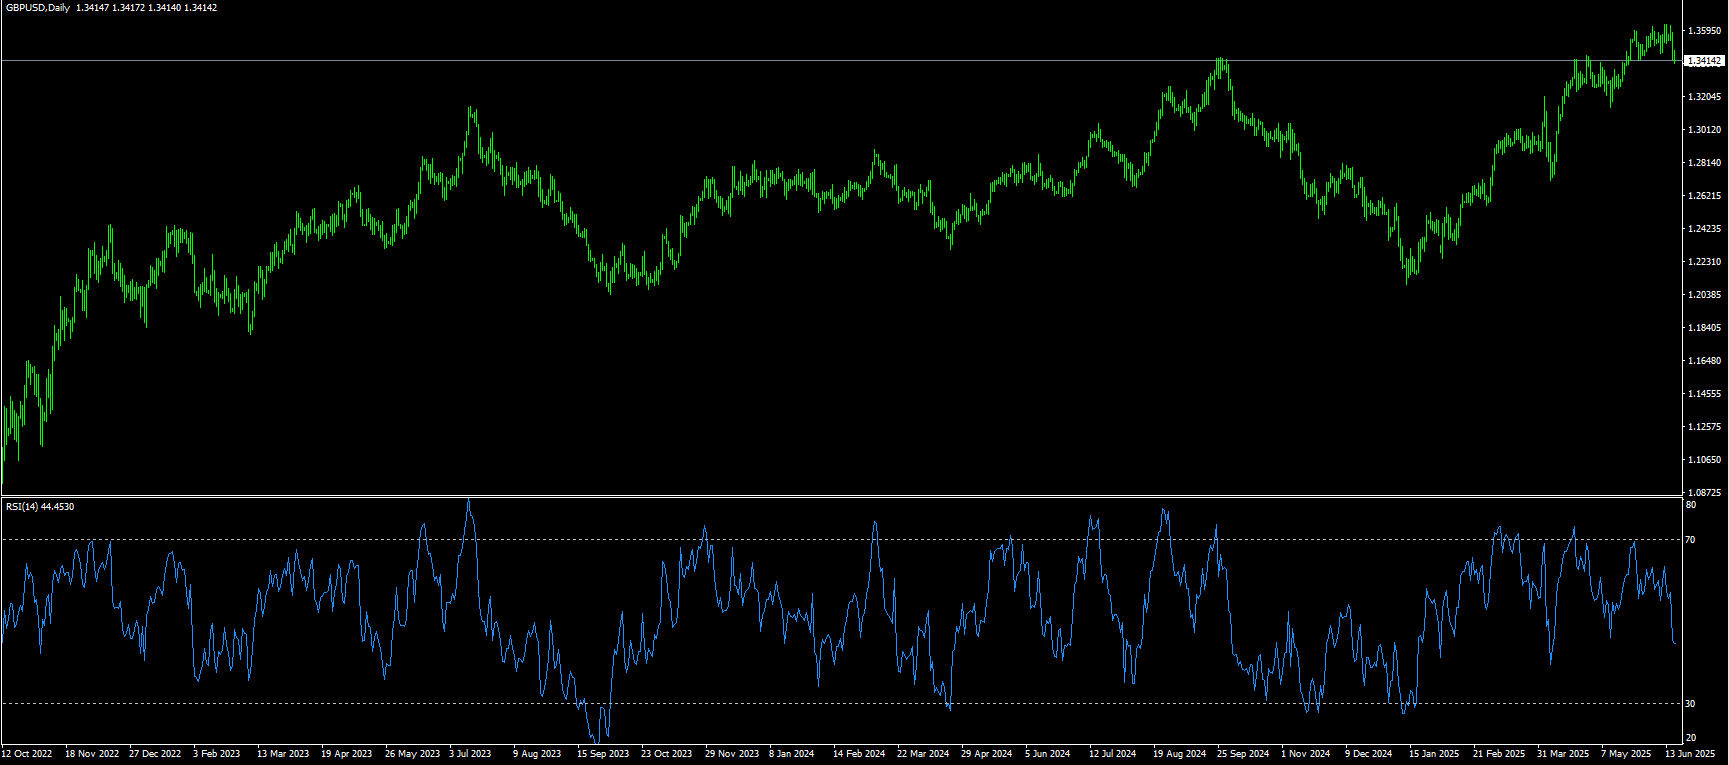
GBP/USD lacks clear intraday directional bias and oscillates around 1.3400 during Tuesday's session, waiting to see key data/central bank event risk before it is released in order to prepare for the next directional move. UK consumer inflation data will be released on Wednesday, followed by a key Bank of England policy meeting on Thursday, which will affect the pound. In addition, the Fed's interest rate decision on Wednesday will boost the dollar in the short term and provide some meaningful momentum to the GBP/USD pair. In addition, the growing geopolitical tensions in the Middle East also support the dollar's relative safe-haven status and limit the upside of the GBP/USD pair.
With GBP/USD falling to 1.3400 on Wednesday, GBP/USD may face a correction, opening the door to challenge the May 29 low of 1.3414, and 1.3400 {round mark}. Once it is clearly broken, the next support level will be the 50-day simple moving average at 1.3380. A new downtrend is expected to resume near the 50-day simple moving average to 1.3350, as well as 1.3300 {market psychological level}, provided that the bearish momentum continues. GBP/USD tends to weaken in bearish rallies in 2025, and the currency pair still draws technical support from the rising trend line near 1.2100. Conversely, if GBP/USD recaptures the 26-day simple moving average at 1.3479, it is expected to test the 1.3500 round number. A break of the latter will expose the yearly high of 1.3632.
Consider going long on GBP near 1.3400 today, stop loss: 1.3385, target: 1.3460, 1.3470
USD/JPY
The yen rebounded after approaching the monthly low during the Asian session on the broad weakness of the US dollar, and now seems to have ended a three-day downtrend. Investors remain wary due to ongoing trade-related uncertainties and rising geopolitical tensions, which in turn provides some support to the safe-haven yen. However, various factors may hinder yen bulls from making aggressive bets.
The Bank of Japan has taken a cautious approach to unwinding its decade-long monetary stimulus amid economic growth uncertainty. This has forced investors to postpone expectations for the next BoJ rate hike to the first quarter of 2026. Moreover, the failure of U.S. President Donald Trump and Japanese Prime Minister Shigeru Ishiba to reach a breakthrough on tariffs at the G7 summit may limit the yen's upside ahead of the key FOMC policy decision.
From a technical perspective, the overnight breakout and daily close above the 145.00 psychological mark may be seen as a new trigger for USD/JPY bulls. Moreover, oscillators on the daily chart have just started to gain positive momentum, suggesting that the path of least resistance for spot prices is to the upside. Further buying above the monthly swing highs in the 145.45 area would confirm the constructive outlook and allow the pair to conquer the 146.25-146.30 area or the May 29 high before targeting the 146.00 round mark. On the other hand, a correction below 145.00 could attract some bargain-hunting buyers and find good support in the 144.50-144.45 area, below which USD/JPY could slide to the 144.00 mark. A successful breakout of the latter would expose the next relevant support in the 143.55-143.50 area, and ultimately the price could fall to the 143.00 round mark.
Today, consider shorting the US dollar around 145.40, stop loss: 145.70, target: 144.30, 144.20

EUR/USD
During the Asian trading session on Wednesday, EUR/USD attracted some buyers, approaching 1.1500. A string of weak U.S. economic data weighed on the dollar. However, escalating Israel-Iran tensions could limit upside for this major currency pair. The U.S. Federal Reserve's interest rate decision will be closely watched later on Wednesday. USD/EUR weakened as trade policy dented confidence in the U.S. economy. The common currency was supported by the hawkish tone of ECB policymakers. ECB President Christine Lagarde said rate cuts are coming to an end as the central bank is now "well positioned" to deal with current uncertainties. Meanwhile, investors will be watching geopolitical risks. Israel plans to step up its attacks on Tehran, while the United States considers expanding its role as tensions between Israel and Iran rise. Any signs of escalation could drive safe-haven inflows, benefiting the dollar.
In terms of technicals this week, EUR/USD's upward trajectory will continue despite a persistent pullback that briefly dragged spot prices below 1.1500. Buyers are taking a break, as shown by the 14-day relative strength index (RSI), a technical indicator on the daily chart, which suggests that bullish momentum is fading. This could pave the way for a pullback to 1.1423{20-day SMA}, or lower to 1.1400 which would be the next target. Conversely, if EUR/USD bulls retake 1.1500, immediate resistance appears at 1.1550. Next is 1.1600{market psychological barrier}.
Consider going long on EUR near 1.1472 today, stop loss: 1.1460, target: 1.1530, 1.1540

Disclaimer: The information contained herein (1) is proprietary to BCR and/or its content providers; (2) may not be copied or distributed; (3) is not warranted to be accurate, complete or timely; and, (4) does not constitute advice or a recommendation by BCR or its content providers in respect of the investment in financial instruments. Neither BCR or its content providers are responsible for any damages or losses arising from any use of this information. Past performance is no guarantee of future results.
More Coverage


Risk Disclosure:Derivatives are traded over-the-counter on margin, which means they carry a high level of risk and there is a possibility you could lose all of your investment. These products are not suitable for all investors. Please ensure you fully understand the risks and carefully consider your financial situation and trading experience before trading. Seek independent financial advice if necessary before opening an account with BCR.

 English
 简体中文
简体中文
 繁體中文
繁體中文
 Bahasa
Melayu
Bahasa
Melayu
 Tiếng
Việt
Tiếng
Việt
 ไทย
ไทย
 日本語
日本語
 한국어
한국어
 ភាសាខ្មែរ
 español