


0
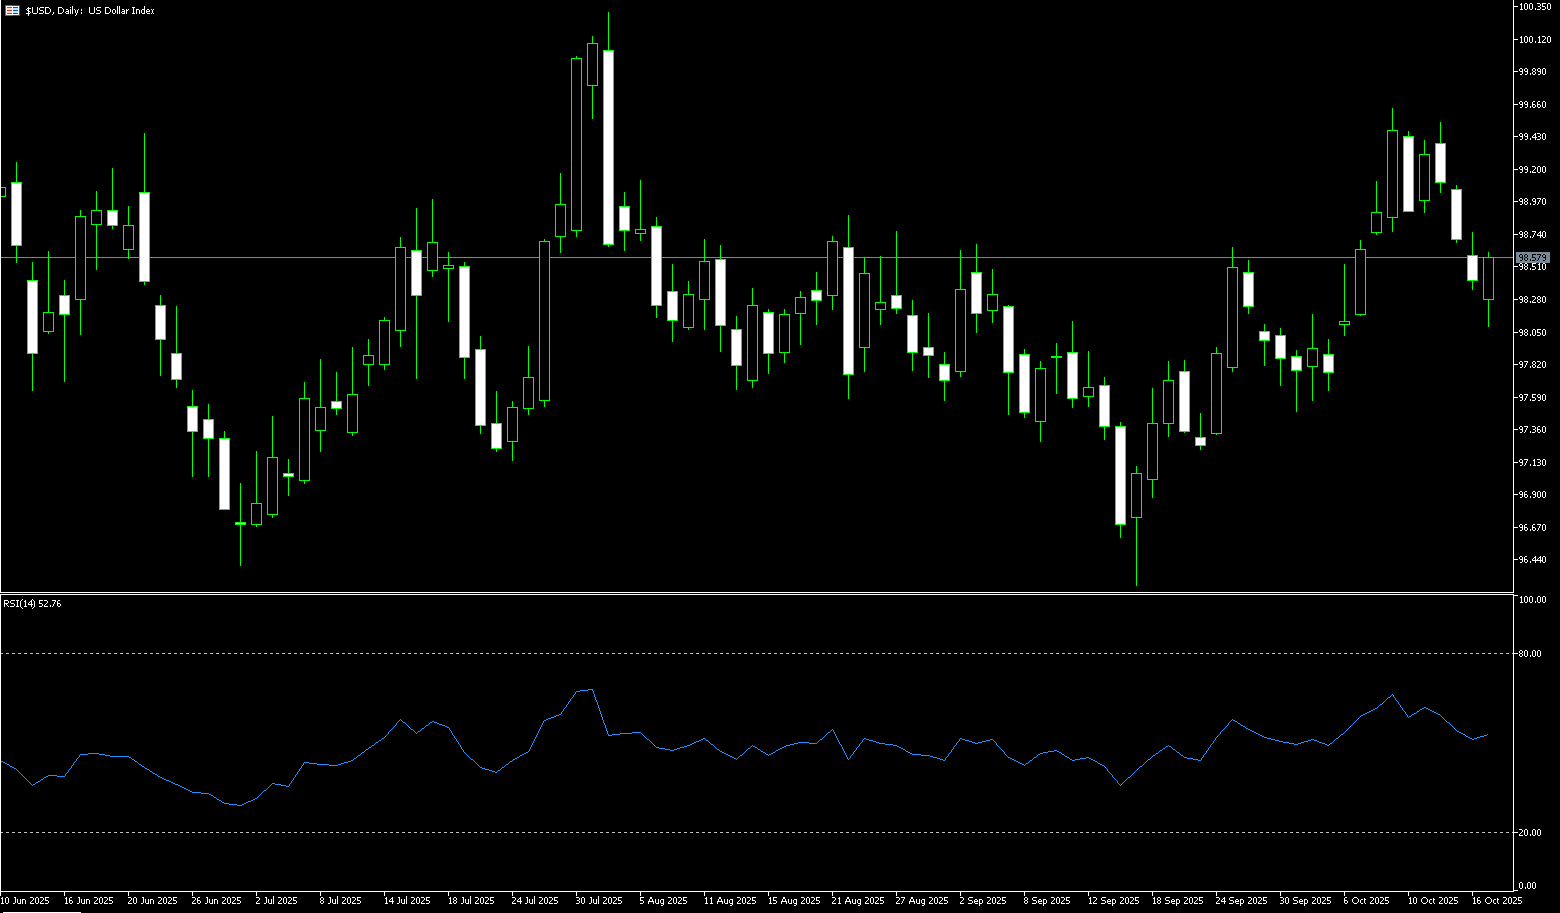
US Dollar Index
The US dollar index briefly hit 98.03 last week, its lowest level since October 6th, after President Donald Trump stated that high tariffs on Chinese goods would not remain in place for long. These comments suggest a possible thaw in US-China trade relations ahead of Trump's upcoming meeting with Chinese President Xi Jinping. Last week, Trump threatened to impose an additional 100% tariff on Chinese imports before November 1st due to Beijing's tightening controls on rare earth exports. Despite Friday's gains, the dollar is facing a weekly loss of 0.3% to 98.55, weighed down by the ongoing US government shutdown, renewed concerns about regional banking problems, and growing expectations of a Federal Reserve rate cut. On Thursday, Federal Reserve Governor Christopher Waller expressed support for another rate cut this month due to rising labor market risks, while Federal Reserve Governor Stephen Milan advocated for more aggressive policy easing to support economic growth momentum. Furthermore, the dollar's overall performance is mixed, with continued weakness. Short-term weakness is expected to be sufficient to indicate a temporary pause in the dollar index's rebound since mid-September.
The impact of the pause in federal data releases, which has reduced economic transparency, is increasing downside risks for the US dollar index. If the US dollar index falls below 98.24 (the 50.0% Fibonacci retracement level from 100.26 to 96.22), further support at 98.05 (the 50-day simple moving average) and 98.00 (the round number mark) could be reached. A sustained break below this support level could lead to further declines to 97.46 (the October 1 low) and 97.17 (the 50.0% Fibonacci retracement level from 100.26 to 96.22). The 97.00 round number mark has become a key pivot point, reflecting hesitation among both bulls and bears. Furthermore, the 14-day relative strength index (RSI) is approaching 49, supporting a stalemate at the current price level, with bears currently holding a slight advantage. Conversely, if the US Dollar Index rebounds above 98.71 (the 61.8% Fibonacci retracement level) and 98.77 (the 10-day simple moving average), it could retest the 99.00 level. A further recapture of this level would strengthen the bullish bias towards 99.56 (a near two-month high).
Today, consider shorting the US Dollar Index at 98.68, with a stop-loss at 98.80 and targets at 98.20 and 98.10.
WTI Spot Crude Oil
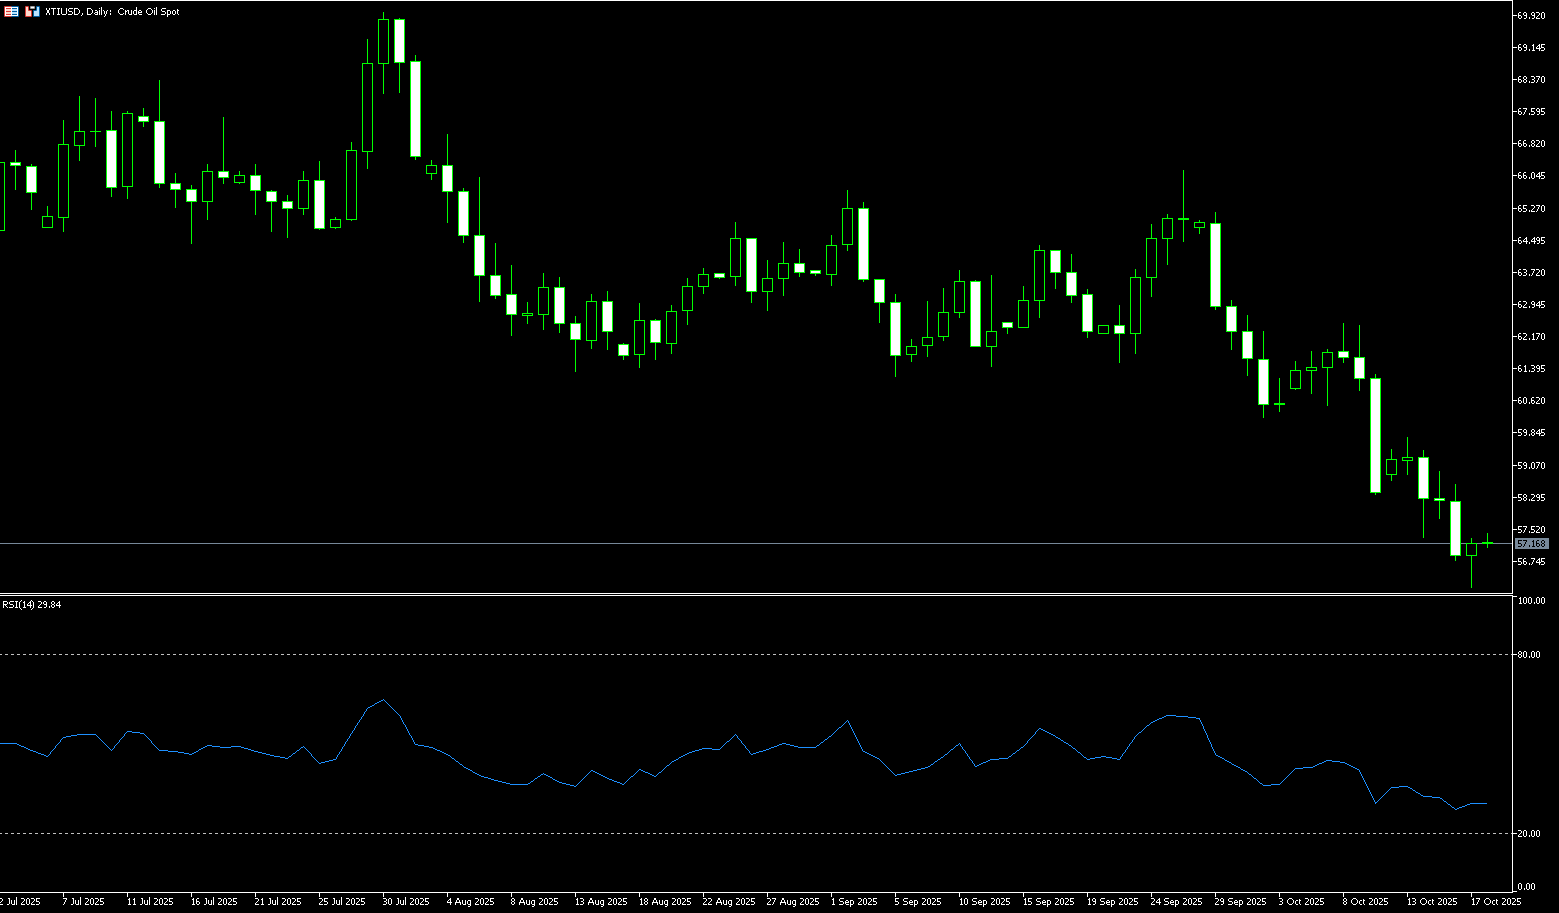
Last week, international oil prices came under downward pressure. Brent and WTI crude oil closed their third consecutive weekly decline, recording a weekly drop of over 1.0%. Market concerns about a potential oversupply in 2026 intensified, while news of a planned meeting between US and Russian leaders to discuss ending the conflict in Ukraine eased expectations of global energy tensions. Combined with a significant increase in US crude oil inventories and record-high production, this has further limited the potential for a rebound in oil prices. Market analysts point out that the International Energy Agency's latest report suggests a potential global energy market oversupply by 2026, prompting investors to lower their medium- and long-term oil price expectations. Meanwhile, the upcoming US-Russia diplomatic meeting has become a key turning point in the oil market this week. US and Russian leaders plan to meet in Budapest within two weeks to discuss a possible end to the conflict in Ukraine. This news has somewhat alleviated market concerns about energy supply constraints. Following the announcement of the meeting, market concerns about supply constraints have eased, limiting short-term upward momentum for oil prices.
If the US-China tariff talks over the next two weeks yield positive signals, oil prices may see a temporary correction before the end of the year, but the overall trend remains moderately downward. Technically, the weekly chart of US WTI crude oil shows that crude oil prices have remained below their 20-week simple moving average (latest price: 64.21) for two consecutive weeks, regardless of closing price or high, indicating a short-term weak consolidation pattern. The weekly MACD indicator continues to expand, indicating a dominant bearish momentum. The 14-week RSI remains below 40, reflecting weak market sentiment. If oil prices fall below $56.14 (last week's low) and $56.12 (May 1st low) this week, bears may accelerate their decline to $54.78 (a near four-year low) and $54.00 (a round-figure mark). From another perspective, if oil prices re-cross above $58.60 (October 16th high), upward pressure will be concentrated between $59.75 (last week's high) and the psychologically important $60.00 level. A break above the $60.00-$59.90 resistance zone could lead to a modest rebound to $61.61 (the 9-week simple moving average).
Consider going long on crude oil at 57.05 today. Stop-loss: 56.90. Target: 58.50, 58.70.
Spot Gold
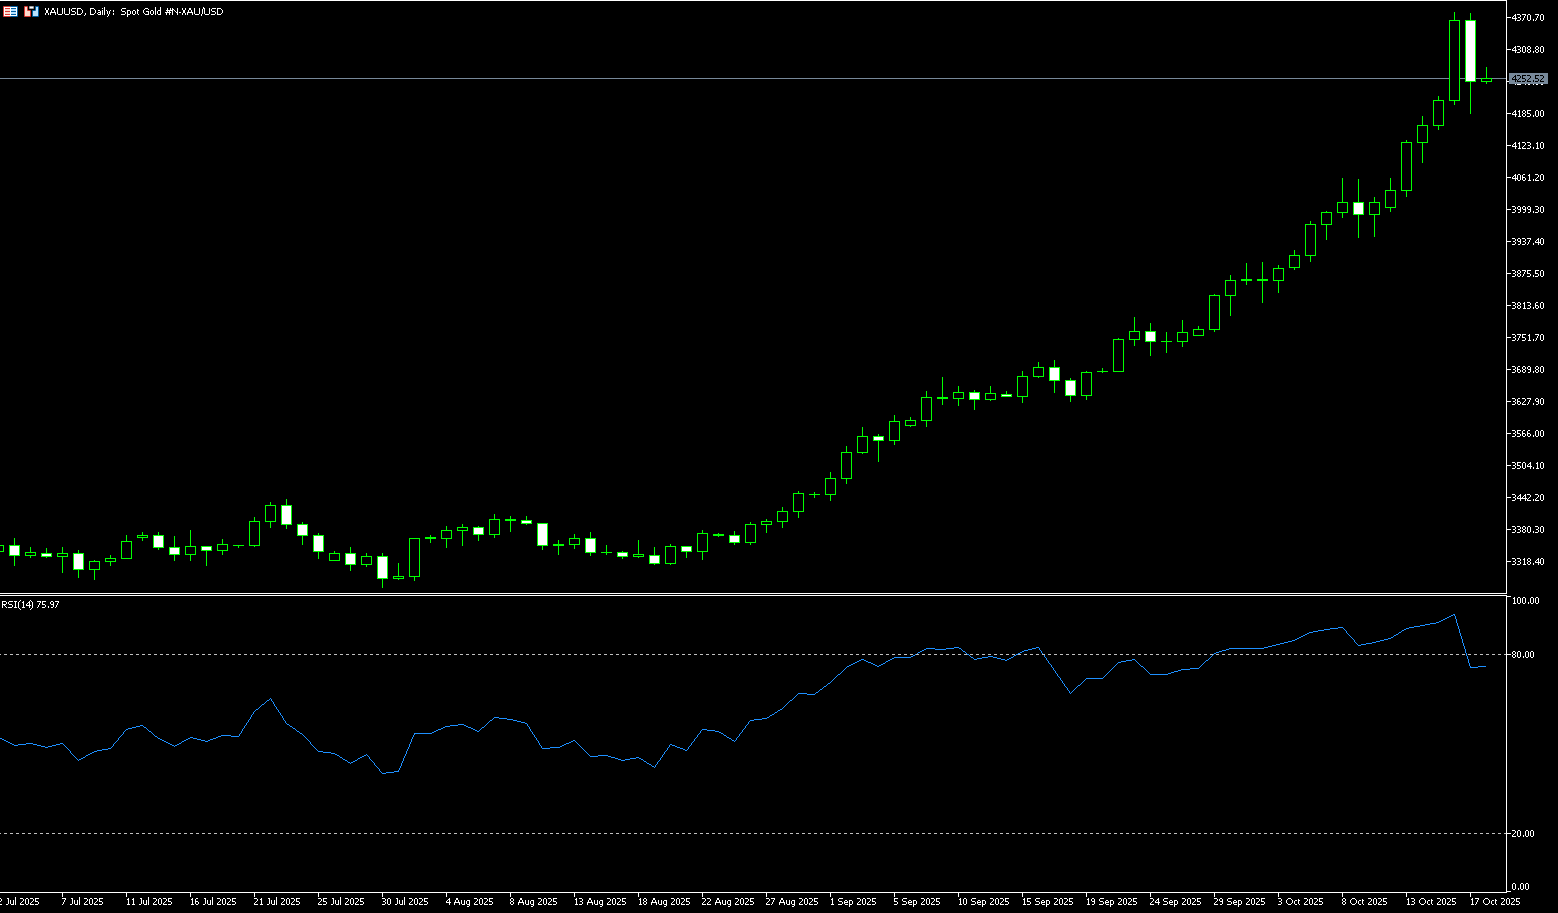
Gold fell about 2% last week, reaching around $4,186 per ounce, retreating from its all-time high of $4,379.80 reached in the previous session. Investor concerns about escalating US-China trade tensions have eased somewhat, with President Trump stating that 100% tariffs on Chinese goods would be "unsustainable," hinting at a possible detente before his upcoming meeting with Chinese President Xi Jinping. However, Trump placed the blame for the latest standoff on Beijing, accusing it of imposing tighter controls on rare earth exports. If the US and China fail to reach an agreement at their leaders' meeting at the end of this month, these tensions could directly push gold prices above $5,000. Meanwhile, last week, spot gold continued its upward trajectory, reaching a new all-time high of $4,379.80 per ounce. This week, it has risen nearly 9% so far, and is likely to post its ninth consecutive weekly gain. Gold has risen over 60% this year, driven by expectations of US rate cuts, the government shutdown, geopolitical tensions, and strong demand for safe-haven assets. Central bank purchases and ETF inflows have also provided additional support. Market participants have generally factored in this month's 25 basis point cut in the federal funds rate, with another rate cut likely in December.
Technically, if gold prices can hold above $4,300, the next target could be $4,400. Conversely, if the Fed's speech signals hawkishness, gold prices could retest the $4,200 support level. Overall, gold prices are expected to remain volatile at high levels until the end of the year. From a technical perspective, the daily gold chart shows that the MACD indicator's red bar has extended, indicating continued bullish momentum. The RSI has retreated to around 77, but remains in overbought territory, suggesting a possible short-term technical correction, but the overall trend remains strong. Gold prices continue to trade above the 5-day (4208) and 9-day (4118) simple moving averages, maintaining a bullish trend within the short-term moving averages. Since breaking through the $4,300 mark, the candlestick pattern has shown a steady upward trend, with resistance concentrated in the $4,450 to $4,500 range. A breakout above this range could open up further upside potential, with the ultimate target at $5,000. On the downside, $4,208 (5-day SMA) - $4,186 (last Friday's low) represents near-term support, potentially providing temporary support during a short-term correction at $4,118 (9-day SMA).
Consider going long on gold at 4,247 today, with a stop-loss at 4,242 and a target of 4,285 or 4.300.
AUD/USD
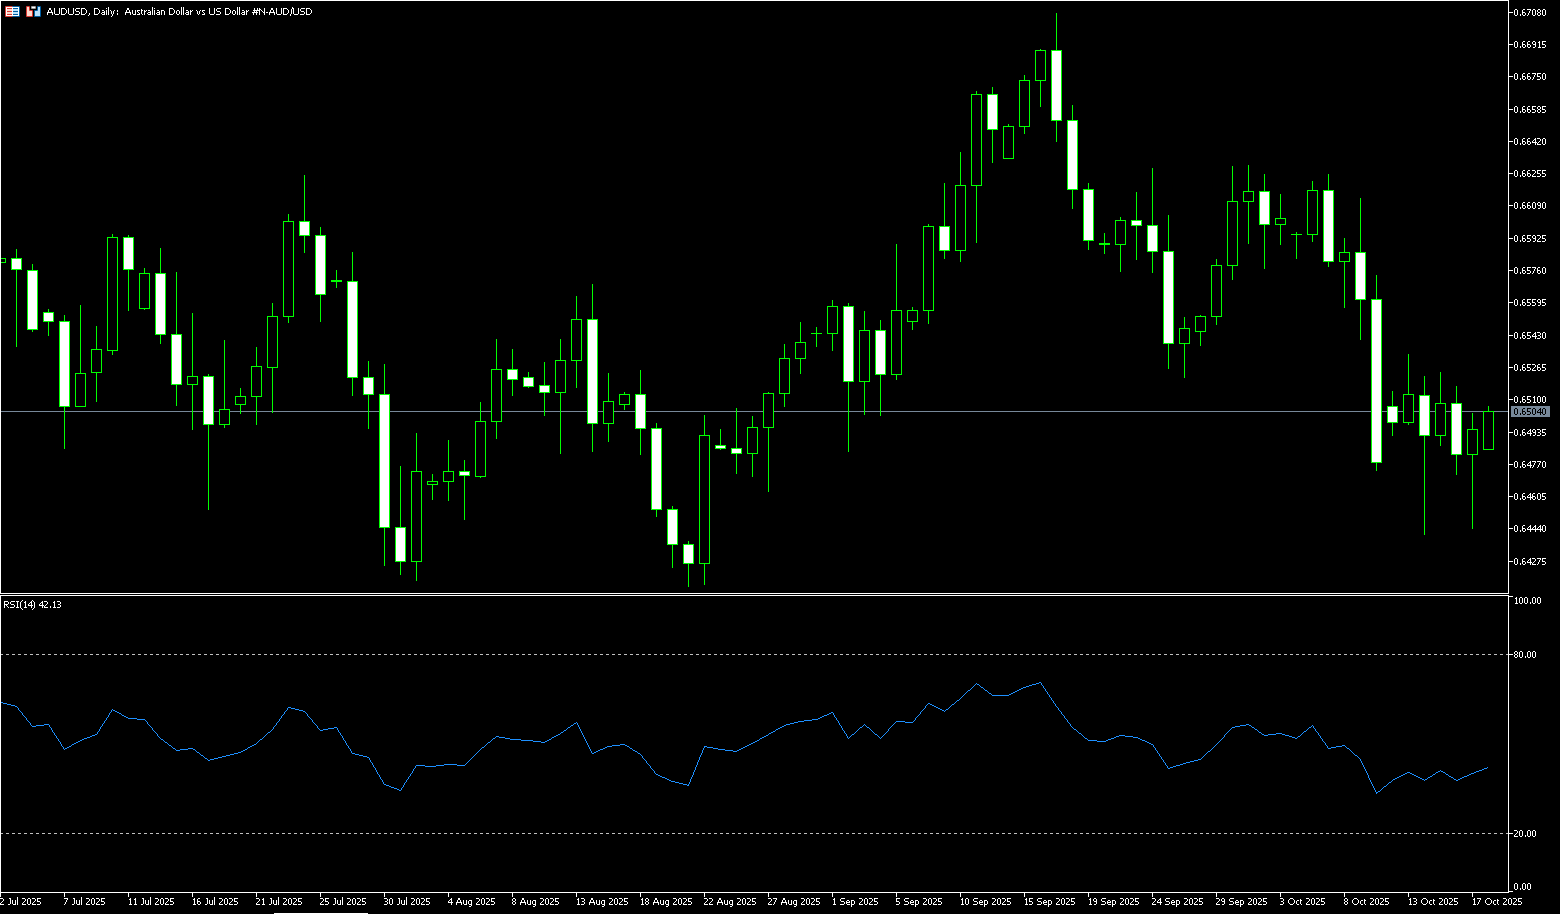
The Australian dollar fell against the US dollar in late last week, weakening below $0.6500 before the weekend. Following the release of weaker-than-expected Australian employment data, the AUD came under significant pressure, falling to $0.6470 before recovering slightly, but overall it remains within a bearish trend. Market bets on a near-term interest rate cut by the Reserve Bank of Australia (RBA) have increased. Futures prices are pricing in an 85% probability of a 25 basis point cut to 3.35%, up from a 50% probability earlier this week, while a further cut to 3.10% is now fully anticipated. This comes against the backdrop of an unexpected rise in the unemployment rate and a decline in job creation, suggesting further easing in the labor market. However, the central bank may await the release of the third-quarter CPI report before deciding on any interest rate adjustments. Meanwhile, investors continue to weigh the risks associated with escalating US-China trade tensions. In the latest news, China accused the US of exaggerating its rare earth export controls, calling the resulting "panic" unnecessary and expressing its willingness to engage in trade negotiations. Furthermore, the continued weakness of the US dollar due to trade frictions, the government shutdown, and the slowing US economy provided support for the Australian dollar.
Daily chart technical analysis shows that the Australian dollar/US dollar remains bearish, as it remains within a descending channel pattern. Furthermore, the 14-day relative strength index (RSI) remains below 50, reinforcing the bearish tone. Furthermore, last week, the 10-day and 50-day simple moving averages formed a bearish "death cross" pattern. Therefore, on the downside, the Australian dollar/US dollar could test the October 14 low of 0.6440. A break below this channel support would strengthen the bearish trend and push the exchange rate to test the four-month low of 0.6414 set on August 21, and then the round number of 0.6400. A break below this level would test the five-month low of 0.6372. On the upside, the Australian dollar faces initial resistance at the 10-day simple moving average at 0.6530, followed by the October 10 high of 0.6572. A break above these moving averages would improve short- and medium-term price momentum, pushing the pair towards the psychologically important 0.6600 level. An eventual break above 0.6600 would trigger a bullish rally, supporting a move towards the 12-month high of around 0.6707 reached on September 17.
Consider a long position on the Australian dollar at 0.6482 today, with a stop-loss at 0.6470 and targets at 0.6540 and 0.6550.
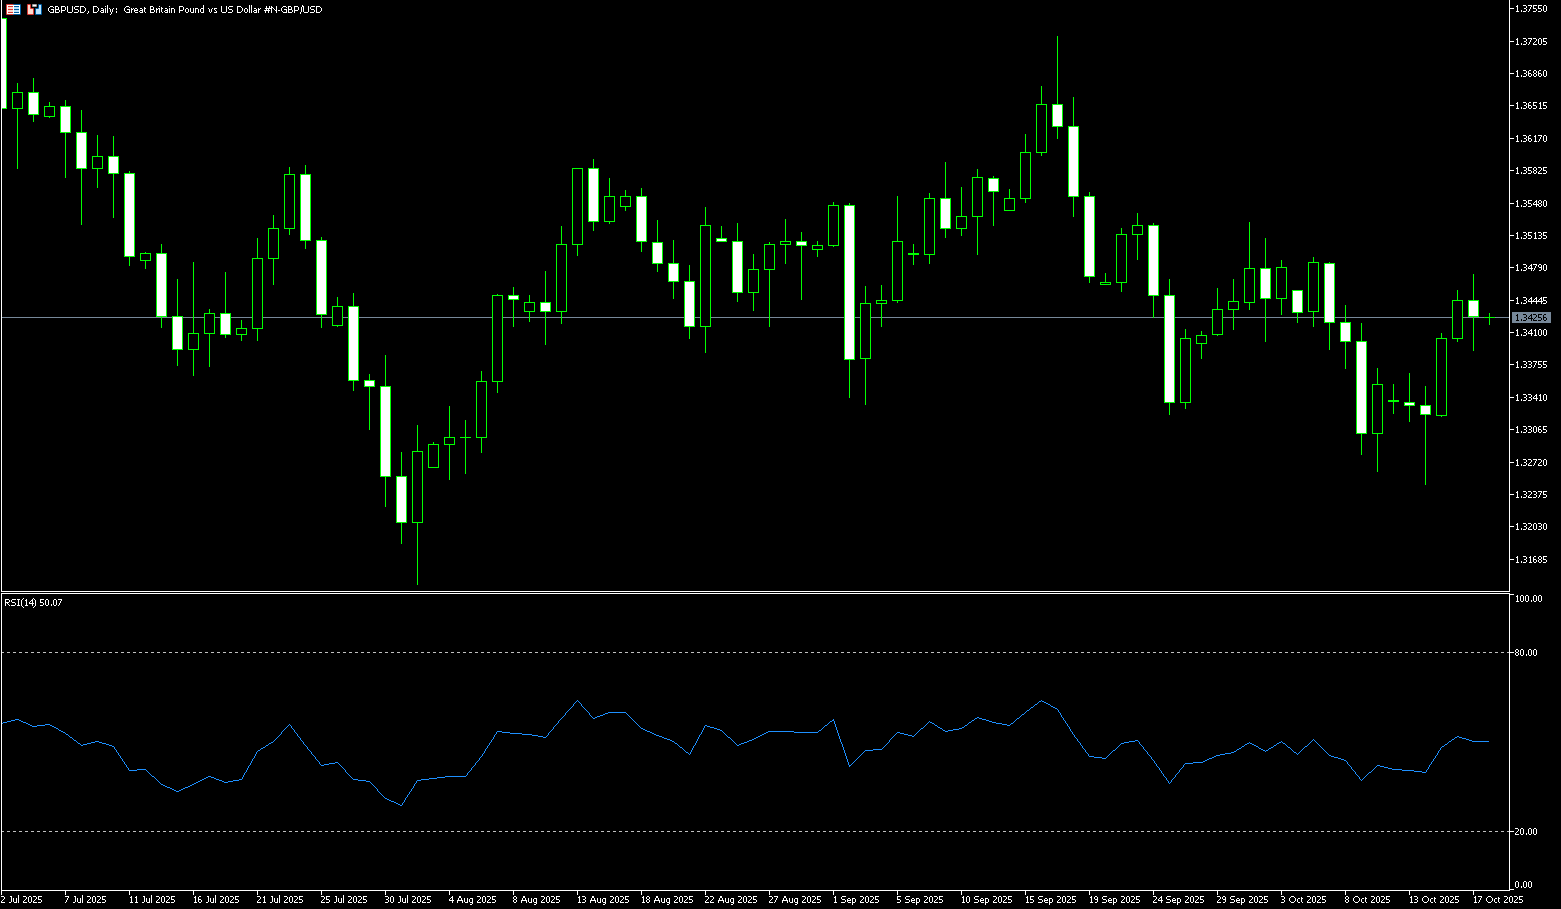
GBP/USD
GBP/USD continued to gain positive momentum on Friday, moving further away from its lowest levels since early August reached earlier this week, around the 1.3250-1.3245 area. It is currently trading around 1.3420, although any upward move lacks bullish conviction. From a fundamental perspective, signals from the US continue to weaken the dollar's marginal strength. Federal Reserve Chairman Powell emphasized that the policy outlook favors further easing. When both the actual and expected interest rate differentials on the US dollar decline, non-US currencies gain short-term protection; this is the core exogenous factor behind the pound's strength this week. Secondly, the pound's internal factors are not solid. Market data indicates that the money market has already priced in a combined rate cut of approximately 46 basis points from the Bank of England's two remaining meetings this year. This is due to weak UK labor data for the latest three months (ending in August), which has reinforced market bets on further easing from the Bank of England. This means that the pound's room for interest rate differential improvement is constrained by the triad of "slowing growth, high inflation, and loose monetary policy." Any unexpected resurgence in price stickiness would quickly erode the pound's rebound momentum.
From a technical perspective, the breakout above the 9-day SMA at 1.3378 on the daily chart and the subsequent breakout above 1.3360 (the 23.6% Fibonacci retracement level from 1.3726 to 1.3248) favor bullish traders. Furthermore, oscillators on the daily chart are also gaining positive momentum, supporting the possibility of further gains for GBP/USD. Therefore, the first resistance level to watch is 1.3467 (the 30-day SMA), and a subsequent rise above 1.3487 (the 50.0% Fibonacci retracement level) seems a distinct possibility. Following closely behind is the psychological level of 1.3500, a break of which would be seen as a new trigger point for bullish traders and could allow GBP/USD to climb further towards the next relevant resistance level, near the 61.8% Fibonacci retracement level of 1.3543. On the other hand, any corrective decline now appears to find decent support near the 9-day SMA at 1.3377. A further pullback could be seen as a buying opportunity around the 1.3360 area (23.6% Fibonacci retracement level). A break below this level could accelerate GBP/USD's decline towards the 1.3300 round-figure mark.
Consider a long position on GBP at 1.3413 today, with a stop-loss at 1.3400 and a target of 1.3470 or 1.3475.
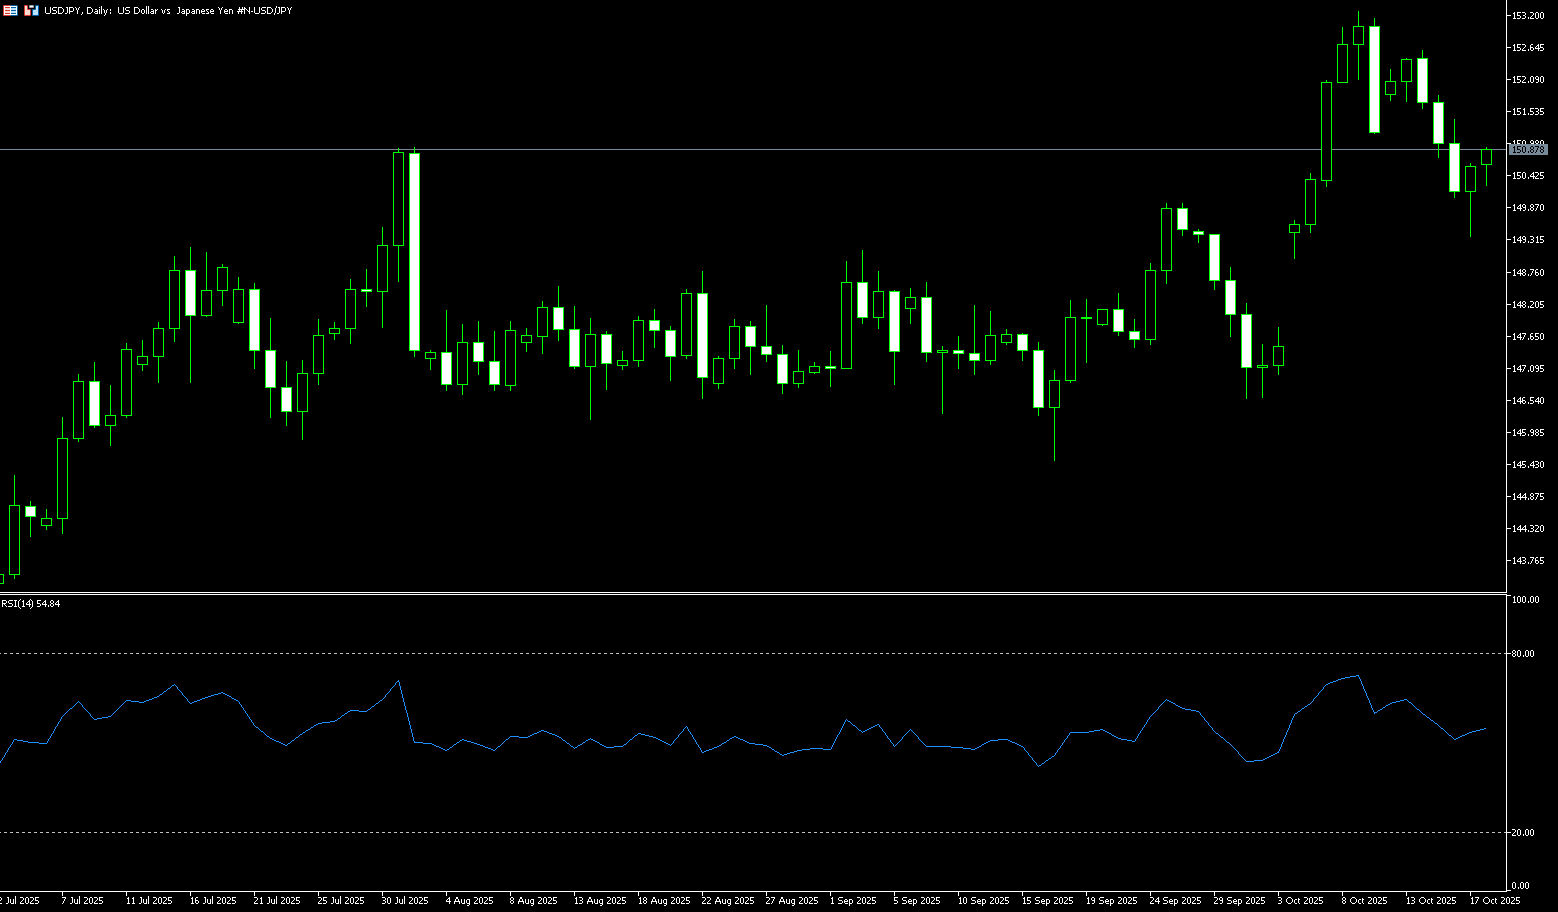
USD/JPY
The yen remained strong against a generally weakening US dollar last week, falling below 150.00 to a near two-week low of 149.38 before the end of last week. Global risk sentiment was dampened by concerns about the economic risks posed by escalating trade tensions between the US and China, a prolonged US government shutdown, and geopolitical uncertainty. Furthermore, easing concerns about Japan's fiscal health were a key factor driving flows into the safe-haven yen. Bank of Japan Governor Kazuo Ueda indicated he would be prepared to raise interest rates if confidence in the economic outlook continues to strengthen. Ueda said he would assess incoming data before this month's policy meeting, suggesting the Bank of Japan has not ruled out near-term action despite ongoing political uncertainty and risks from US tariffs. However, the market sees little chance of a rate hike at the October meeting. Meanwhile, investors continue to monitor political developments, as opposition parties have yet to reach a consensus on the ruling Liberal Democratic Party's proposal to hold a new prime ministerial election on October 21st. Externally, the yen received additional support from safe-haven demand and a weaker US dollar due to escalating US-China trade tensions, a prolonged US government shutdown, and dovish signals from the Federal Reserve.
Recent technical analysis suggests that USD/JPY may have formed a short-term top. Following a strong rally from the early-month low of 146.59 to 153.27, the pair has seen a significant "head-and-foot" breakout on the daily chart, along with a bearish "death cross" formation between the 5-day and 9-day simple moving averages. This reversal was triggered near the 153.20-154.00 trendline resistance level—derived from the July 2024 high of 161.95 and the January 2025 high of 151.88. The pair encountered resistance near 153.27. Despite the bearish signal, further confirmation is needed given the pair's recent bullish momentum. Immediate resistance lies around 151.67 (9-day simple moving average) - 151.70 (23.6% Fibonacci retracement level from 146.60 to 153.27). The next level targets 152.61 (October 14 high) and 153.00 (round number mark). If USD/JPY consolidates below the 151.15-151.00 area, it could trigger a new decline to 149.15 (61.8% Fibonacci retracement level). A sustained break below this level could trigger some technical selling in USD/JPY, dragging the spot price down to 148.17 (76.4% Fibonacci retracement level).
Consider shorting the US dollar at 150.80 today. Stop-loss: 151.00, target: 149.80, 149.60.
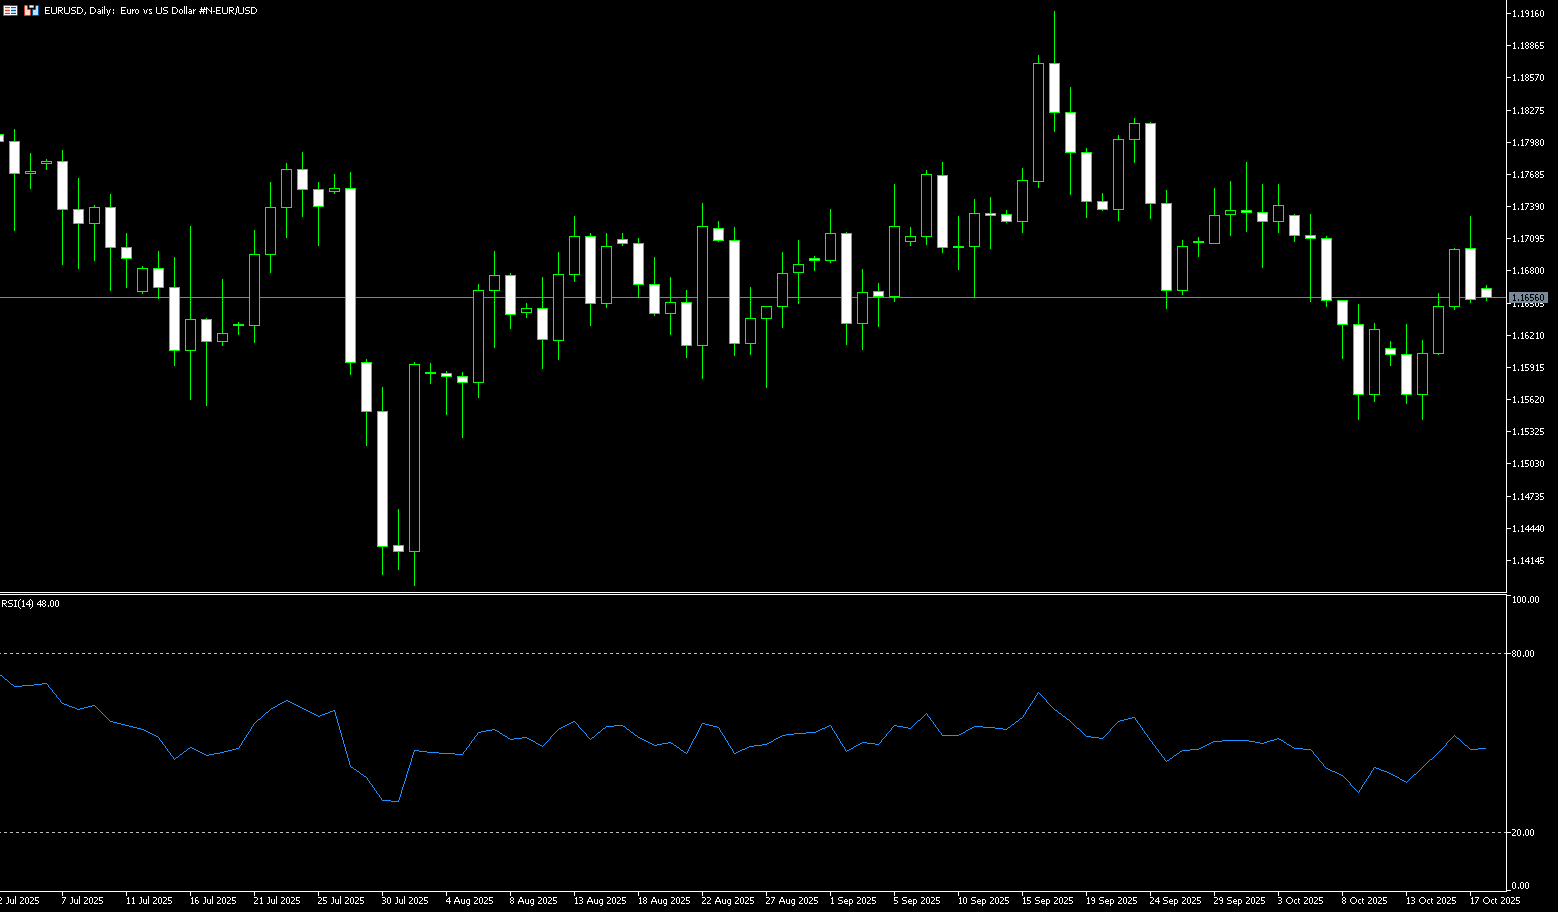
EUR/USD
EUR/USD extended its gains from last week's low of 1.1542, briefly retracing above 1.1700 before the weekend. The pair gained support after the French government survived a no-confidence vote, with Prime Minister Sebastien Le Corneaux's pledge to suspend a key pension reform winning support from some left-wing lawmakers. Furthermore, the euro was supported by a dovish outlook, contrasting with the ECB's forecasts, which indicated that interest rates were likely to remain unchanged. ECB Governing Council member Martin Kocher said on Thursday, "I believe we have reached the end of the rate-cutting cycle, or at least very close to it." Kocher further noted, "It is important to maintain ammunition in a potential crisis." The euro rose against the dollar and weakened as the ongoing US government shutdown, set to extend into next week, saw the Senate again fail to pass a Republican bill to extend funding and end the deadlock, marking the tenth such failure on Thursday and bringing the shutdown into its 16th day. Furthermore, sentiment continues to dominate the market, with the euro's strong correlation with risk reversals once again pricing in a slight premium for euro strength.
EUR/USD's bullish momentum improved last week, with the 14-day Relative Strength Index (RSI) on the daily chart rising slightly below 50, as the euro attempts to break through the downtrend line drawn from the July low. Currently, the pair is holding steady at the bullish "double bottom" formation of 1.1542 at the beginning of last week. This typically signals a trend reversal, and the pair briefly retraced above the key level of 1.1700 before the weekend. The double bottom pattern targets the September 18 high, near 1.1848. The 5-day moving average (1.1632) and the 9-day moving average (1.1625) formed a bullish "golden cross" pattern before the weekend. Therefore, the first resistance level is 1.1700 (round number), followed by the October 1 high of 1.1780, ultimately leading to the 1.1800 (round number) and 1.1818 (September 24 high). Looking down, the previous resistance level of 1.1625 (9-day simple moving average) now acts as the first support. If the price breaks below this level, the next level will be 1.1600 (round number). This would further re-establish the "double bottom" formation at 1.1542, the low of October 9 and 14.
Consider a long EUR at 1.1640 today, with a stop loss of 1.1630 and a target of 1.1690 or 1.1700.
Disclaimer: The information contained herein (1) is proprietary to BCR and/or its content providers; (2) may not be copied or distributed; (3) is not warranted to be accurate, complete or timely; and, (4) does not constitute advice or a recommendation by BCR or its content providers in respect of the investment in financial instruments. Neither BCR or its content providers are responsible for any damages or losses arising from any use of this information. Past performance is no guarantee of future results.
More Coverage


Risk Disclosure:Derivatives are traded over-the-counter on margin, which means they carry a high level of risk and there is a possibility you could lose all of your investment. These products are not suitable for all investors. Please ensure you fully understand the risks and carefully consider your financial situation and trading experience before trading. Seek independent financial advice if necessary before opening an account with BCR.

 English
 简体中文
简体中文
 繁體中文
繁體中文
 Bahasa
Melayu
Bahasa
Melayu
 Tiếng
Việt
Tiếng
Việt
 ไทย
ไทย
 日本語
日本語
 한국어
한국어
 ភាសាខ្មែរ
 español