


0
US Dollar Index
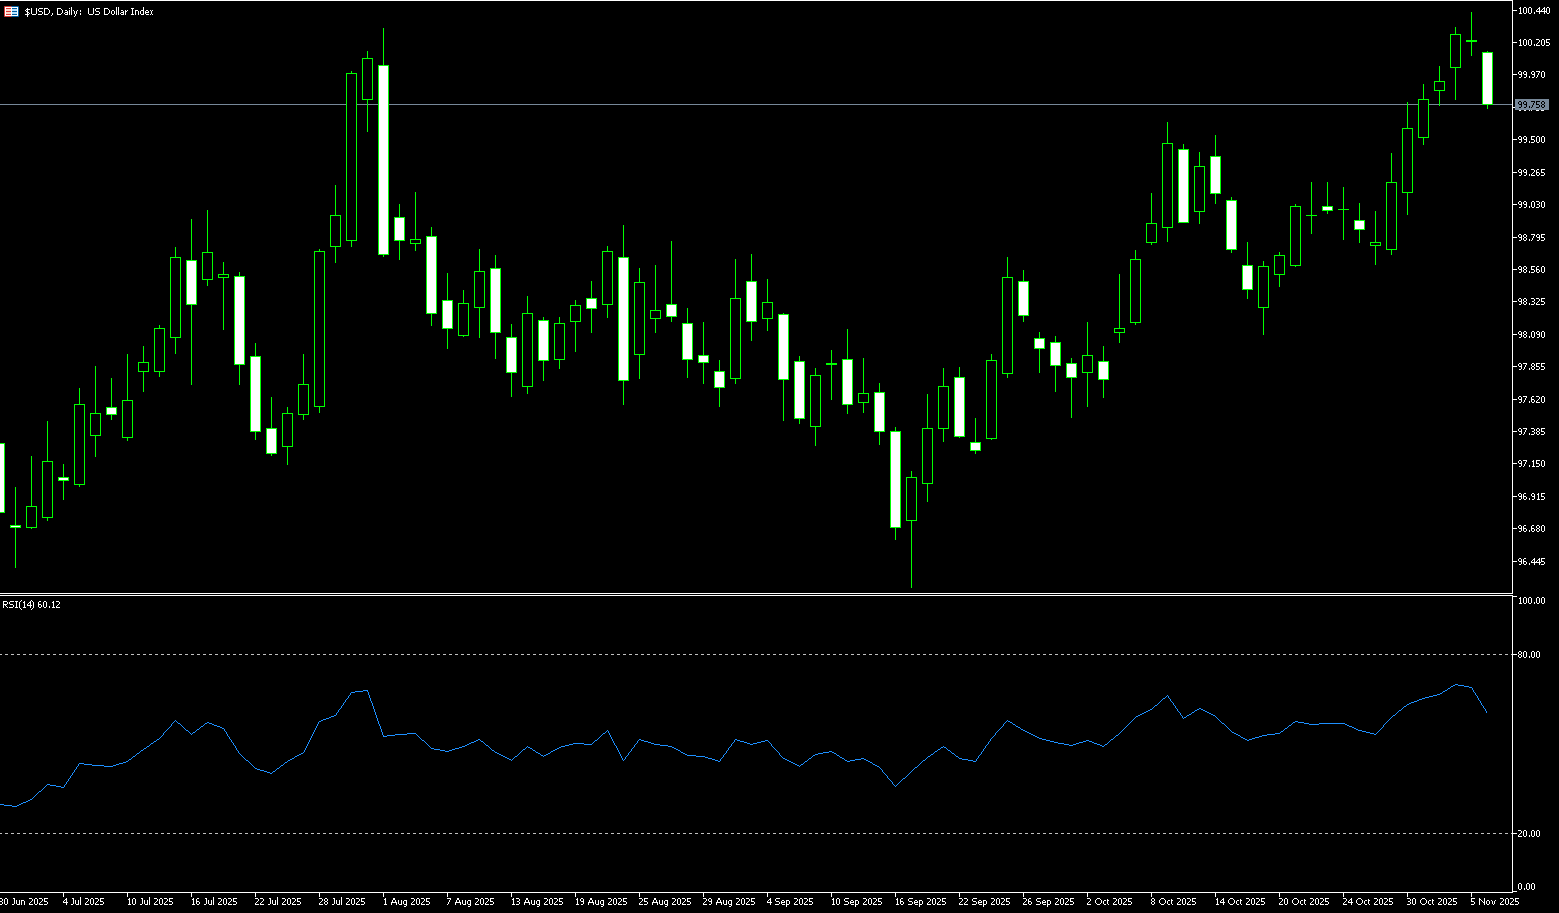
The US dollar index fell below 100.00 to 99.70 on Thursday, retreating from a more than five-month high, as stronger risk sentiment dampened demand for safe-haven currencies. Nevertheless, optimistic US economic data and the Federal Reserve's cautious stance on further policy easing supported the dollar. The ADP report showed that US private companies added more jobs than expected in October, while the ISM services purchasing managers' index rose to an eight-month high. However, the longest government shutdown in US history continued to delay the release of key official data. Meanwhile, due to mixed signals from Fed officials, traders reduced their bets on a December rate cut, with the market now pricing in only a 62% probability of a 25 basis point rate cut, compared to over 90% before last week's FOMC decision. The dollar weakened against all major currencies, with the largest declines against the euro and the yen.
The US dollar index broke through the psychological level of 100 this week, reaching a high of 100.26, forming a double top pattern with the August 1 high of 100.26. Earlier, the dollar index approached the 200-day moving average at 100.34, a level that will determine whether the dollar's momentum will continue upward or reverse. Furthermore, even weak employment data pushed up yields and supported the dollar's strength. However, short-term technical analysis suggests that renewed expectations of interest rate cuts may push the dollar back below the 100 level. If the dollar index confirms a break above the 100.26 double top, the next target will be the 200-day moving average at 100.34, and a break above that would target the key summer resistance level of 100.53 (the high of May 23). However, if the upward momentum loses momentum here, the dollar index may retrace to 99.55 (the 9-day simple moving average) and then to 99.00 (the psychological level). Traders are closely watching daily closing prices and yield changes for further signals.
Today, consider shorting the US Dollar Index at 99.80, with a stop-loss at 99.90 and targets at 99.40 and 99.30.
WTI Crude Oil
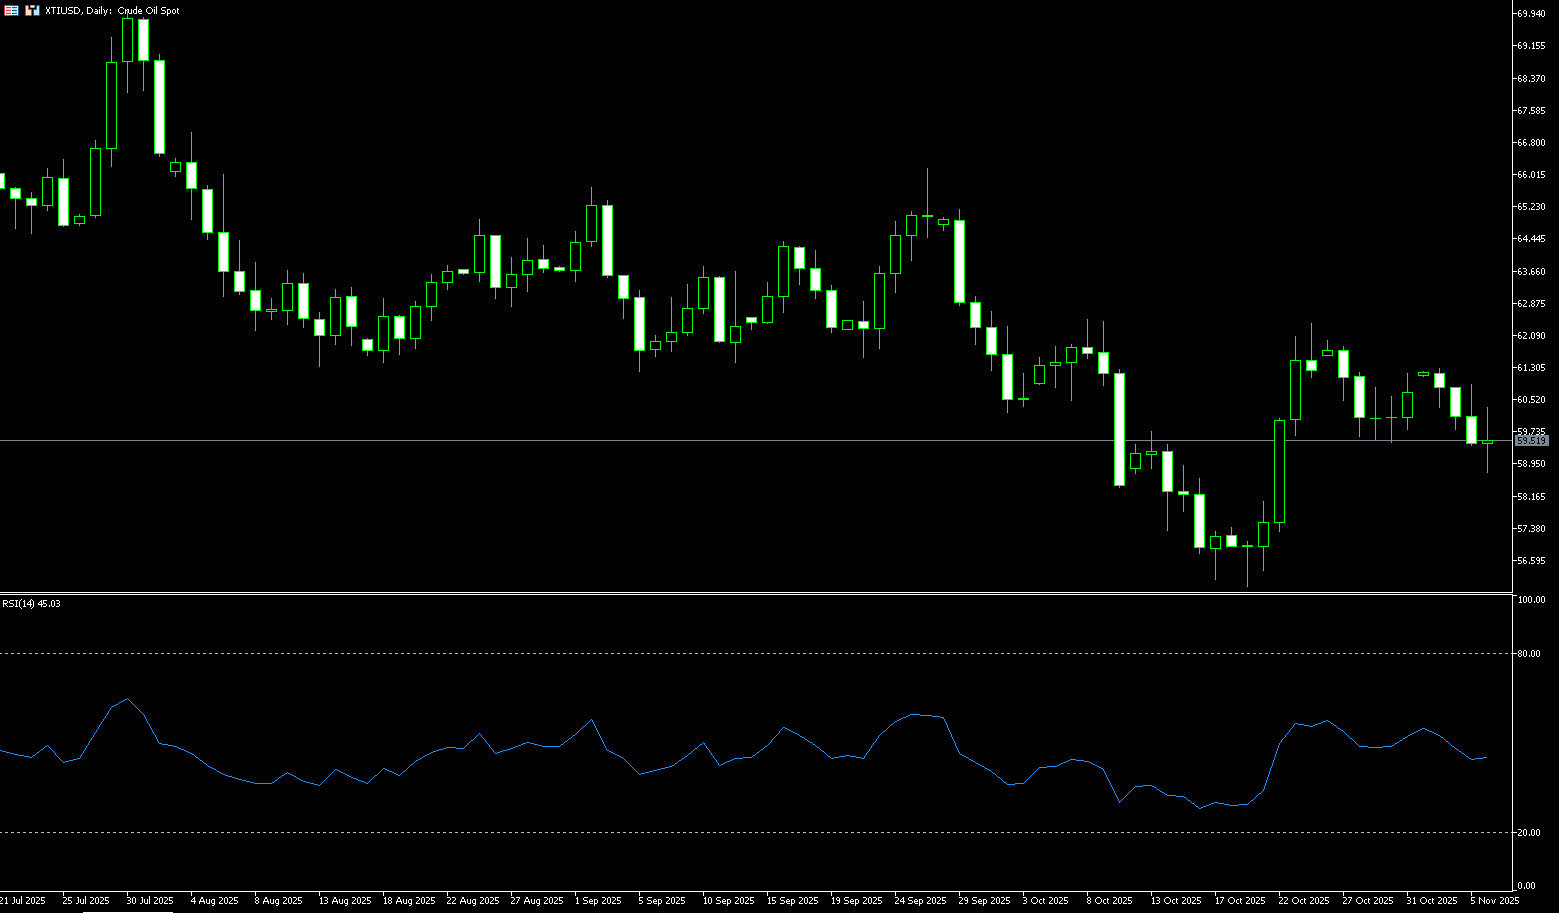
US WTI crude oil traded in a narrow range around $59.50 per barrel on Thursday, after hitting a two-week low of $58.75 on Wednesday. Continued concerns about a global oil supply glut were the main factor suppressing prices. Earlier, prices approached $60.00 before rebounding. The market exhibited a mixed pattern of "bearish data – bullish geopolitics – technical correction." The "re-accumulation" of inventories is a bearish factor for crude oil itself, meaning that even with passive inventory buildup, the demand elasticity of refined products can offset some of the pressure, limiting the speed of a one-sided decline in oil prices. Geopolitically, Ukraine has increased the frequency of attacks on Russian energy facilities, including the attack on the Norsi refinery in Nizhny Novgorod and disturbances to facilities in Tuapse and Saratov. While the sustainability of actual production losses remains to be seen, the expectation of supply disruptions itself can support oil prices through risk premiums. Furthermore, any marginal upgrades to shipping routes between the Middle East and the Black Sea could further amplify supply-side uncertainty.
The daily chart shows that since rebounding from the low of $59.36 (the Bollinger Band midline) along the upward trend line, oil prices are currently retracing and supporting the trend line, repeatedly testing the $60.00 level during the session. The $59.00 level below is static support, forming a "convergence support zone" with $57.89 (the October 10th low). The MACD indicator is above the zero line, suggesting that upward momentum remains but is slowing; if the histogram continues to narrow until it turns green, it will constitute an early signal of momentum divergence. The 14-day RSI is in a neutral-to-strong range, indicating that it is not extremely overbought, leaving room for a continued technical rebound. The resistance structure above is clear: $60.64 (34-day moving average) and $60.89 (Wednesday's high) form a double resistance. Holding above these levels would target the $62.31 (Bollinger Band upper line) and the $62.38 (October 24 high) resistance zone.
Today, consider going long on crude oil at $59.35. Stop loss: $59.20, Target: $61.00, $61.30
Spot Gold
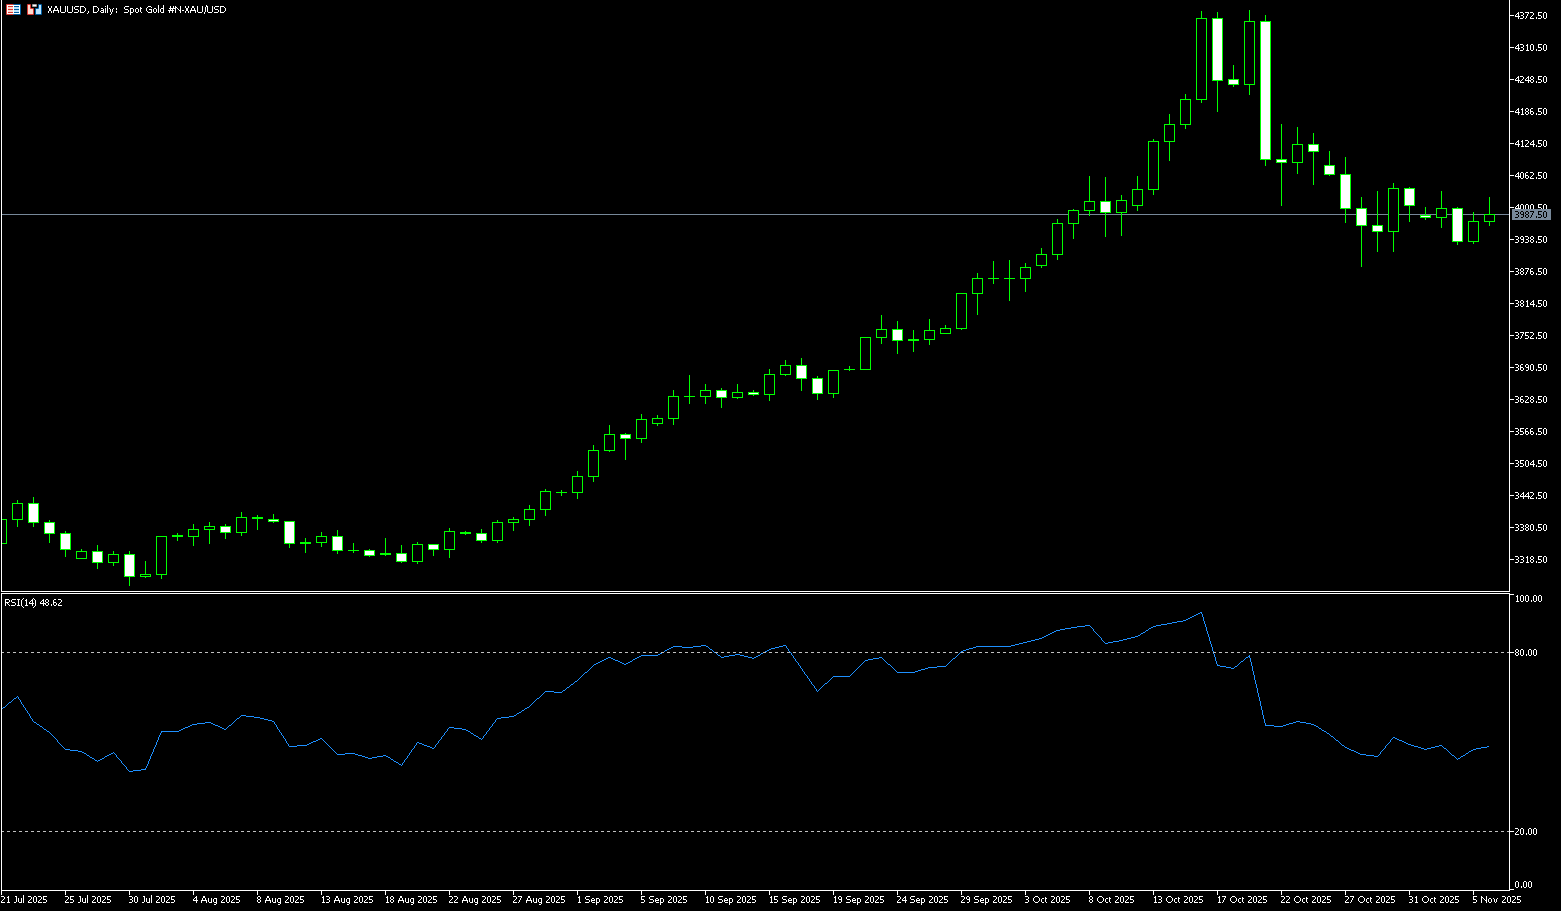
On Thursday, spot gold traded near $4,000/oz, with global stock market volatility and concerns about an AI stock bubble fueling safe-haven demand. While strong jobs data typically implies higher interest rates for an extended period, the combination of global stock market volatility and concerns about an AI stock bubble boosted safe-haven demand. Traders said that gold's rise despite stronger-than-expected jobs data was reassuring to bulls. Meanwhile, precious metals such as silver, platinum, and palladium all rose, with gains of 2.2%, 1.7%, and 2.4%, respectively. Investors are closely watching the US Supreme Court hearing on the legality of Trump's tariffs, which will bring new policy uncertainty to the market. On the other hand, the "soft landing" expectation indicated by the US Treasury yield curve has spread to the foreign exchange and commodity markets (including the precious metals market). The steepening of the yield curve reinforces the pricing of future Fed rate cuts, which is beneficial to non-interest-bearing assets like gold. The decline in yields in the middle of the curve means lower implied real interest rates in the market, increasing gold's safe-haven appeal.
With the December FOMC meeting approaching, the shape of the US Treasury yield curve may pave the way for a future rate-cutting cycle, and the "soft landing" narrative will continue to dominate the market. In this process, the correlation between the US dollar and gold will become clearer: the US dollar may weaken amid volatility, while gold will accumulate upward momentum with the help of safe-haven demand. Currently, the short-term 4-hour chart shows the price below the Bollinger Band middle line at $3,984. The MACD remains in negative territory, but the 14-day Relative Strength Index (RSI) has fallen to 47.20, temporarily hovering slightly below the 50 midline, suggesting that upward momentum is building. At present, the first support levels are the lower Bollinger Band at $3,936.20 and the $3,929 support. If the price can hold above $3,900, it may test $4,000 (a psychological level) in the short term; a break below this level would retest $4,030.30 (the upper Bollinger Band on the 4-hour chart). This technical situation aligns with the downward trend in medium- and long-term US Treasury yields, indicating that safe-haven funds are flowing into both the bond and gold markets simultaneously.
Consider going long on gold at 3,974 today, with a stop loss at 3,970 and targets at 4,010 and 4,020.
AUD/USD
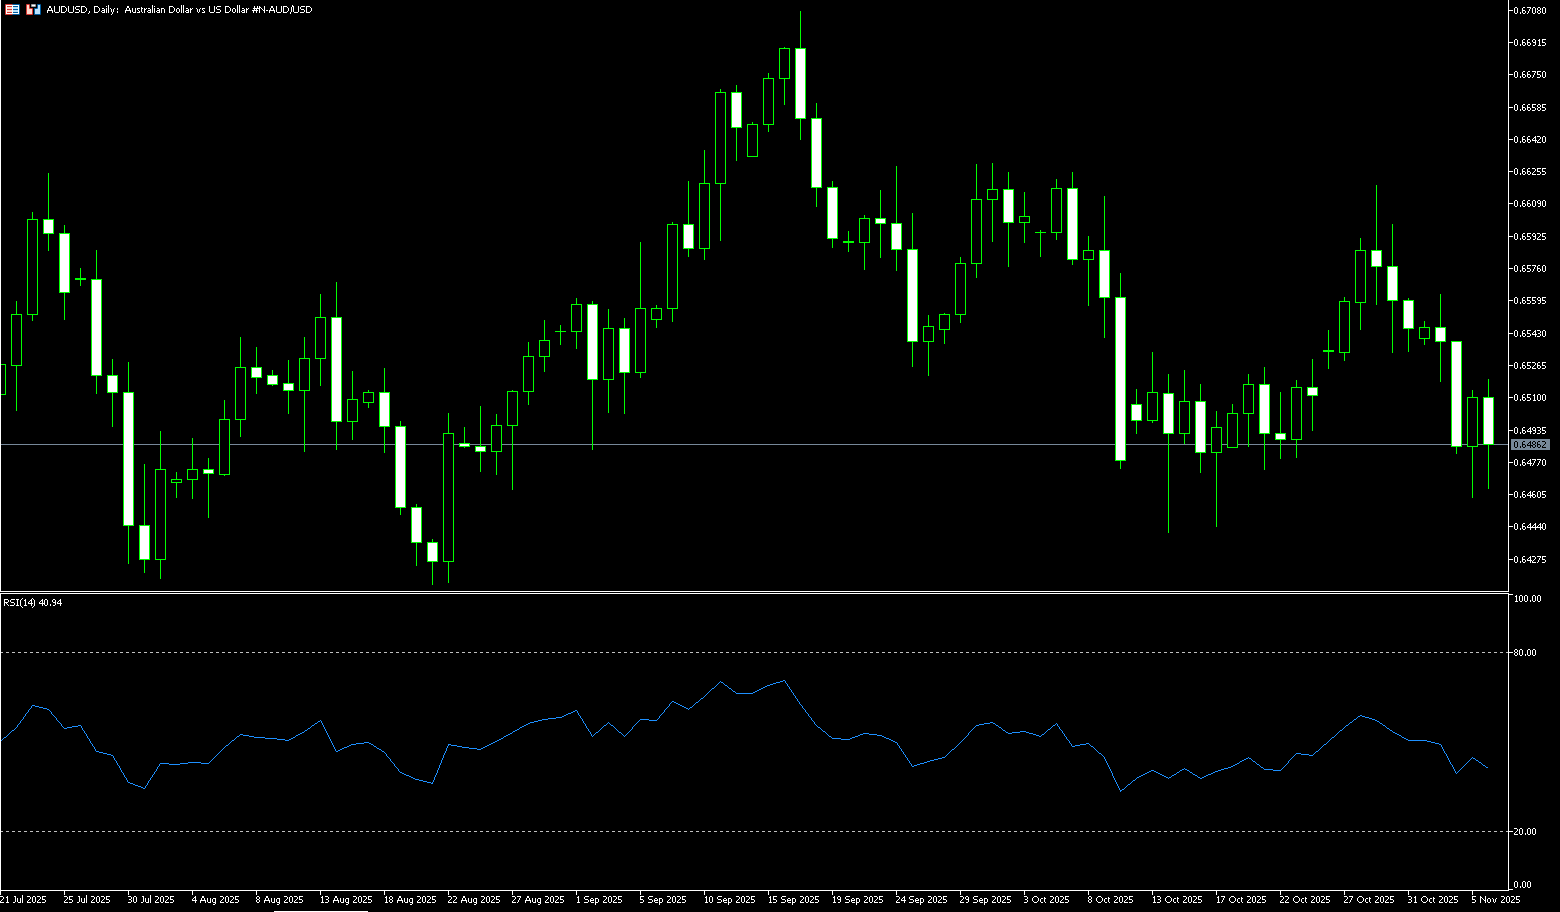
The Australian dollar traded around US$0.6480 on Thursday, supported by stronger-than-expected trade data. Australia's trade surplus widened sharply to A$39.4 billion in September from a revised A$11.1 billion in August, exceeding the forecast of A$38.5 billion. This improvement was driven by a 7.9% increase in exports, mainly due to a surge in gold prices that month, while imports rose 1.1% to a record level, primarily due to increased capital goods. On the policy front, the Reserve Bank of Australia's decision in November to keep interest rates at 3.6% suggests that further easing is unlikely, as policymakers emphasized persistent inflation risks and limited room for further rate cuts. However, the central bank's hawkish stance provided only limited support, as solid US data weakened market expectations for a Fed rate cut, putting pressure on the Australian dollar from a generally stronger US dollar.
The AUD/USD pair traded near 0.6500 on Thursday. Technical analysis on the daily chart shows the pair is still trading sideways. It remains below the 9-day simple moving average at 0.6539, indicating weak short-term momentum. A successful break below the psychological level of 0.6500 would prompt AUD/USD to test the October baseline of around 0.6440 (October 14th) and the 0.6448 {200-day simple moving average area. Following that is the five-month low of 0.6414 reached on August 21st. On the upside, initial resistance is at the 9-day simple moving average of 0.6539. A break above these levels would improve short- and medium-term price momentum and support the pair exploring the upper Bollinger Band area at 0.6579. Further gains would send a bullish signal and support the pair approaching the 0.6600 {psychological level} high.
Today, consider going long on the Australian dollar at 0.6468, with a stop-loss at 0.6456 and targets at 0.6520 and 0.6530.
GBP/USD
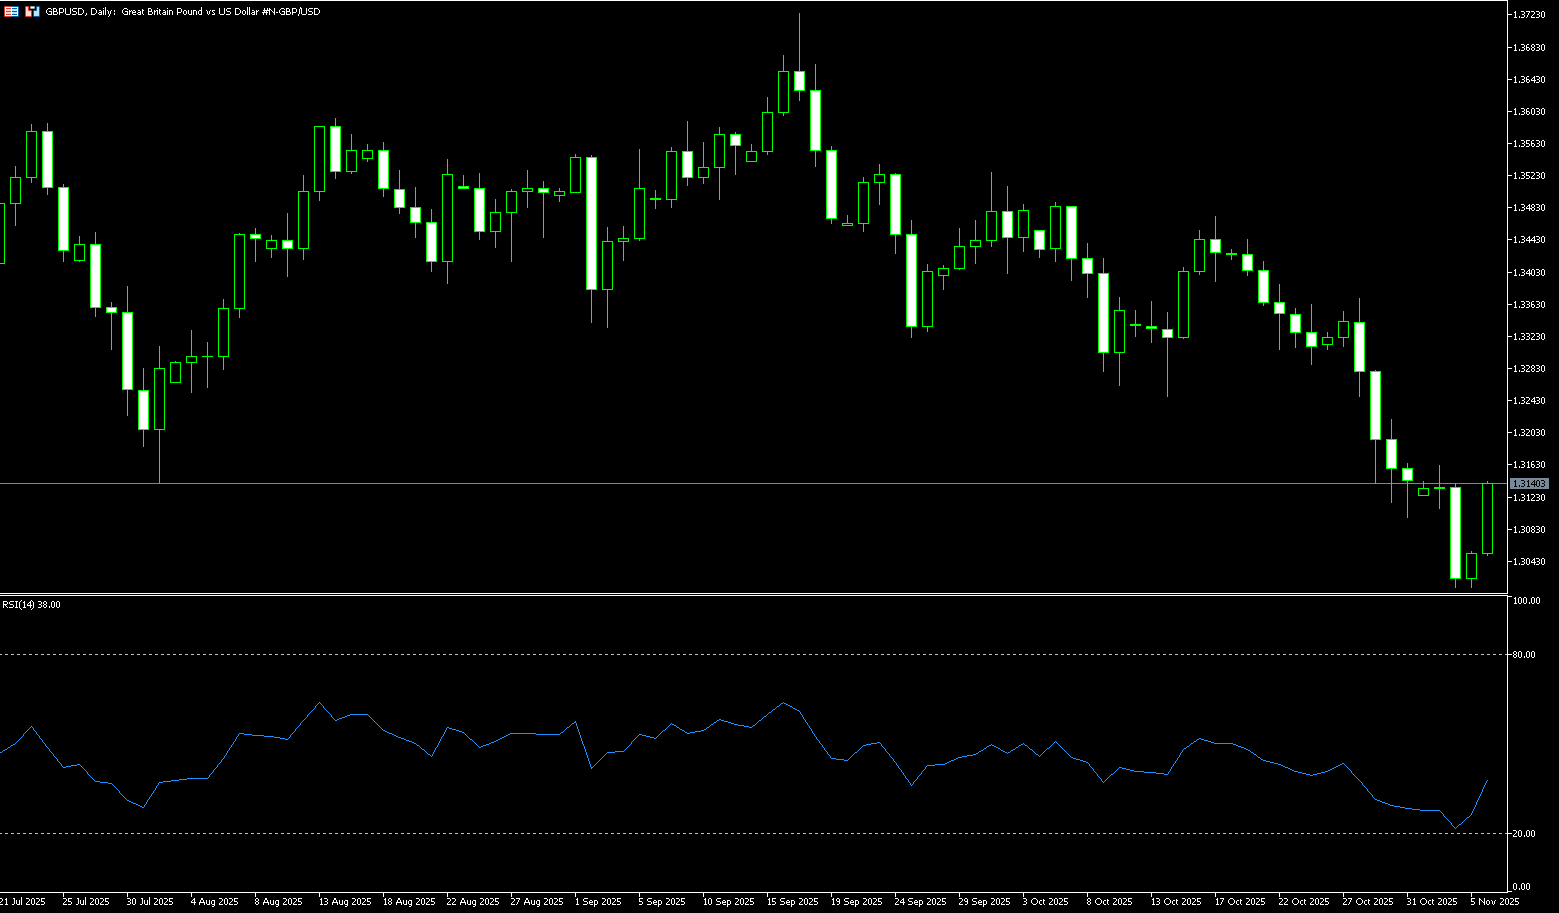
On Thursday, the pound rebounded slightly against the dollar to around 1.3130. The pound has depreciated by nearly 3.3% in the last 13 trading days. The market's main focus recently has been on Rachel Reeves' speech at Downing Street. The Chancellor emphasized fiscal discipline and did not rule out the possibility of tax increases, a statement that pushed up UK government bonds but put pressure on the pound and the stock market. The pound has been under pressure for some time, and Reeves' stance of not ruling out further tax increases has failed to effectively boost market confidence. Coupled with the strengthening of the dollar due to conflicting comments from Federal Reserve officials, the continued decline in the pound against the dollar is not surprising. The coexistence of a weaker pound and falling UK government bond yields creates a unique backdrop for the Bank of England's next move. On the one hand, declining government bond yields provide central banks with greater room for easing; on the other hand, a weaker pound could push up imported inflation, thus limiting their ability to cut interest rates significantly. This is a delicate balancing act.
Currently, the GBP/USD exchange rate is in a correction phase, remaining within a downward channel. After a round of sharp selling, bears still hold the upper hand, and attempts to rebound have been thwarted near the 1.3150 resistance level. GBP/USD forecasts suggest that the downward trend may resume. The stochastic oscillator further supports the bearish view—the indicator has moved out of oversold territory, indicating that downward momentum will be released again after a brief pullback. The pound is one of the weakest currencies, while the dollar is one of the strongest. Prices are continuing to fall with momentum, and the trend appears poised to extend below the psychological level of 1.3000, then to 1.2966 (the low of April 11), and a break below that could target the 1.2880 (the low of April 1). On the upside, consider 1.3161 (9-day simple moving average) and 1.3200 (psychological level).
Consider going long on GBP/USD at 1.3118 today, with a stop loss at 1.3105 and targets at 1.3170 and 1.3180.
USD/JPY
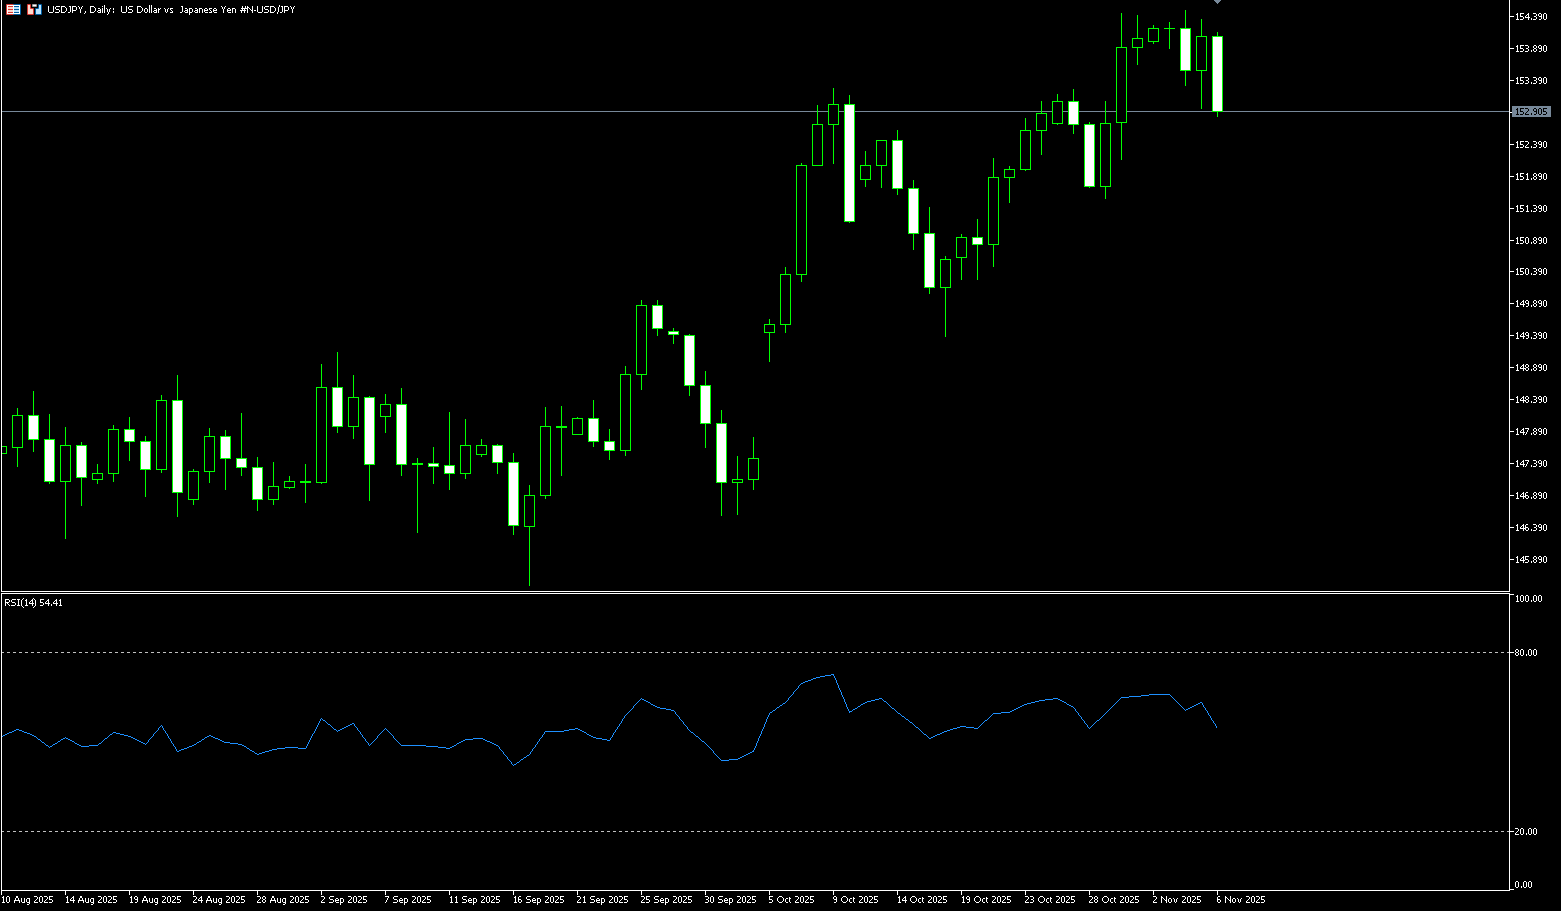
The yen briefly broke through 154 yen per dollar on Thursday, recovering from the previous day's losses, as stable wage growth strengthened expectations that the Bank of Japan would continue its tightening path. Nominal wages rose 1.9% in September, up from 1.5% in August, thanks to stable base wages and a modest increase in overtime pay. However, wage growth lagged behind the 3.4% increase in consumer prices, resulting in a 1.4% decline in real wages, marking the ninth consecutive month of decline. Bank of Japan Governor Kazuo Ueda stated that the wage outlook for 2026 will be a key factor in determining when to resume tightening, following the central bank's decision not to change policy last week. Meanwhile, newly appointed Prime Minister Sanae Takaichi reiterated that Japan has not yet seen sustainable inflation driven by strong wage growth, indicating her government's cautious stance on further interest rate hikes.
USD/JPY has faced strong resistance in the 154.40-154.45 area over the past week or so. This area should now act as a key turning point; a break above it could see the spot price targeting the psychological level of 155.00. Some follow-through buying should pave the way for a move towards the resistance level of 155.88 (the February 3 high), before the spot price climbs further to the psychological level of 156.00. On the other hand, the overnight low of 153.00 provides some support. If this level is accepted below 153.00, it could trigger some technical selling, making USD/JPY vulnerable and accelerating its decline towards the intermediate support level of 152.55-152.50, and then closer to the psychological level of 152.00.
Consider shorting the US dollar at 153.30 today. Stop loss: 153.50. Target: 152.30, 152.00
EUR/USD
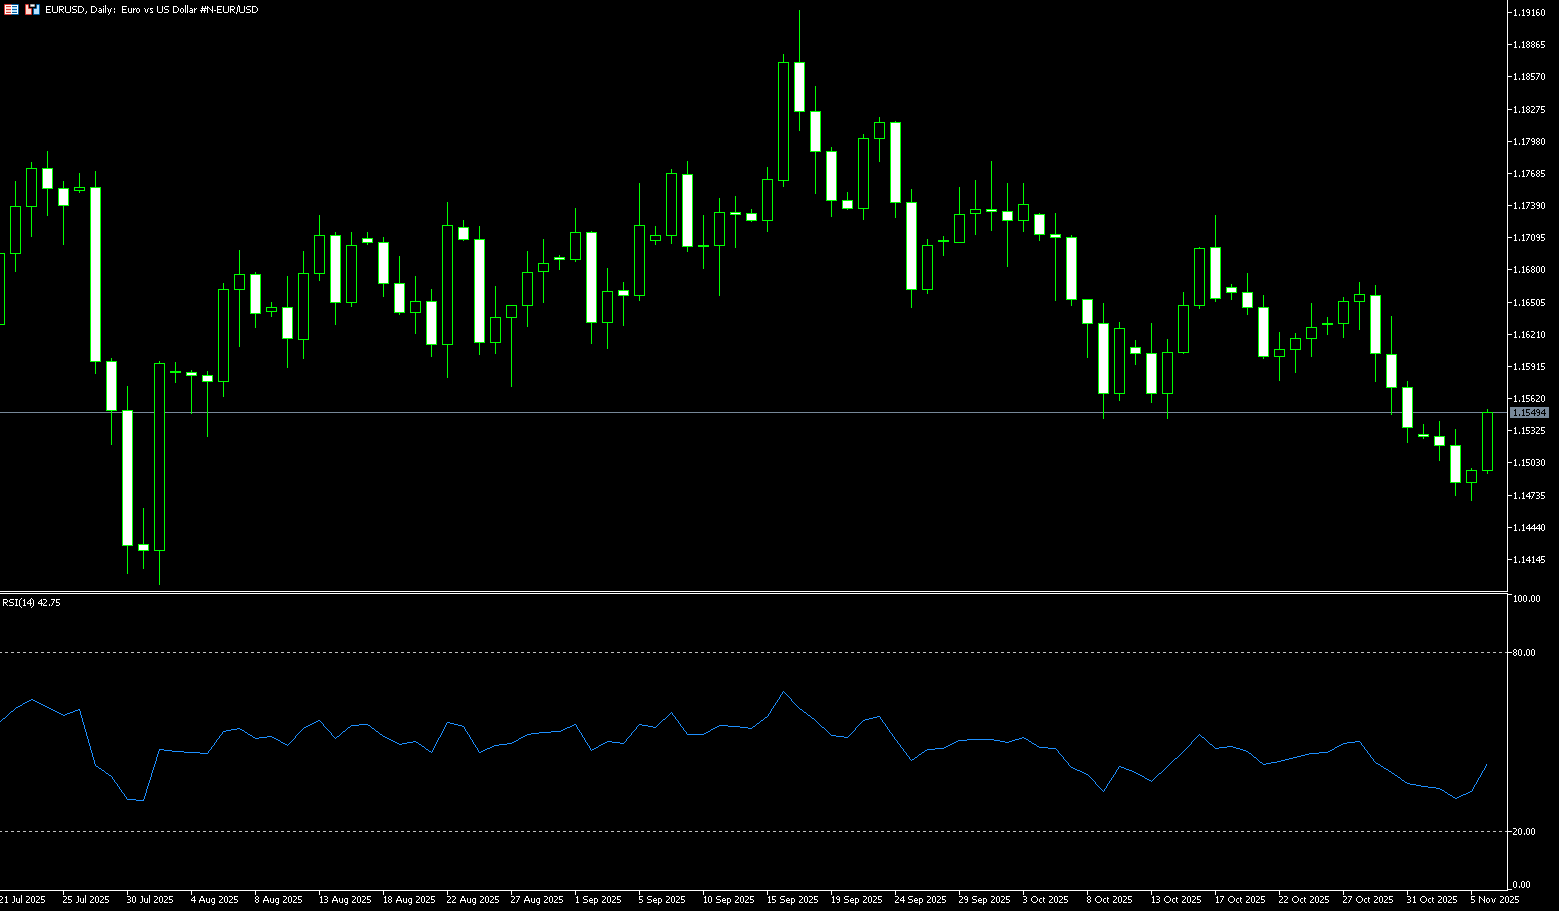
During Thursday's Asian trading session, the EUR/USD pair rose to around 1.1550. Improved risk sentiment provided some support for risk assets such as the euro. The euro edged higher against the dollar, following the stock market rebound, as the sharp sell-off in tech stocks eased. Furthermore, traders expect the European Central Bank (ECB) to take a cautious stance at its upcoming policy meeting. The ECB kept its deposit rate unchanged at 2.0% at its third meeting last week. The central bank noted that the inflation outlook was generally stable and the economy continued to grow, but uncertainty remained. ADP reported on Wednesday that private sector employment in the US increased by 42,000 in October, compared to a decrease of 29,000 in the previous month (revised from -32,000). Optimistic US economic data could boost the dollar and act as resistance for major currency pairs in the short term.
Currently, a more accommodative stance from the Federal Reserve, improved global risk sentiment, or renewed demand for Eurozone assets may offer some breathing room. The apparent correction has brought EUR/USD closer to oversold territory, reigniting hopes for a potential technical rebound in the short term. Meanwhile, momentum indicators continue to point to a bearish direction: the 14-day Relative Strength Index (RSI) is hovering around 35, while the Average Directional Index (ADX) is near 20, indicating the trend is still accelerating. However, sentiment remains subdued. Further downside is support at 1.1468 (November 5 low), followed by 1.1400 (psychological level), and then the August low at 1.1391 (August 1 low). In contrast, 1.1560, located at this week's 9-day simple moving average, provides temporary resistance, followed by 1.1600 (psychological level).
Consider going long on the Euro today at 1.1538, with a stop-loss at 1.1525 and targets at 1.1580 and 1.1590.
Disclaimer: The information contained herein (1) is proprietary to BCR and/or its content providers; (2) may not be copied or distributed; (3) is not warranted to be accurate, complete or timely; and, (4) does not constitute advice or a recommendation by BCR or its content providers in respect of the investment in financial instruments. Neither BCR or its content providers are responsible for any damages or losses arising from any use of this information. Past performance is no guarantee of future results.
More Coverage


Risk Disclosure:Derivatives are traded over-the-counter on margin, which means they carry a high level of risk and there is a possibility you could lose all of your investment. These products are not suitable for all investors. Please ensure you fully understand the risks and carefully consider your financial situation and trading experience before trading. Seek independent financial advice if necessary before opening an account with BCR.
BCR Co Pty Ltd (Company No. 1975046) is a company incorporated under the laws of the British Virgin Islands, with its registered office at Trident Chambers, Wickham’s Cay 1, Road Town, Tortola, British Virgin Islands, and is licensed and regulated by the British Virgin Islands Financial Services Commission under License No. SIBA/L/19/1122.
Open Bridge Limited (Company No. 16701394) is a company incorporated under the Companies Act 2006 and registered in England and Wales, with its registered address at Kemp House, 160 City Road, London, City Road, London, England, EC1V 2NX. This entity acts solely as a payment processor and does not provide any trading or investment services.

 English
 简体中文
简体中文
 繁體中文
繁體中文
 Bahasa
Melayu
Bahasa
Melayu
 Tiếng
Việt
Tiếng
Việt
 ไทย
ไทย
 日本語
日本語
 한국어
한국어
 ភាសាខ្មែរ
 español