


0
USD
The Federal Reserve has shown no inclination to cut interest rates recently, causing the US dollar to react positively. The US dollar index exhibited a mixed trend yesterday, initially suppressing and then rebounding throughout the day, ending with a 0.14% increase. US economic data remains dominant, with employment figures released by the Institute for Supply Management showing no signs of weakness. Speculation about a shift in Federal Reserve policy arose after last week's decline in inflation, but recent indications suggest that the Fed agrees with the view that maintaining the status quo after an inflation downturn would imply passive tightening. The anticipated "preemptive rate cut" in 2024 seems to be a settled matter.
However, traders are increasingly inclined to bet that the Federal Reserve will significantly ease monetary policy next year, setting the stage for the largest monthly decline in the US dollar in the past year. It is noteworthy that when the US dollar weakens, the global economic environment often experiences positive effects. The recent trend of dollar depreciation brings to mind November 2022 when a significant drop in the US Consumer Price Index led to lower US Treasury yields and a softer US dollar, thereby improving financial conditions and boosting the stock market.
Furthermore, the soft November data in the US may be a temporary deviation in the trend, and the forthcoming December data will provide a clearer outlook. In other words, the current momentum suggests a favorable environment for US dollar bears and bond bulls.
From a recent technical trend observation, the recent pullback in the US dollar may be reasonable, as much of the optimism has already been priced in. On the other hand, there is no reason to be overly pessimistic about the US dollar, especially as the economies in other regions may appear worse, such as the Eurozone. The daily chart shows the US dollar index continuing to operate below the lower bound of the Bollinger Bands at 103.18 and below short-term moving averages, including the 5-day (103.86) and 9-day (104.52). The weekly chart also maintains below the midline of the Bollinger Bands at 104.25, suggesting a likelihood of further downside. Targets are set at 102.55 (61.8% Fibonacci retracement level of 99.57 to 107.34) and 102.00 (psychological support level). On the upside, the US dollar index needs to break above 103.86 and 104.25 to temporarily alleviate the recent downtrend. However, both the 2-year and 10-year US Treasury yields are currently trending lower in the short term, indicating that the US dollar may continue to experience volatility or weakness in the future.
Today, one may consider shorting the US dollar index around 103.80, with a stop loss at 103.95 and targets at 103.40 and 103.35.

WTI Spot Crude Oil
The trading price of WTI crude oil in the United States has been above $77.00 on Tuesday. The expectation of further supply cuts by OPEC+ after their meeting early next week continues to drive the WTI price upward. Saudi Arabia, the world's largest oil exporter, is planning to extend the deadline for reducing daily oil production by 1 million barrels until next year. OPEC+ is considering additional production cuts to address the falling prices and increased tensions due to the Israel-Hamas conflict. If an additional production cut agreement is reached, it may boost WTI prices in the short term. However, concerns about global economic slowdown outweigh the prospects of OPEC and its allies (such as Saudi Arabia and Russia) deepening supply cuts.
The U.S. Chamber of Commerce announced on Monday that the leading indicators for October decreased by 0.8%, following a 0.7% decrease in September. The report suggests that inflation, high interest rates, and shrinking consumer spending could lead the U.S. economy into a recession in a short period, potentially limiting the upward space for WTI prices. Additionally, U.S. crude oil inventory data for the week ending November 17 will be released on Tuesday and Wednesday, including weekly crude oil inventory from API and EIA. These data could have a significant impact on WTI prices quoted in U.S. dollars, with oil traders seeking trading opportunities based on this information.
From a technical perspective, WTI crude oil rebounded by around 2.0% yesterday. The technical analysis indicates a short-term recovery, as Friday's daily candle closed with a bullish inside bar. Despite the weekend gap, oil prices continued to rise, encountering resistance around $78.94 (50% Fibonacci retracement level from $63.93 to $93.94) and $79.13 (20-day moving average). Breaking these levels could push prices above $80.00 (a psychological market barrier). The overall structure still appears bearish, and the daily closing price must exceed the $78.55 threshold to confirm a change in structure. This would be a positive sign, indicating that investors can push and reclaim the $80.00 per barrel level; otherwise, a retest of $75.39 (61.8% Fibonacci retracement level from $63.93 to $93.94) and $73.74 (July 17th low) may occur, followed by $70.35 (78.6% Fibonacci retracement level from $63.93 to $93.94) and $70.00 (psychological market barrier).
Consider going long on crude oil near $77.40 today, with a stop-loss at $77.00 and targets at $78.90 and $79.00.

XAUUSD
The minutes of the meeting released on Tuesday, November 21st, indicate that Federal Reserve officials showed no inclination to cut interest rates in the near term, especially with inflation still significantly above the Fed's target. Gold prices rose to a two-week high of $2007.60 as of Tuesday's Asian session, gaining strong momentum after bouncing from the $1966-$1965 region overnight, reaching $1994.
The latest U.S. data shows a slowdown in the job market and easing inflationary pressures, fueling speculation that the Fed might start easing monetary policy earlier than expected. The further decline in U.S. Treasury yields strengthens this speculation, pushing the U.S. dollar to its lowest level since August 31 and bringing gold, a zero-yield asset, back near the two-week high touched last Friday. Despite generally positive risk sentiment, strong upward movement in gold prices doesn't seem to be affected, and risk appetite tends to weaken safe-haven gold prices. The Chinese government's commitment to introduce more stimulus measures has boosted investor confidence. Even as a weakening U.S. dollar continues to be a tailwind for precious metals, the above news still supports market optimism.
Meanwhile, the largest gold-backed ETF, SPDR Gold Trust, increased its holdings by 1.49% to 883.43 tons, indicating that investor interest in gold continues to exist amid the changing economic situation. In the short term, gold prices will remain highly sensitive to changes in U.S. monetary policy and economic indicators.
From a technical perspective, after breaking through the previous week's consolidation high of $1993.00 yesterday, some follow-up buying emerged, lifting gold prices back above the psychological level of $2000. This momentum could further expand, retesting the multi-month high around $2009.50 touched in October. If gold prices continue to strengthen, it could become a new trigger point for bearish traders, laying the foundation for a strong rebound from below the 200-day moving average of $1938.00 in recent times. The next levels to watch would be $2009.50 (October 27th high) and $2017.70 (76.4% Fibonacci retracement level from $2081.80 to $1810.50). On the other hand, the region around $1975.40 (Powerful Central Axis) currently seems to provide support, followed by the $1965 region, the oscillation low point on Monday. If gold prices breach this support, they may accelerate downward, challenging the vicinity of $1950.00 (23.6% Fibonacci retracement level from $2009.50 to $1931.60). If this level is decisively broken, the recent bias may shift to bearish.
Consider going long on gold near $1994 today, with a stop-loss at $1990 and targets at $2009 and $2012.

AUDUSD
On Tuesday, the Australian dollar extended its gains for the third consecutive trading day. The hawkish comments from the Reserve Bank of Australia (RBA) Governor Bloxham contributed to this upward trend. Additionally, the November meeting minutes from the RBA, which released a hawkish tone, rising commodity prices, and optimistic expectations from investors about potential stimulus measures from China, all played a role in boosting the Australian Dollar against the US Dollar.
As highlighted by RBA Governor Bloxham, the Australian labor market appears robust, and he believes that the positive momentum in employment will continue. Furthermore, Bloxham pointed out that the challenge to inflation comes from fundamental demand rather than just supply issues, making inflation a significant concern for the next one to two years. The November meeting minutes of the RBA revealed that the board acknowledged "credible reasons" to prevent an immediate rate hike but considered the reasons for tightening policy more compelling due to increased inflation risks. The decision to further tighten monetary policy will depend on data and risk assessments, with an emphasis on the importance of preventing even a modest increase in inflation expectations.
From a technical perspective, on Tuesday, the AUD/USD pair rose to around 0.6586. The AUD/USD may encounter resistance near 0.6600 (a psychological market barrier) and 0.6647 (250-day moving average) levels. If these levels are breached, the pair may further challenge 0.6747 (76.4% Fibonacci retracement level from 0.6895 to 0.6270). On the downside, the vicinity of the psychological level of 0.6500 is expected to provide direct support. If this level is broken, 0.6417 (23.6% Fibonacci retracement level) may become the next support level.
Consider going long on the Australian Dollar near 0.6535 today, with a stop-loss at 0.6510 and targets at 0.6590 and 0.6605.

GBPUSD
The GBP/USD has been on the rise for the third consecutive trading day, with Bank of England Governor Andrew Bailey's speech at the beginning of the week providing further support to the currency pair. During the Asian session yesterday, the GBP/USD traded near 1.2540, close to an 11-week high. Governor Bailey acknowledged that inflation has surpassed the central bank's 2.0% target, but there are signs that the surge in prices, especially in the food sector, is beginning to stabilize. Prime Minister Sunak announced a plan to reduce taxes after a decline in inflation ahead of the UK Autumn Budget. It is expected that Chancellor of the Exchequer Jeremy Hunt will unveil measures aimed at accelerating economic growth, with plans to stimulate business investment being a key initiative.
The U.S. dollar index has declined for the third consecutive trading day, approaching the three-month low near 103.40. The decline is attributed to rising risk appetite and falling U.S. bond yields. After the release of softer-than-expected inflation data last week, market expectations are leaning towards a more dovish stance from the Federal Reserve, contributing to positive market sentiment.
From a technical perspective, the GBP/USD has room for further upside. To maintain the upward momentum, the pair must stay above 1.2446 (200-day moving average), with key support above last Friday's low of 1.2374. As long as it remains above last week's high of 1.2505, the upward momentum will likely strengthen. Given the current trend, the first rebound target is 1.2565 (upper channel line of the Power Channel), and any upward movement should effectively hold above 1.2600 (psychological market barrier) to open up space to the September high of 1.2713. On the downside, attention can be directed to the 200-day moving average at 1.2446, with the next level at 1.2298 (23.6% Fibonacci retracement level from 1.3143 to 1.2037).
Today's recommendation is to go long on the British Pound near 1.2510, with a stop-loss at 1.2485 and targets at 1.2580 and 1.2590.

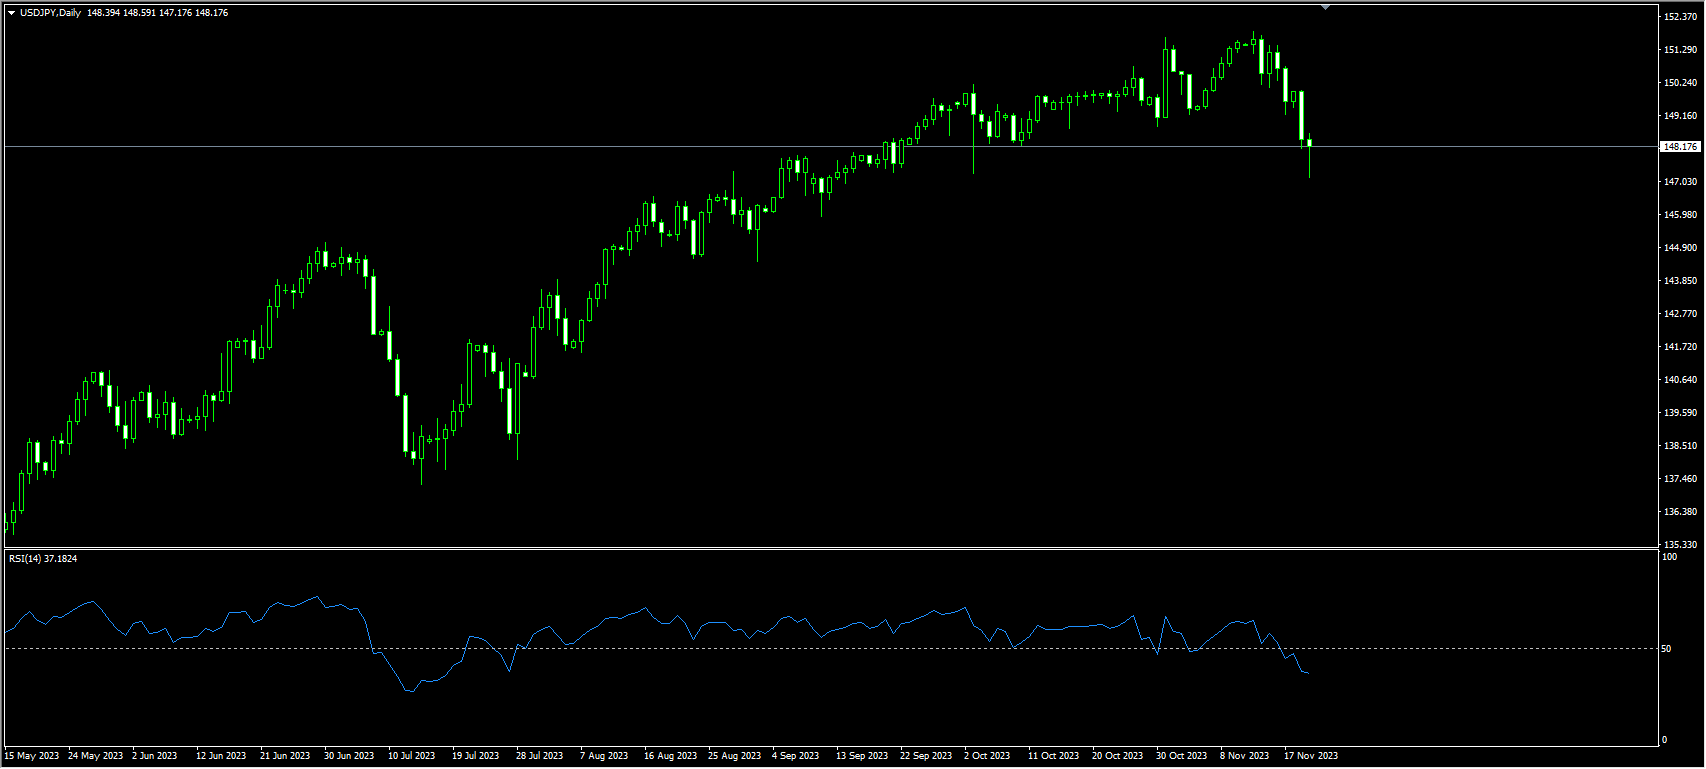
USDJPY
The USD/JPY has been on a downward trend for four consecutive trading days, reaching a low of 147.15 yesterday, the lowest point since September 11th. This indicates a relatively strong downside momentum for the USD/JPY. Recent economic data from the United States shows a decline in economic growth momentum, and there is a clear trend of falling inflation rates. Although the Federal Reserve maintains its stance on keeping the door open for further rate hikes, the market has already ruled out the possibility of another rate hike by the Fed and is even trying to determine when the Fed will start cutting rates. According to the FedWatch tool from the CME, the market currently expects a probability of over 50% that the Fed will cut interest rates by at least 25 basis points before May next year. This expected interest rate trend in the market is likely to further depress US bond yields. The interest rate differential between the US dollar and the Japanese yen is expected to gradually narrow, and the trading pattern of borrowing low-cost yen to invest in the US dollar may undergo a change.
On the daily chart, the USD/JPY broke below the lower support line of the ascending channel at 150.20 at the beginning of the week, and it has pulled out a series of long bearish candles for four consecutive trading days, reaching the low of 147.15 since September 11th, indicating a relatively strong downward momentum for the USD/JPY. Various technical indicators also show a clear downward trend. It is expected that the USD/JPY will continue its downward trend and open the door for a retreat to the 146.54 (100-day moving average) and 144.43 (September 1st low) areas. If the USD/JPY resumes an upward trend, the resistance levels above are at 149.47 (50-day moving average), 150.00 (psychological market barrier), and then 150.26 (Powerful Central Axis).
Today's recommendation is to short the USD near 148.55, with a stop-loss at 148.80 and targets at 147.50 and 147.35.
EURUSD
During the early European session on Tuesday, the weakening of the US dollar and the decline in US Treasury yields provided some support for the Euro/US Dollar (EUR/USD) pair. The EUR/USD entered a bullish consolidation phase, oscillating within a narrow trading range below 1.1000 (a psychological market level). Increasingly, analysts believe that the Federal Reserve has concluded its policy tightening cycle, keeping the US dollar subdued and near its lowest levels in over two months. In fact, the market has discounted the possibility of further interest rate hikes by the Federal Reserve and anticipates the potential for the Fed to begin cutting rates soon. Meanwhile, expectations for future policy actions by the Federal Reserve have weighed on the 10-year US Treasury yields, pushing them to a two-month low. Additionally, the risk-on environment is seen as suppressing the safe-haven US dollar, providing a tailwind for the Euro/US Dollar pair.
Furthermore, recent hawkish statements from European Central Bank officials, denying expectations of an early rate cut, are expected to boost the Euro/US Dollar. Joachim Nagel, the President of the German Central Bank, stated last Friday that starting rate cuts too early would not be wise. In addition, Robert Holzman, a decision-maker at the European Central Bank, believes that a rate cut in the second quarter is premature. This further indicates that the resistance to the upside for the Euro/US Dollar is minimal.
Looking at the 4-hour chart, the bullish potential for the Euro/US Dollar remains intact, as the major currency pair is above the 50-hour (1.0805) and 20-hour (1.0897) moving averages. It is noteworthy that the RSI (Relative Strength Index) is in the bullish zone above 50. However, the overbought condition of the RSI suggests the possibility of further consolidation before a recent appreciation of the Euro/US Dollar. Nevertheless, the recent resistance level for the Euro/US Dollar is near the upper line of the Bollinger Bands at 1.0977. The key upward obstacles are at the psychological level and the high point of August 11th at 1.1000. If there is follow-up buying, the Euro could rebound to the high point of August 4th at 1.1042, subsequently reaching the high point of July 27th at 1.1149. On the downside, the 1.0895-1.0900 area is the initial support level for the currency pair. These levels coincide with the psychological level and the high point of November 16th. Further down, the next support level will appear near the lower line of the Bollinger Bands at 1.0816. If breached, the Euro will decline to the high point of November 9th at 1.0725.
Today's recommendation is to go long on the Euro before 1.0900, with a stop-loss at 1.0875 and targets at 1.0965 and 1.0975.

Disclaimer: The information contained herein (1) is proprietary to BCR and/or its content providers; (2) may not be copied or distributed; (3) is not warranted to be accurate, complete or timely; and, (4) does not constitute advice or a recommendation by BCR or its content providers in respect of the investment in financial instruments. Neither BCR or its content providers are responsible for any damages or losses arising from any use of this information. Past performance is no guarantee of future results.
More Coverage


Risk Disclosure:Derivatives are traded over-the-counter on margin, which means they carry a high level of risk and there is a possibility you could lose all of your investment. These products are not suitable for all investors. Please ensure you fully understand the risks and carefully consider your financial situation and trading experience before trading. Seek independent financial advice if necessary before opening an account with BCR.

 English
 简体中文
简体中文
 繁體中文
繁體中文
 Bahasa
Melayu
Bahasa
Melayu
 Tiếng
Việt
Tiếng
Việt
 ไทย
ไทย
 日本語
日本語
 한국어
한국어
 ភាសាខ្មែរ
 español