


0
The US Dollar Index
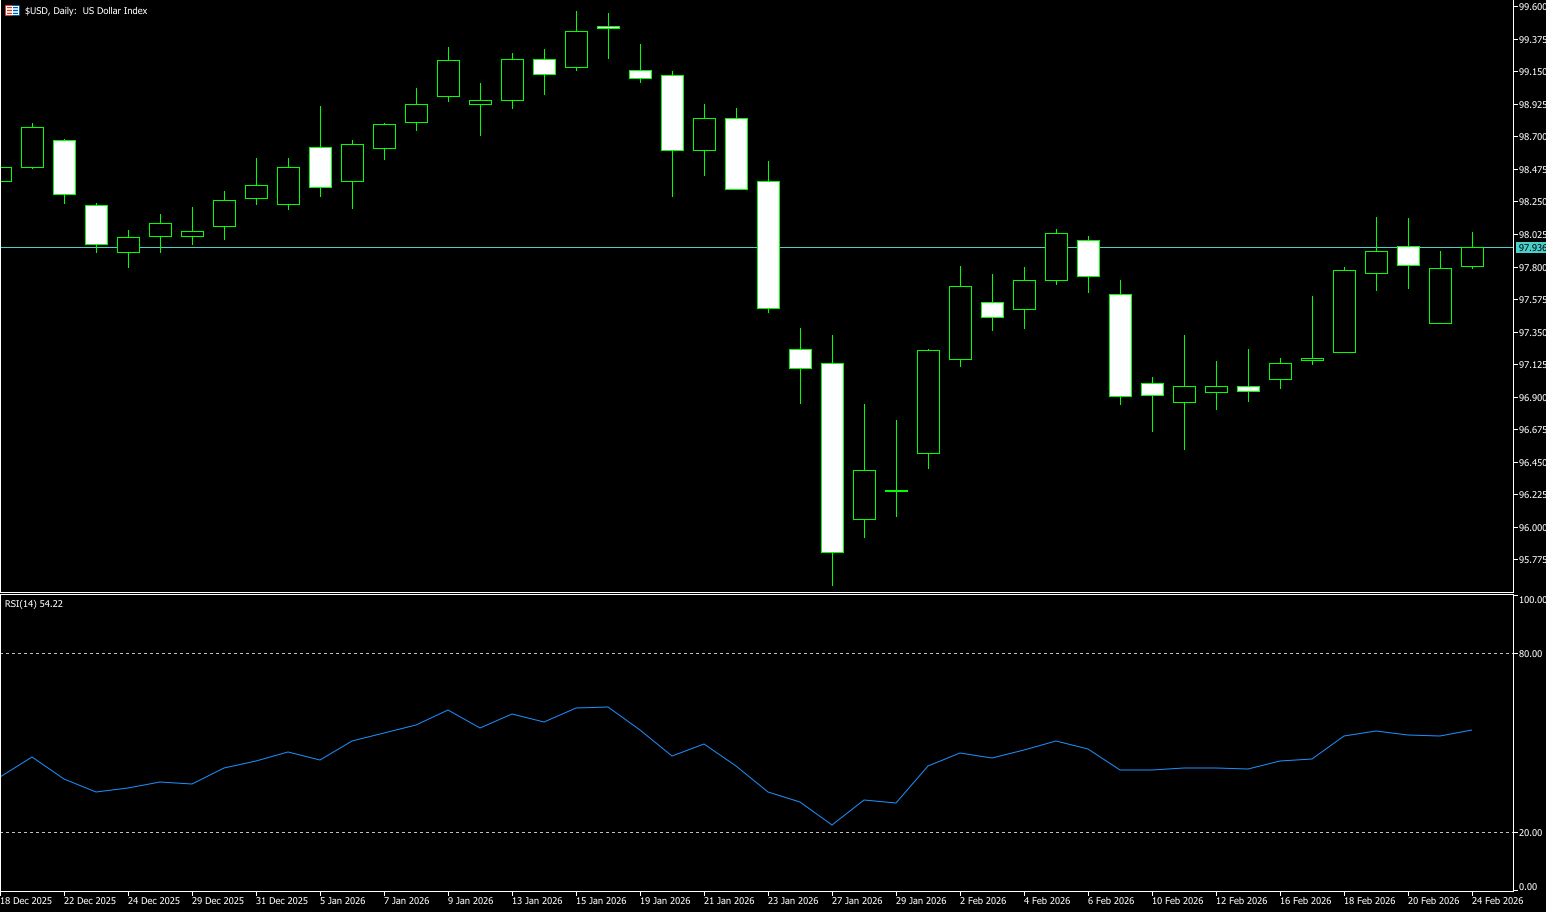
The US dollar index climbed above 97.80 on Tuesday, after being pressured in the previous session, as investors continued to assess US trade uncertainty. In the latest development, global logistics giant FedEx filed a lawsuit seeking a full refund after the US Supreme Court overturned President Trump's emergency tariffs. Over the weekend, Trump threatened to raise global tariffs from 10% to 15% in response to the ruling and warned that countries "playing the game" could face even higher tariffs. This shift in the policy context has raised concerns about the potential collapse of current trade agreements, although major trading partners have so far adhered to their agreements with Washington. Geopolitically, markets remain focused on the scheduled resumption of US-Iran talks on Thursday. Elsewhere, Japanese media claimed that US authorities orchestrated last month's currency checks to support the yen.
At this stage, the market seems to have forgotten all these factors supporting the dollar after Trump's renewed tariff threats. Against this backdrop favorable to dollar bears, the recent rally from the three-year low hit in January may have ended. From a technical perspective, the US dollar index attempted to break through the 97.86 support/resistance level twice this month but failed. Current resistance lies at this price level and the upper boundary of the trading range at 97.61. Last week's failure near 98.00 formed a bearish double top pattern on the daily chart. This pattern, formed after repeated failures near the 200-day simple moving average at 98.38, confirms the negative outlook. However, bullish traders may choose to wait for sustained support near the 97.15 (20-day moving average) and 97.00 (psychological level) levels before making new buy bets.
Today, consider shorting the US dollar index near 97.98; Stop loss: 98.10; Target: 97.60; 97.50
WTI Crude Oil
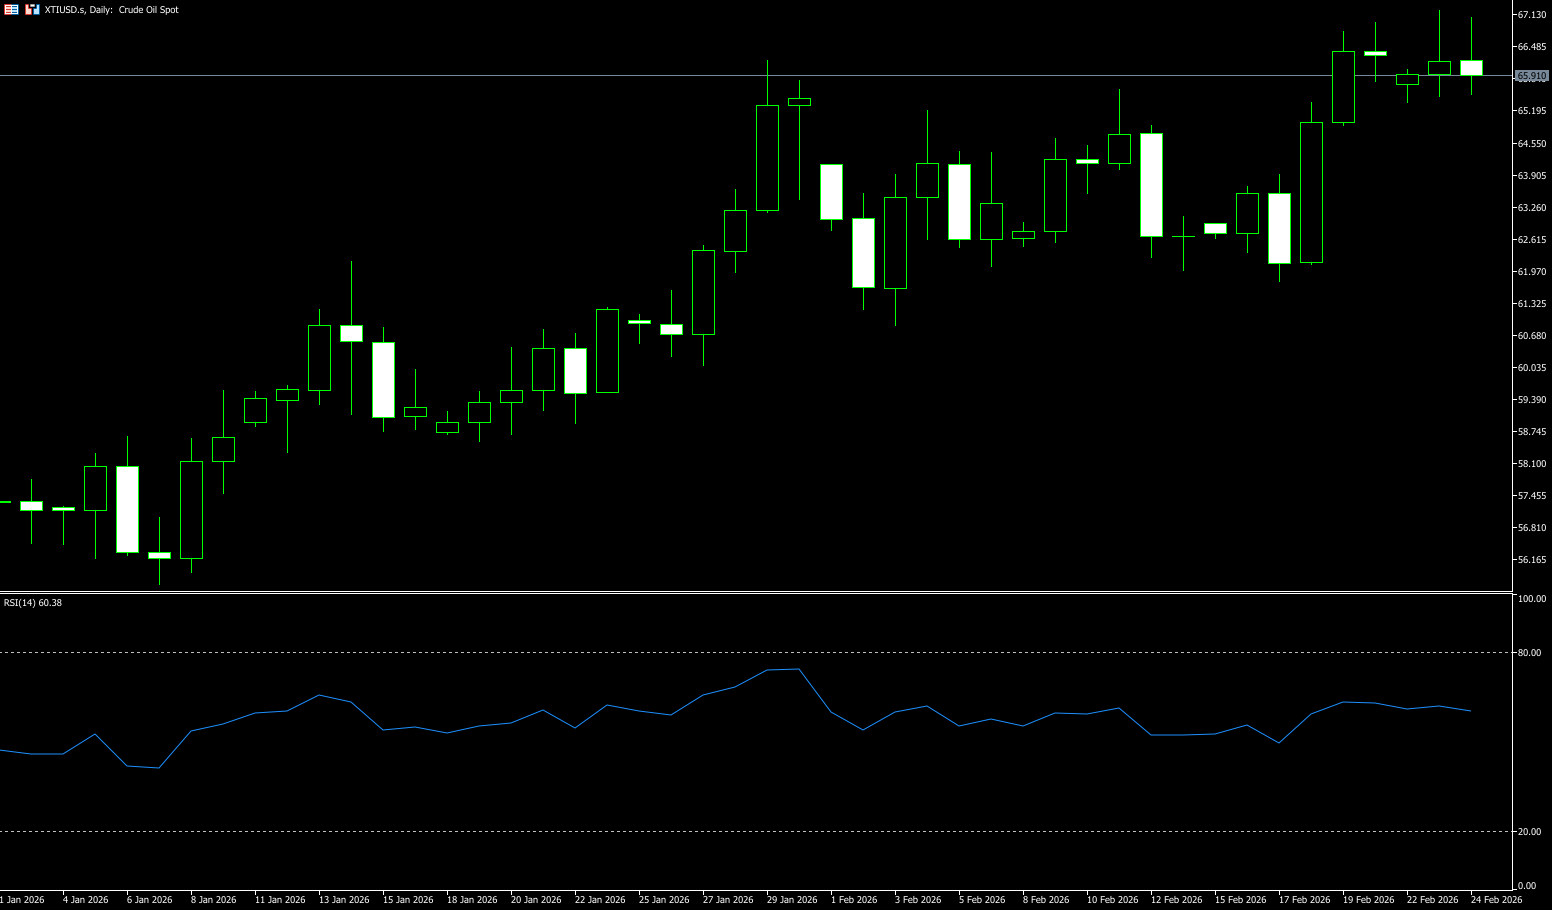
WTI crude oil rose to around $66.91 per barrel on Tuesday, its highest level in nearly seven months, as investors closely watched a new round of negotiations between the US and Iran. President Trump said on Monday he preferred a deal with Iran, with talks scheduled to resume on Thursday, but warned that Tehran would face a "very bad day" if a nuclear agreement failed. Trump also dismissed reports that the Pentagon was concerned about the risks of a protracted military operation against Iran. Concerns about a potential military conflict in the Middle East, along with several supply disruptions, have recently supported oil prices, offsetting expectations of a massive surplus this year. Meanwhile, traders are assessing re-emerging trade risks as Trump prepares to introduce new tariffs after the Supreme Court overturned many of his broad-based tariffs.
Technically, the daily chart shows prices consolidating in a high-level range after the previous rally. The $68.37 level (the high from July 14th last year) and the $70.00 level (a psychological level) constitute strong resistance. A significant breakout would typically require a new, strong stimulus to further increase risk premiums or attract trend-following funds. On the downside, key levels to watch are the support and resistance around the psychological level of $64.00 and the 20-day moving average around $64.27. More crucial support lies near the 200-day moving average, which is closer to the previous consolidation zone. A break below this level could prompt the market to reassess whether the current premium is excessive. In terms of indicators, the MACD shows a bullish structure, but the momentum isn't extremely strong, resembling a high-level correction after an upward move. The RSI is at 61.30, in a slightly bullish but not overheated range, consistent with "strong consolidation" rather than "unilateral acceleration."
Today, consider going long on crude oil around 65.90; stop loss: 65.70, target: 67.50; 67.60
Spot Gold
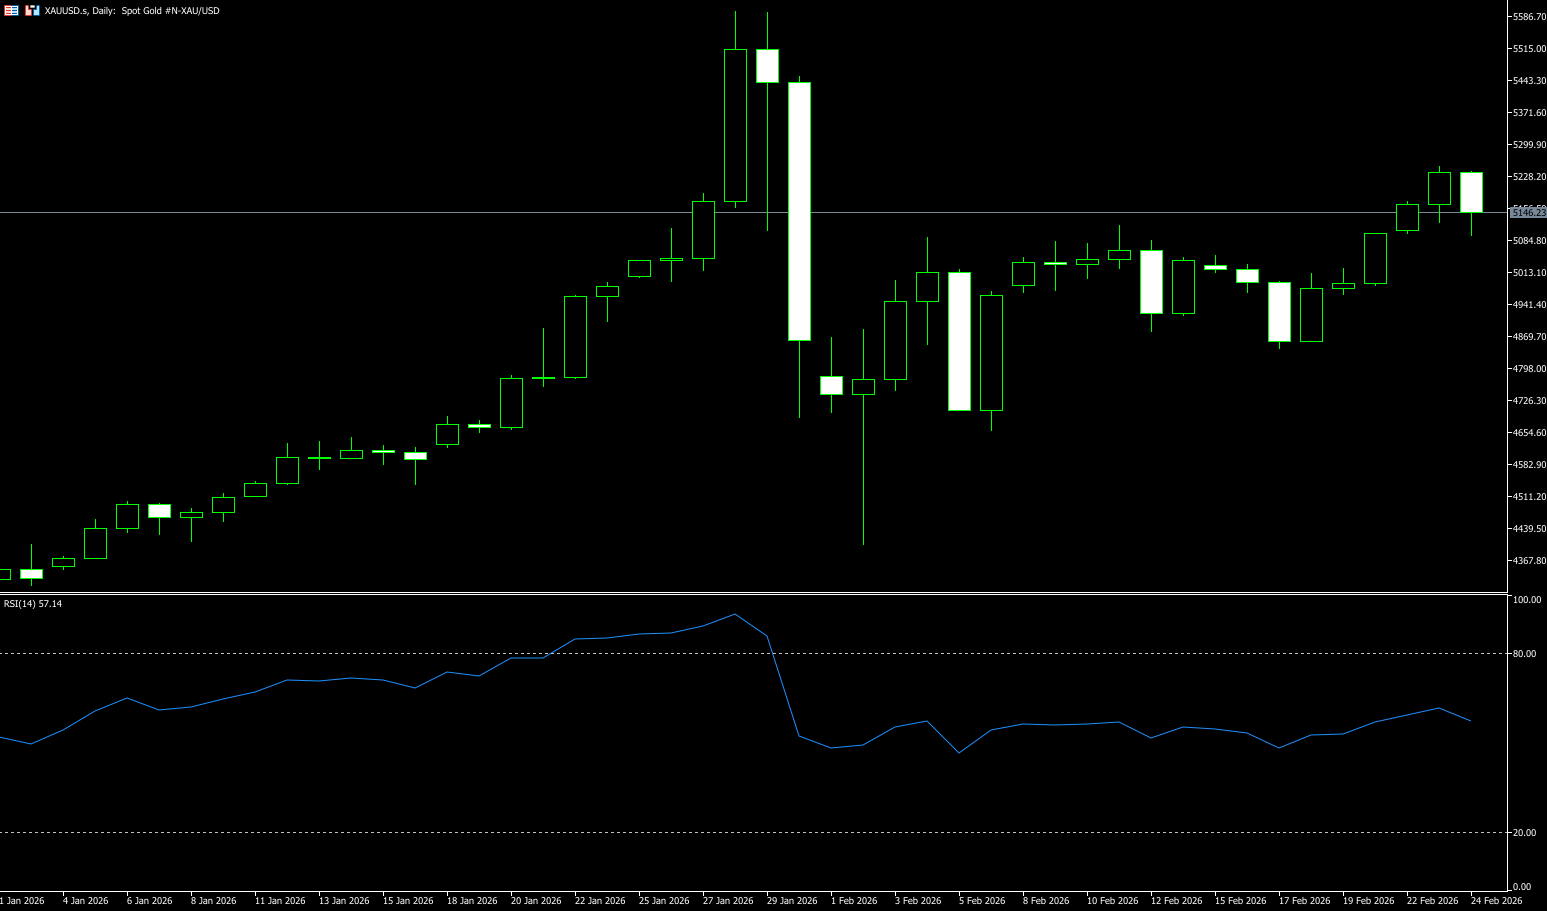
On Tuesday morning in Asian trading, spot gold was trading around $5,230 per ounce. Gold prices surged on Monday, reaching a three-week high of $5,238, after Trump announced a temporary tariff increase to 15%. This new round of policy uncertainty exacerbated market risk aversion, driving funds into gold. Approaching the key $5,300 level, the escalating geopolitical tensions between the US and Iran and the upcoming negotiations have made this traditional safe-haven asset a focus of market attention. The core driver of gold's continued strength is the global market panic and uncertainty triggered by Trump's tariff policies. This adjustment, contrary to Trump's previous stance, has become a new lever in great power competition, further disrupting the global trade landscape, exacerbating market anxiety, and continuously strengthening gold's safe-haven attributes, providing strong support for its price.
For gold, a short-term technical correction risk should be noted. In the next 2-3 trading days, the gold market will face a dual battle between technical and fundamental factors. Technically, spot gold has entered a key resistance zone: the $5,238-$4,250 level, the high point of the beginning of this week, forms a direct short-term resistance area. A break above this level could lead to further gains towards the $5,300 psychological level and the previous historical high of $5,598. However, momentum indicators show that the RSI is approaching overbought territory, and while the MACD histogram is expanding, its rate of increase is slowing, suggesting a potential short-term technical correction. Support levels to watch are the $5,104 (5-day moving average) and $5,100 (psychological level). Key support lies at the psychological level of $5,000.
Consider going long on gold around 5,135 today; Stop loss: 5.130; Target: 5,180; 5,200
AUD/USD
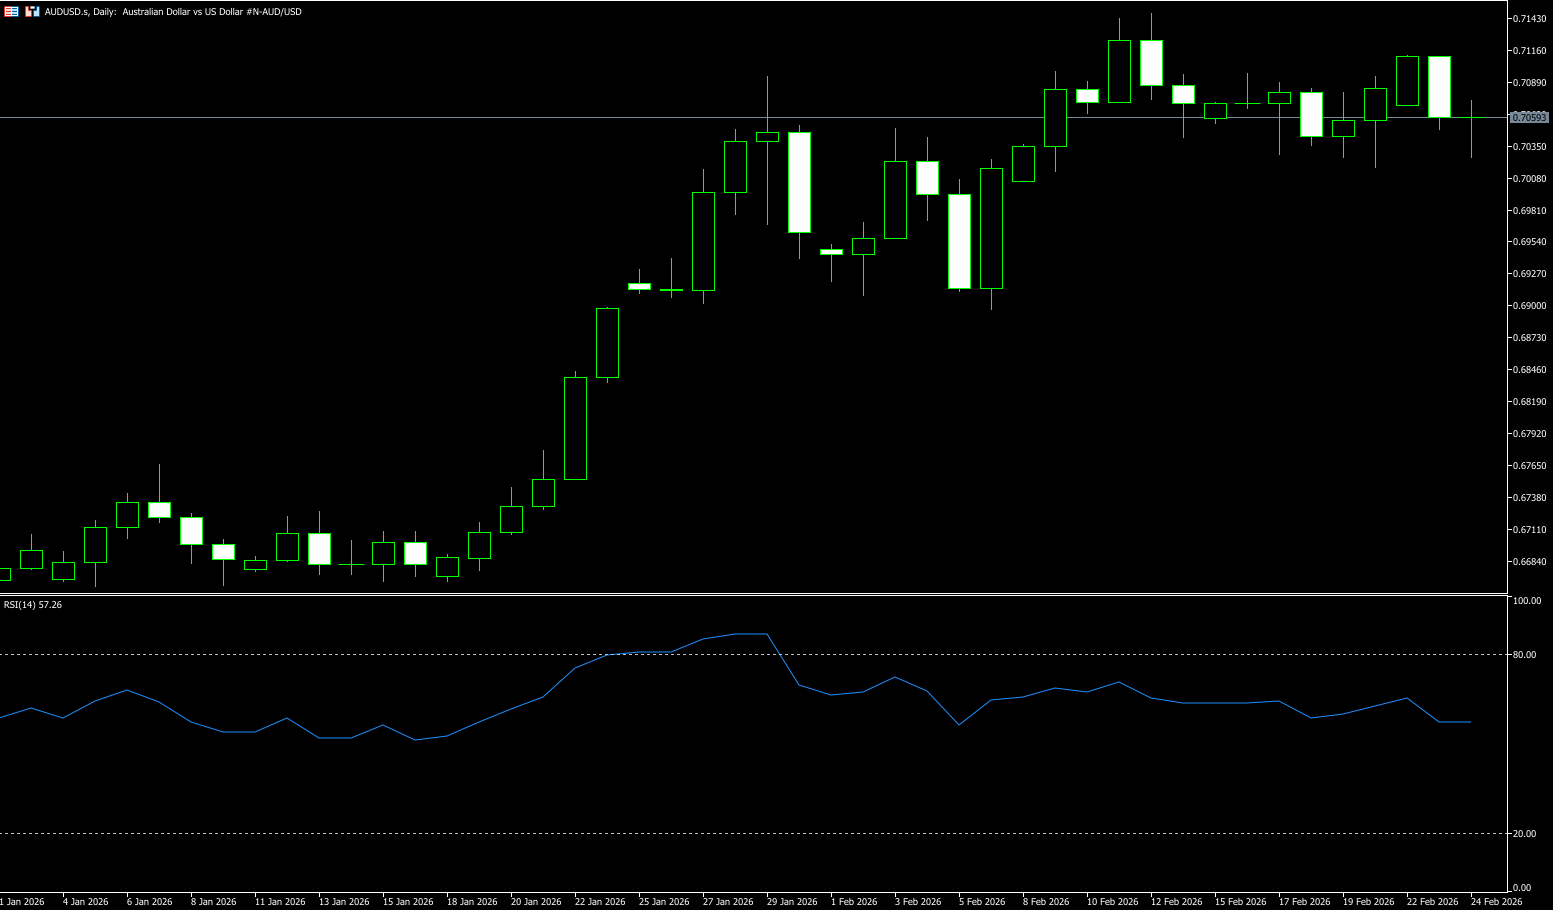
The Australian dollar stabilized around US$0.7060 on Tuesday, trading near a three-year high, as investors braced for upcoming inflation data, which is expected to reinforce a hawkish policy outlook. Wednesday's January consumer price data is expected to show annual growth slowing only slightly to 3.7%, below 3.8%, while core inflation is expected to remain at 3.3%, marking the fifth consecutive month above the central bank's 2-3% target range. The 0.9% growth in the December quarter triggered the recent rate hike, and a repeat of this growth in the March quarter could further increase pressure for another rate hike in May. The market expects a roughly 70% probability of a 25 basis point rate hike to 3.85% in May. All eyes will also be on Reserve Bank of Australia Governor Bullock at a University of Melbourne event Wednesday evening, where any hawkish signals could further boost the Australian dollar. A weaker US dollar also provided support due to the continued uncertainty surrounding President Trump's tariff plans.
On the daily chart, the AUD/USD pair fell for the week, retreating from an attempt to reclaim the 0.7100 level. The pair continues to trade above the 25-day simple moving average at 0.7010 and the psychological level of 0.7000, confirming the overall uptrend from the January low of 0.6667 remains valid. The stochastic oscillator has turned bearish and retreated from overbought territory, suggesting weakening short-term momentum after reaching the year-to-date high of 0.7147. Recent trading sessions have shown a cluster of small-bodied candles and doji patterns appearing in the 0.7050-0.7100 range, pointing to indecisiveness. Immediate support lies at 0.7010 and 0.7000, while resistance is at Monday's high of 0.7112 and the February 12 high of 0.7147. A sustained break above this level would open the door to 0.7200, while a break below 0.7000 could see a deeper pullback towards the 30-day simple moving average at 0.6960.
Consider going long on the Australian dollar today around 0.7050; Stop loss: 0.7040; Target: 0.7105; 0.7115
GBP/USD
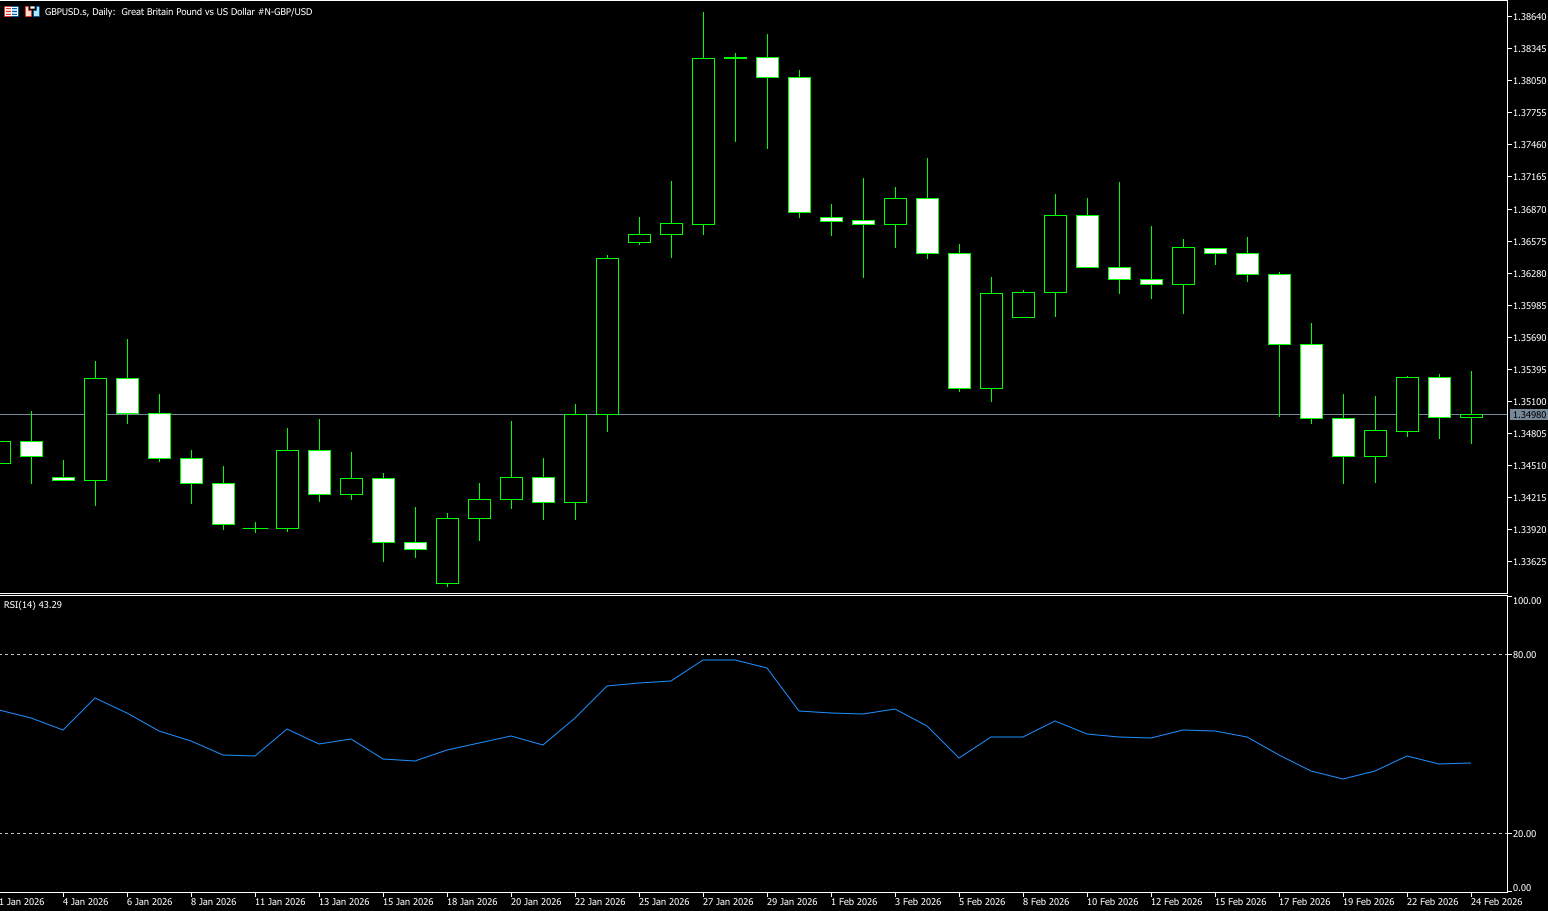
The pound/dollar pair retreated slightly after two consecutive days of gains, trading around 1.3490 on Tuesday. The pair fell as the dollar rebounded from losses of the previous two days. However, the pound/dollar could rebound if the dollar faces renewed pressure, as foreign investors flee US assets amid heightened trade uncertainty. The Trump administration is considering new national security tariffs on multiple sectors after the Supreme Court ruled several tariffs imposed during his second term invalid. On monetary policy, Christopher Waller stated that his decision to support a rate cut at the March Federal Open Market Committee meeting would depend on February's labor market data. Meanwhile, the pound remained under pressure amid rising market expectations that the Bank of England might begin cutting interest rates as early as March, reflecting weak labor market conditions and slowing inflation.
On the daily chart, GBP/USD started the week largely flat around 1.35, with no clear trading direction. The pair traded below the 50-day simple moving average at 1.3533, having broken below it during the pullback from the January high of 1.3869, while the 200-day simple moving average at 1.3446 remains below it. The broader structure shows a correction from the 1.3869 high, with the pair roughly retracing half of the gains from the December low of 1.3287. The stochastic oscillator has turned bearish and entered oversold territory, suggesting that selling pressure from the February pullback may be nearing exhaustion. Recent candlesticks show small bodies and an overlapping range near 1.3500, consistent with the market searching for direction. The immediate support level is at the 200-day simple moving average at 1.3446, followed by 1.3400 (a psychological level), while resistance levels are at the 50-day simple moving average at 1.3533 and the 1.3600 (a psychological level).
Consider going long on GBP/JPY today around 1.3484; Stop loss: 1.3470, Target: 1.3540; 1.3550
USD/JPY
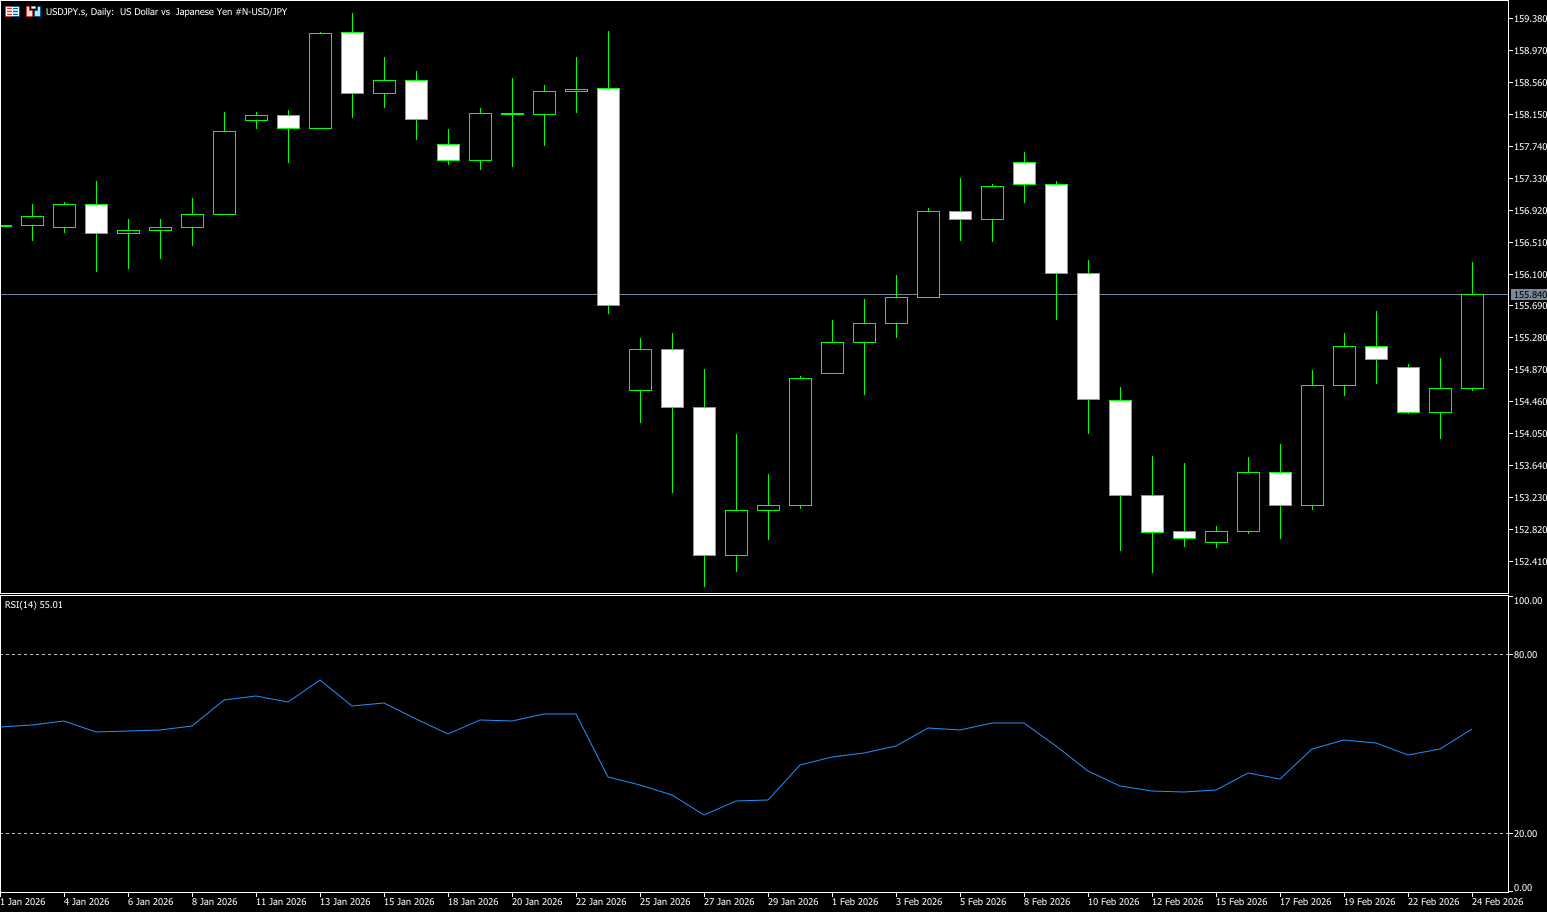
USD/JPY rose nearly 1% in Tuesday's European session, trading as high as approximately 156.20. The pair gained as the yen weakened sharply following a Mainichi Shimbun report that Prime Minister Sanae Takaichi expressed concerns about further interest rate hikes during her meeting with Bank of Japan Governor Kazuo Ueda on February 16. According to the report, Takaichi's opposition to additional short-term tightening could complicate the Bank of Japan's policy timetable, as coordination with the government becomes more sensitive. Conversely, Ueda stated that the discussions broadly covered economic and financial developments, adding that the Prime Minister did not make any specific monetary policy requests. Meanwhile, USD/JPY also appreciated as the dollar rebounded from losses in the previous two days. However, the dollar's gains may be limited as foreign investors shy away from US assets due to increased trade uncertainty. Traders will be watching the US ADP employment change four-week moving average data later in the day, as well as speeches from Federal Reserve officials.
From a technical perspective, the MACD is currently still in a recovery phase. Although bearish momentum has weakened compared to the previous period, a trend reversal has not yet been fully confirmed. Meanwhile, the RSI reading is at 50, a neutral level, indicating that the forces of bulls and bears are temporarily in equilibrium. In this context, future price movements are more easily driven by unexpected events and changes in market expectations, and a directional choice could occur at any time. From a trading structure perspective, the 154.90-155.00 area is a consolidation zone after the previous decline, a focal point of contention between bulls and bears. The first resistance level to watch is around 156.20 (Tuesday's high). A break above this level would target a strong resistance zone between 156.50 and 157.00. Only a decisive break and hold above this zone would allow the price to retest higher levels. Conversely, the key support levels to watch are 155.00 (the psychological level) and 154.66 (the 14-day moving average).
Consider shorting the US dollar around 156.00 today; Stop loss: 156.20; Target: 155.10; 155.00
EUR/USD
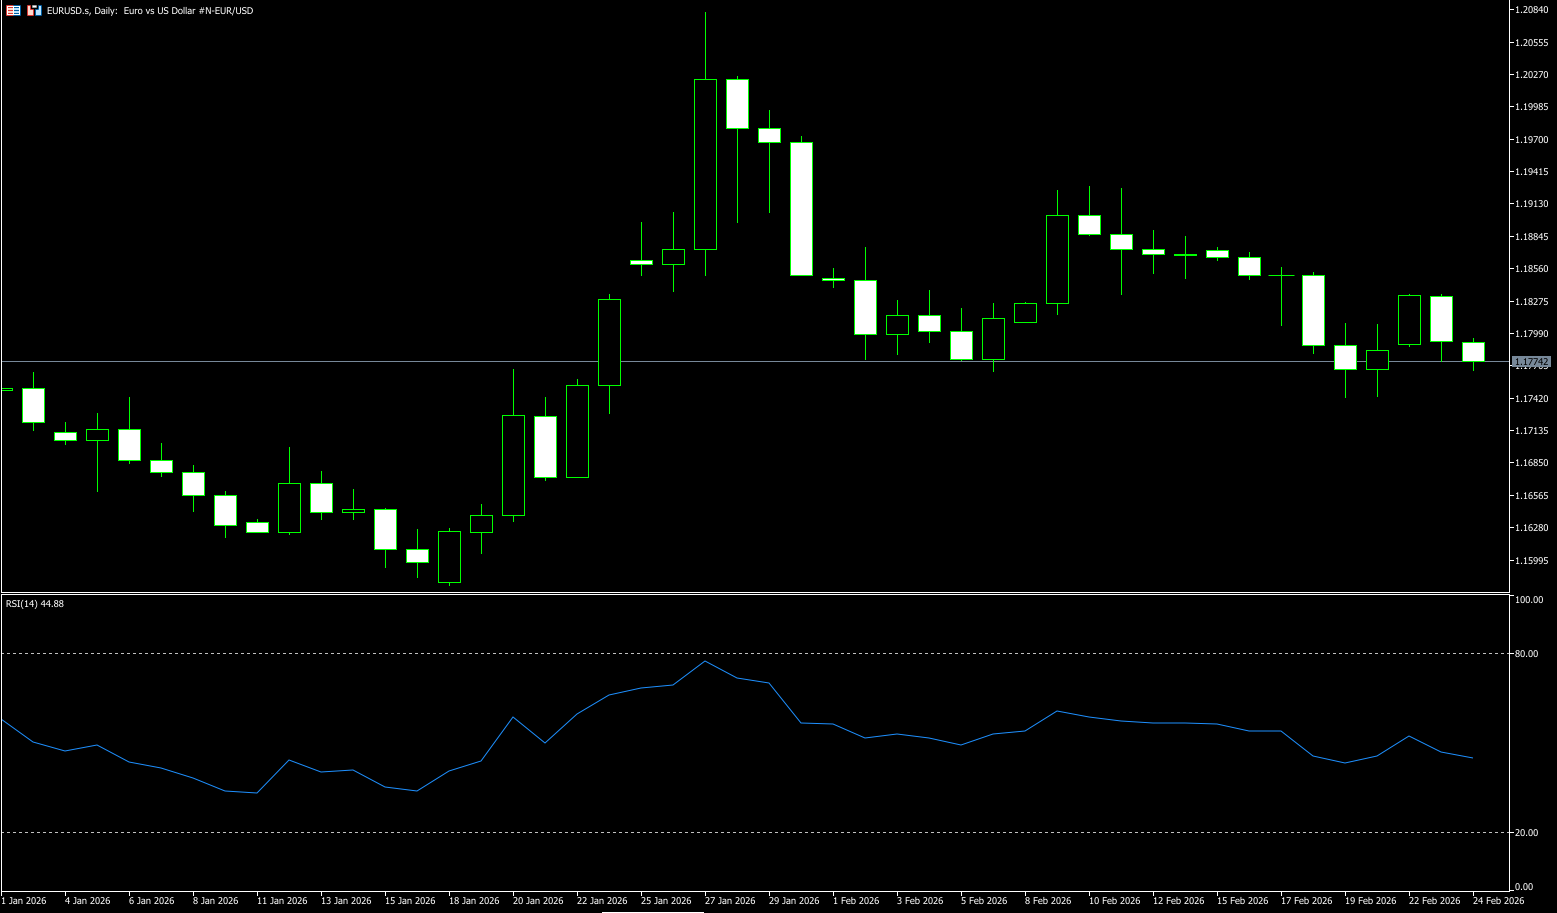
The EUR/USD pair maintained a positive trend around 1.1780 in early Asian trading on Tuesday. The dollar weakened against the euro due to uncertainty surrounding US tariffs. The release of the US January Producer Price Index (PPI) report will be in focus on Friday. Friday's Supreme Court ruling overturned many of the tariffs imposed by President Trump. However, Trump has shown no signs of abandoning his signature economic policies. The government said it plans to implement new 15% tariffs on Saturday. The European Parliament's trade chief said the EU will propose freezing the ratification process of the trade agreement with the US until it receives detailed information from Trump about his trade policies. The new uncertainty surrounding the US trade agreement has put some selling pressure on the dollar and created tailwinds for major currency pairs. US PPI data will be in focus on Friday, and if the report shows results higher than expected, it could provide some support for the dollar in the short term.
At present, the euro/dollar is driven more by the US narrative than by developments in the eurozone. With the Fed's interest rate path in 2026 still lacking clarity and the eurozone yet to provide a convincing cyclical rebound, upward progress is likely to remain slow rather than turn into a clean, sustained breakout. On the daily chart, the euro/dollar is trading around 1.1780. The 50-day moving average has risen above the 100-day and 200-day simple moving averages, all three of which are sloping upwards, reinforcing the bullish bias. This puts buyers in control in the short term. The Relative Strength Index (14) is at 48.20 (neutral), slightly up, indicating that momentum is stabilizing. Immediate resistance is located at the 1.1841 (daily simple moving average) and the 1.1877 (last week's high) area. Next is the 1.1900 (psychological level). Support is located at the 1.1700 (psychological level), followed by the 1.1683 (78.6% Fibonacci retracement level from the low of 1.1590 to the high of 1.2026).
Consider going long on the Euro today near 1.1765; Stop loss: 1.1753; Targets: 1.1830, 1.1840
Disclaimer: The information contained herein (1) is proprietary to BCR and/or its content providers; (2) may not be copied or distributed; (3) is not warranted to be accurate, complete or timely; and, (4) does not constitute advice or a recommendation by BCR or its content providers in respect of the investment in financial instruments. Neither BCR or its content providers are responsible for any damages or losses arising from any use of this information. Past performance is no guarantee of future results.
More Coverage


Risk Disclosure:Derivatives are traded over-the-counter on margin, which means they carry a high level of risk and there is a possibility you could lose all of your investment. These products are not suitable for all investors. Please ensure you fully understand the risks and carefully consider your financial situation and trading experience before trading. Seek independent financial advice if necessary before opening an account with BCR.
BCR Co Pty Ltd (Company No. 1975046) is a company incorporated under the laws of the British Virgin Islands, with its registered office at Trident Chambers, Wickham’s Cay 1, Road Town, Tortola, British Virgin Islands, and is licensed and regulated by the British Virgin Islands Financial Services Commission under License No. SIBA/L/19/1122.
Open Bridge Limited (Company No. 16701394) is a company incorporated under the Companies Act 2006 and registered in England and Wales, with its registered address at Kemp House, 160 City Road, London, City Road, London, England, EC1V 2NX. This entity acts solely as a payment processor and does not provide any trading or investment services.

 English
 简体中文
简体中文
 繁體中文
繁體中文
 Bahasa
Melayu
Bahasa
Melayu
 Tiếng
Việt
Tiếng
Việt
 ไทย
ไทย
 日本語
日本語
 한국어
한국어
 ភាសាខ្មែរ
 español