


0
US Dollar Index
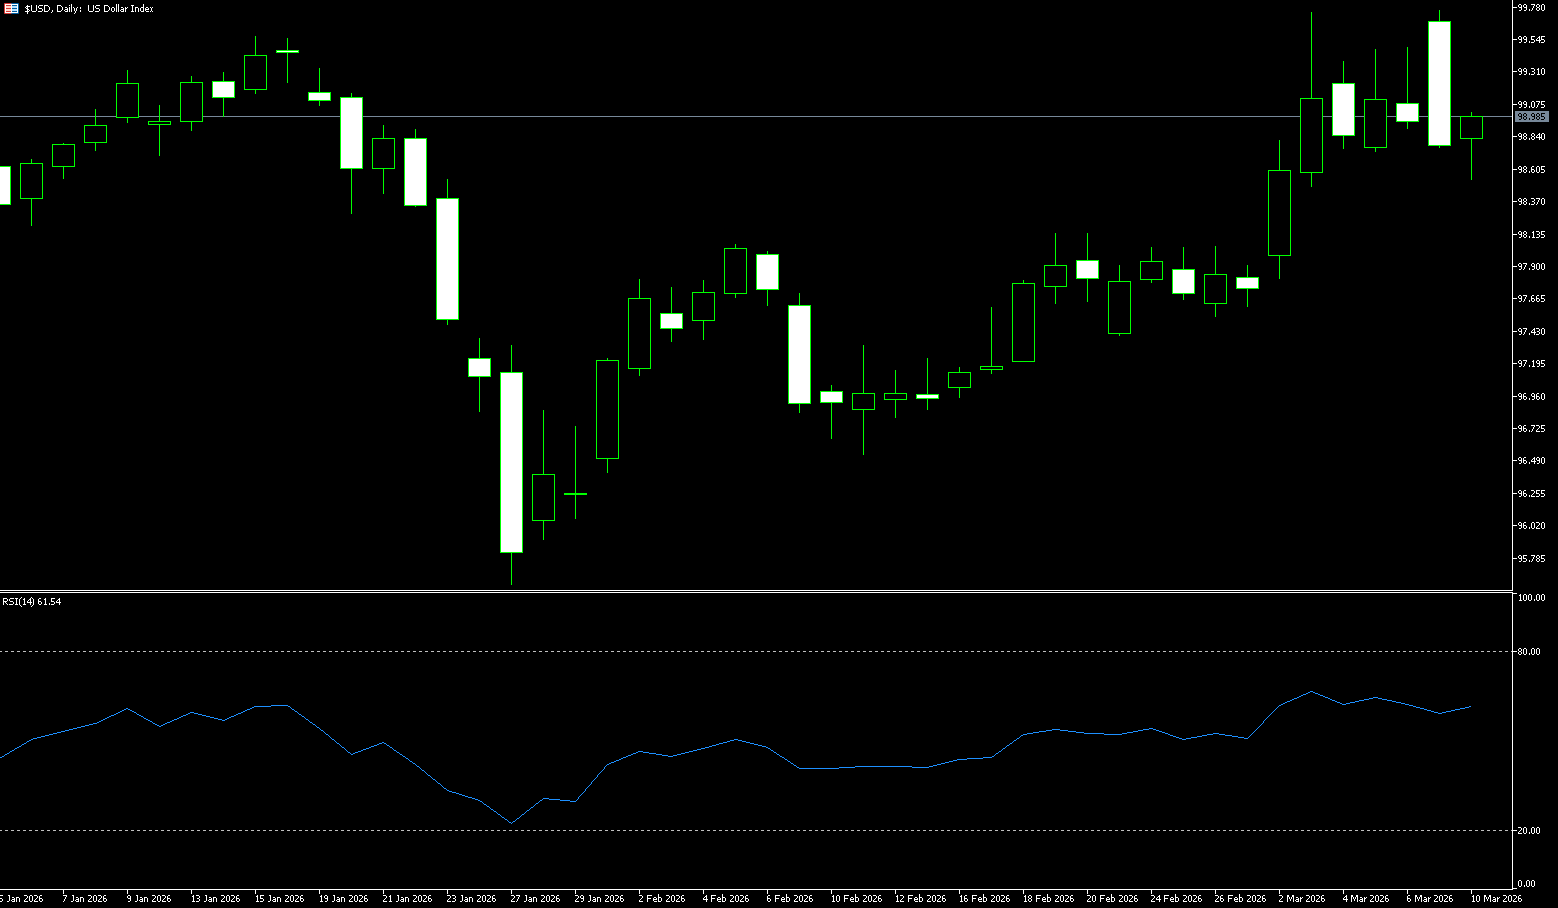
The US dollar index remained below 99 on Tuesday, after experiencing a sharp intraday decline in the previous session, as hopes for a swift end to the war with Iran reduced safe-haven demand for the currency. President Donald Trump stated that the US military operation in Iran was nearing its end, progressing far beyond the initial expected timeframe of four to five weeks. He also indicated plans to lift oil-related sanctions and have the US Navy escort oil tankers through the Strait of Hormuz to help control oil prices. The dollar had previously risen on safe-haven buying as the Middle East conflict and soaring oil prices fueled concerns about prolonged economic disruption and a recovery in inflation. Looking ahead, investors await Wednesday's February Consumer Price Index report and Friday's January Personal Consumption Expenditures Price Index for further clues about inflation trends, although neither is likely to fully reflect the impact of the war with Iran.
From a technical perspective, the US dollar index is currently at 98.84, trading slightly below the 5-day moving average of 98.88, despite being in a pullback phase from its highs. It's worth noting that the MACD indicator on the 4-hour chart has shown a death cross signal, and the bullish momentum bars have completely converged. This means that after encountering selling pressure near 99.70, the US dollar may retrace to the 99.00 level in the short term. The key to the dollar's resilience lies in the strength of US Treasury yields—the 10-year Treasury yield encountered strong resistance at the 200-day moving average near 4.21%, but as long as it remains above 4.13%, the dollar's valuation premium will be difficult to erase quickly. The MACD death cross confirms the short-term downward momentum, and 98.34, as the 200-day simple moving average, provides strong support. The next level to watch is 98.00 (a psychological level). The repeated attempts to break through and then fall back near 99.70 constitute a medium-term technical ceiling. Before that, the 99.44 level (the upper Bollinger Band on the daily chart) should be monitored.
Today, consider shorting the US Dollar Index around 99.00; Stop loss: 99.10; Target: 98.60; 98.50
WTI Crude Oil
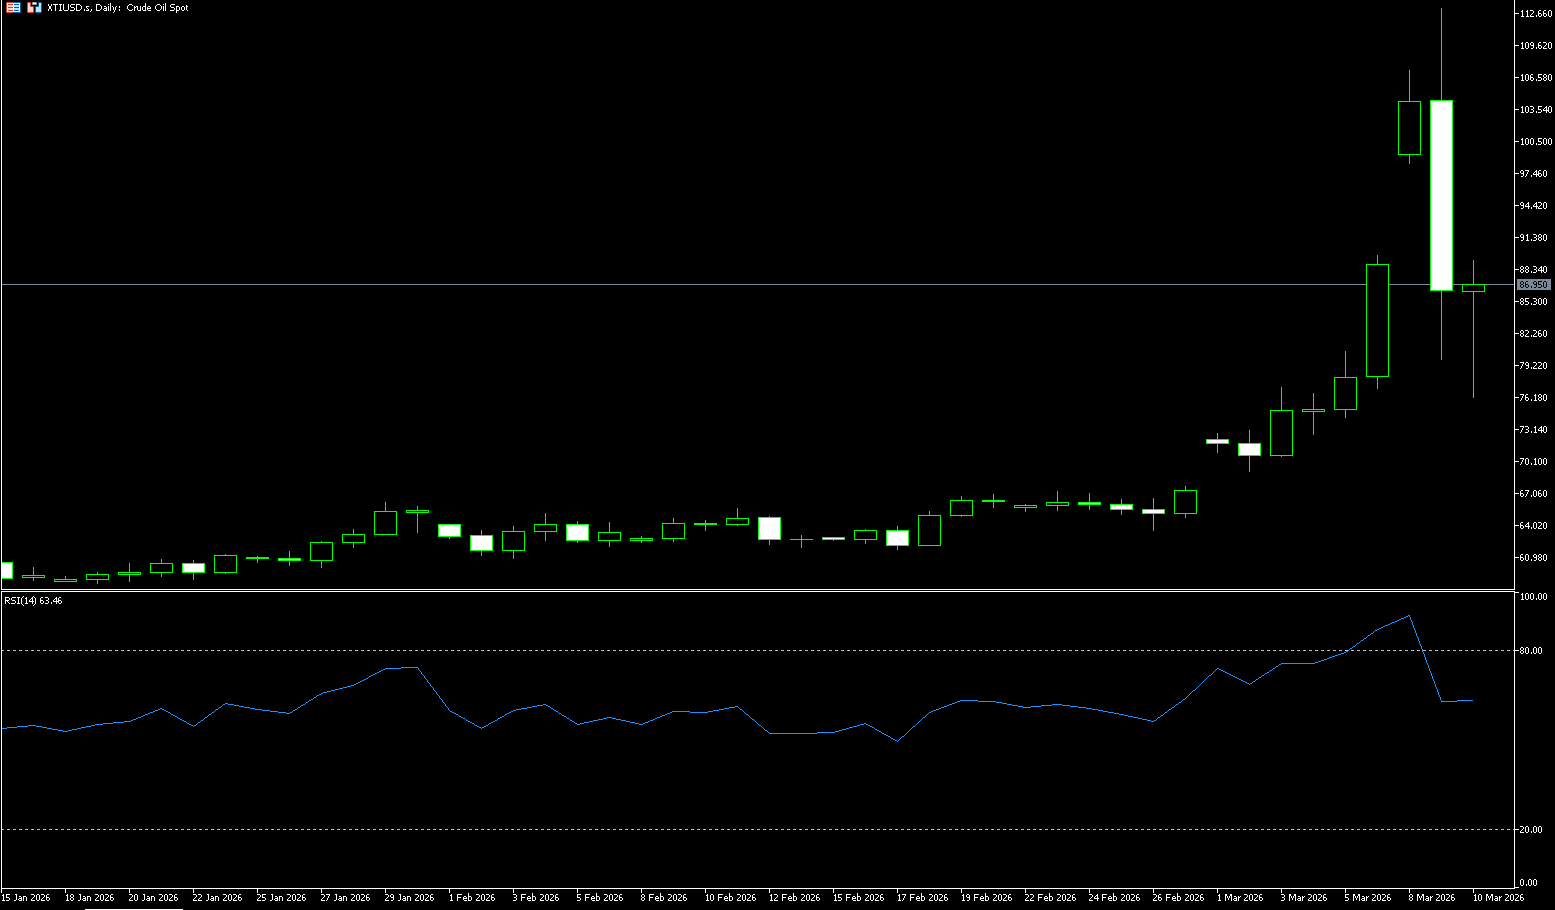
US crude oil traded around $85.00 per barrel on Tuesday. Oil prices surged and then retreated on Monday, rising more than 30% intraday to approach the $113.30 per barrel mark. However, after the market closed, oil prices quickly reversed course and fell by more than 5% in after-hours trading. This was due to news that the Trump administration was considering further easing oil sanctions against Russia to curb oil prices, while Trump hinted that the war against Iran was progressing faster than expected. Other factors, such as various countries considering releasing oil reserves, limited the price increase. In addition, inflation concerns and news that the G7 was preparing to take necessary measures to deal with soaring oil prices (including the possible use of strategic petroleum reserves) also contributed to the price pullback from its highs. Since the outbreak of the war, the two major oil price benchmarks have still risen by more than 35% cumulatively. For traders, the current focus has shifted from a simple supply and demand balance sheet to the limits of logistical substitution capabilities. A key focus is on how Saudi Aramco's unusual tender will reveal a structural shift in global supply dynamics.
Technically, US crude oil futures have largely completed the measured gains of a descending wedge pattern. Currently, influenced by the wide fluctuations in crude oil futures, short-term oil prices may continue to fluctuate. However, due to the very low demand elasticity of crude oil prices, reduced supply will likely continue to drive prices higher, then lower before rebounding. From a trading perspective, the clear signal of the G7's joint release of reserves has quickly suppressed oil price increases, with both Brent and US crude oil prices falling sharply. Technical charts show that short-term to long-term moving averages are arranged in ascending order, and oil prices are maintaining an upward trend along these averages, suggesting that oil prices may continue to rise in the short to medium term. Support levels to watch are $82.54 (9-day moving average) and $80.00 (psychological level). Upside targets are initially at $90 (psychological level) and the $95 area, with subsequent resistance estimated at the psychological level of $100.
Today, consider going long on crude oil around 84.40; stop loss: 84.20, target: 86.00; 87.00
Spot Gold
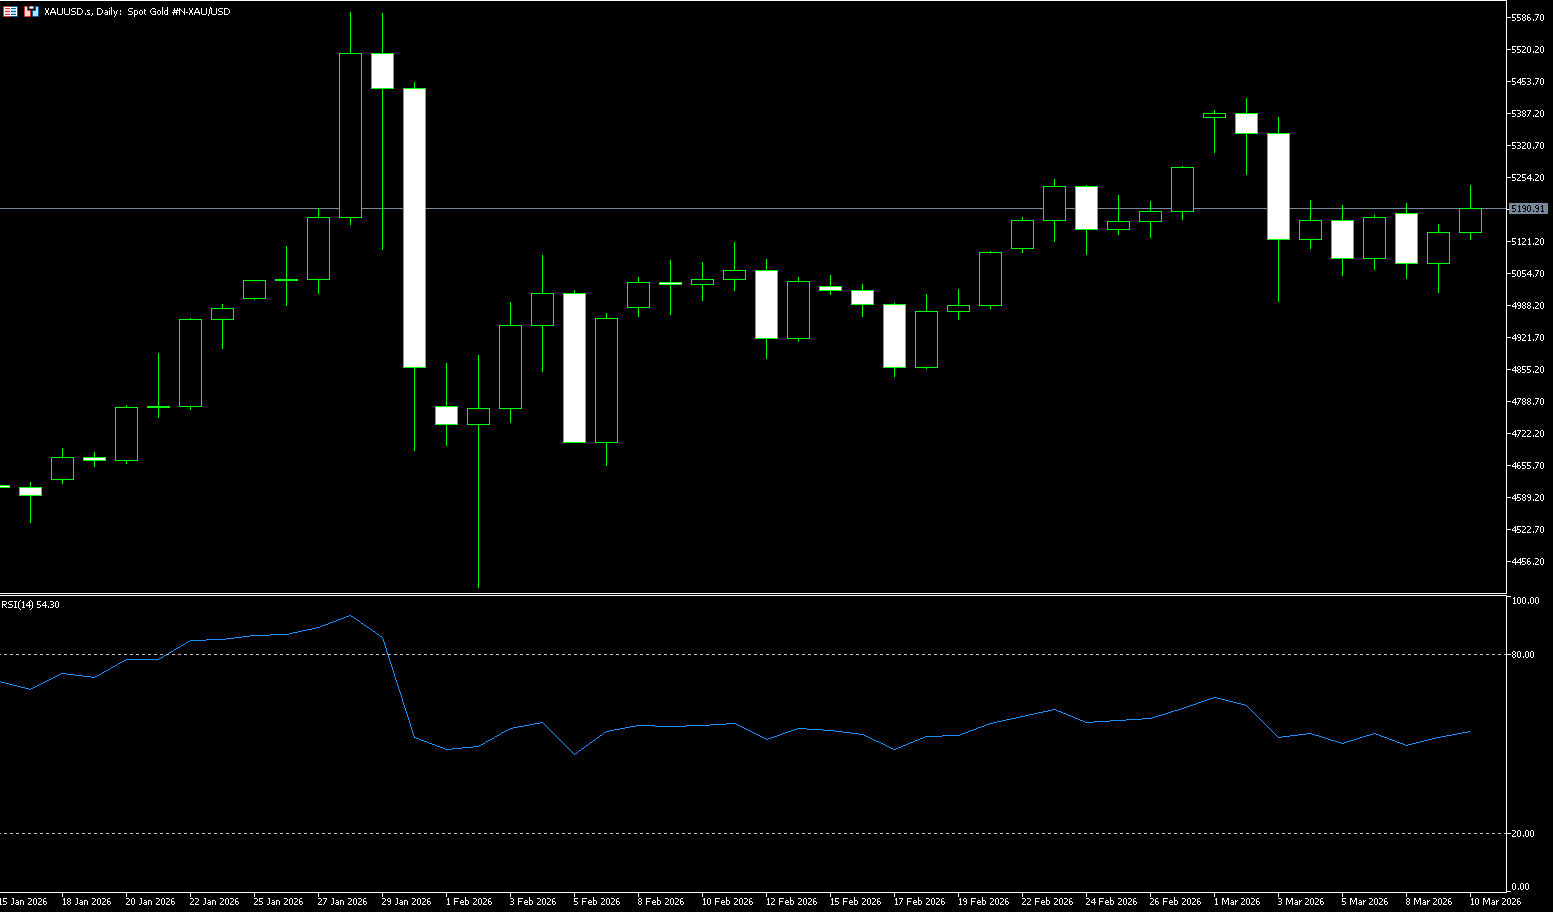
On Tuesday (March 10th, Beijing time), spot gold traded around $5,180 per ounce in early European trading. Gold prices fell on Monday, mainly pressured by a stronger dollar and rising market expectations of interest rate hikes. Although escalating conflict in the Middle East pushed oil prices close to $120 per barrel, exacerbating inflation concerns, investors anticipated that the Federal Reserve might face greater pressure to raise interest rates, weakening gold's appeal as a safe-haven asset. The uncertainty brought about by the war supported safe-haven demand for gold on the one hand, and strengthened expectations of interest rate hikes on the other, leading to downward pressure on gold prices. The market is currently focused on the US February CPI (Wednesday) and PCE price index (Friday), which will be released this week. If inflation data remains high, it may further exacerbate downward pressure on gold prices. On the surface, this seems to contradict the classic logic of "buying gold in times of turmoil." However, a deeper analysis of the current intertwined geopolitical, economic, and monetary policy dynamics reveals that the short-term pullback in gold actually hides a deeper structural logic, and the potential for a medium-term rebound may far exceed market expectations.
In summary, the sharp fluctuations in oil prices and the conflicts in the Middle East will continue to influence the price trend of gold. In the short term, gold may consolidate around $5,000. For investors, the current gold market is at a critical juncture of bullish and bearish struggles, requiring close attention to changes in oil prices and the evolution of the global economic and political situation. From a technical perspective, gold is currently trading between key support and resistance levels. The current support level is in the $5,000–$5,050 range, a price level that has been tested multiple times recently, attracting buying interest each time. As long as gold prices can stabilize above $5,000, market sentiment remains bullish. However, if gold prices effectively break below this support level, a short-term downtrend may occur, leading to further pullbacks. Regarding the resistance levels above, the key resistance zone for gold is between $5,250 and $5,200. Gold prices have tested this range multiple times recently but have failed to break through. If gold prices fall instead of rising, the first support level is at the $5,100 mark; then at the $5,058 level (35-day moving average).
Consider going long on gold today around $5,188; stop loss: $5.183; target: $5,230; $5,240
AUD/USD
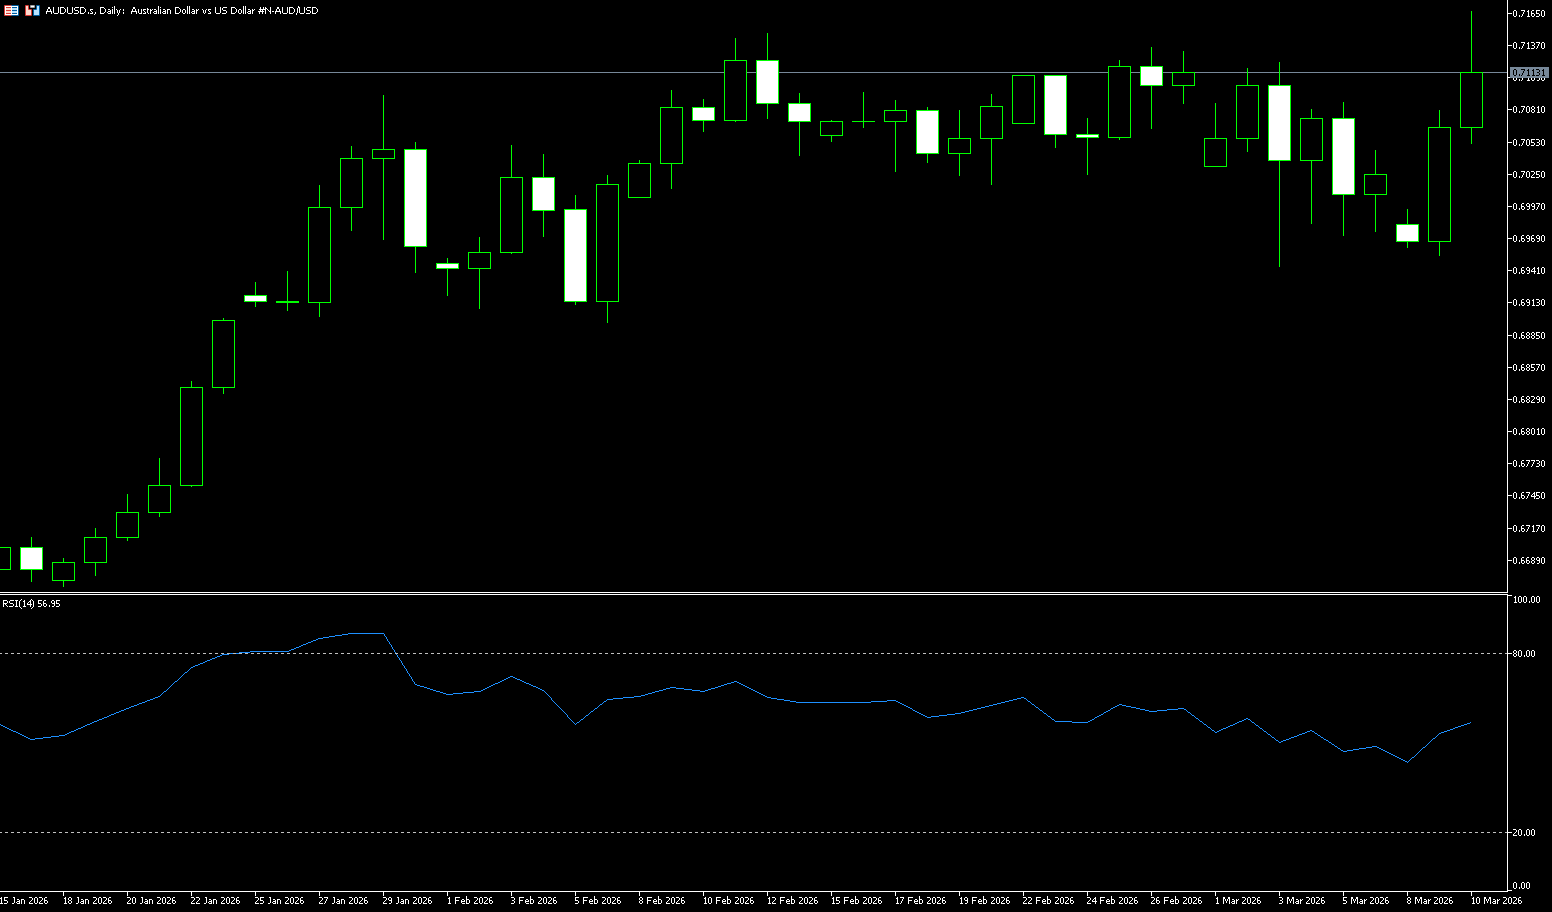
The AUD/USD pair edged lower after two consecutive days of gains, trading near 0.710 in Asian trading on Tuesday. The pair was flat as the Australian dollar was little changed after the release of Chinese trade balance data, which showed a trade surplus of $213.62 billion in February, exceeding market expectations of $179.6 billion and the previous $114.1 billion. Domestically, the Westpac-University of Melbourne Consumer Sentiment Index rose 1.2% month-on-month in March. The AUD/USD index reached 91.6, its first increase since November last year, while the NAB Business Confidence Index fell from 4 to -1, marking its first negative reading since April 2025. Meanwhile, the Reserve Bank of Australia will announce its policy decision next week, and money market traders now expect two rate hikes by August and a high probability of three by the end of the year, implying a peak of 4.5%.
On the daily chart, AUD/USD is trading at 0.7100. The pair maintains a strong bullish bias as prices are well above the rising 50-day and 200-day exponential moving averages, and despite recent consolidation below 0.7100, an established uptrend remains intact. The recent pullback from the highs has not damaged the overall structure, with the stochastic oscillator retreating from overbought territory to the middle zone, suggesting weakening upward momentum rather than a clear reversal. This combination suggests a pause in the market's sustained rally, with pullbacks more likely to attract buying interest, while the overall trend structure remains intact. Initial support is around 0.7040, coinciding with recent lows and short-term resistance. If sellers continue their correction, the next support level is at 0.7000. A break below this area would expose a downside target closer to 0.6956 (Monday's low), where buying interest previously reappeared. On the upside, immediate resistance is at the recent high of 0.7147 (February 12 high), with the recent high of 0.7200 (psychological level) holding. A clear break above this range would signal a continuation of the trend to higher highs.
Consider going long on the Australian dollar today around 0.7110; Stop loss: 0.7100; Target: 0.7150; 0.7160
GBP/USD
GBP/USD attempted to capitalize on the previous day's gains during Tuesday's Asian session but retreated slightly. However, spot prices remained above 1.3420 as investors awaited further developments regarding the US-Iran war before making new directional bets. The dollar attracted renewed buying after pulling back from a three-month high the previous day, becoming a key factor putting downward pressure on the GBP/USD pair. Iran's Islamic Revolutionary Guard Corps (IRGC) refuted US President Donald Trump's comments that the war was nearing its end, stating that Tehran, not Washington, would decide when it would end. This kept geopolitical risks alive and restored demand for traditional safe-haven assets, including the dollar. Meanwhile, investors appeared concerned that continued rises in energy prices could reignite inflation and delay a Fed rate cut. This further supported higher US Treasury yields, further benefiting the dollar and limiting gains for the GBP/USD pair.
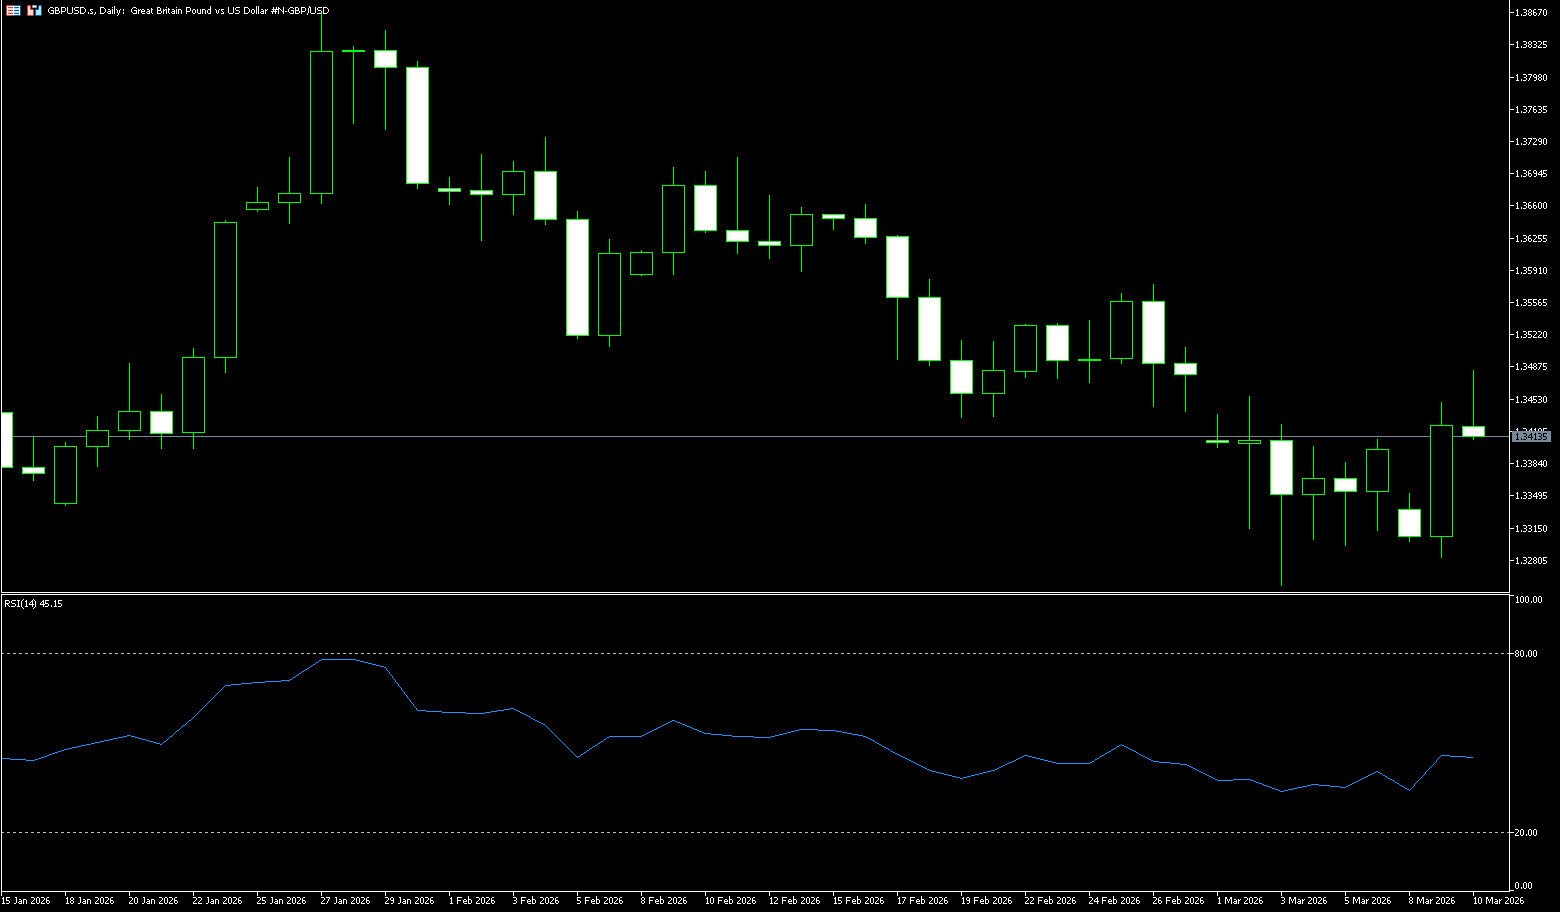
On the daily chart, GBP/USD is trading at 1.3420. The short-term bias is slightly bearish, as spot prices remain below the declining 50-day simple moving average (SMA) at 1.3524, while still above the flatter 200-day SMA at 1.3443, suggesting a correction phase within a broader context. The price action has formed a series of lower highs from the 1.38 area, and the recent failure to reclaim the 1.35 level underscores persistent selling interest on rallies. The stochastic oscillator has recovered from oversold territory but remains in the lower half of its range, indicating only mild upward momentum and suggesting that rallies are more likely to face supply pressure than trigger a sustained trend reversal. Initial resistance is seen at the 1.3500 level (psychological level), with the 1.3524 level (50-day SMA) forming key resistance; on the downside, the 1.3400 level is immediate support, guarding the recent low of 1.3360, where the pair previously attracted buying interest.
Consider going long on GBP/USD around 1.3410 today; Stop loss: 1.3400, Target: 1.3450; 1.3460
USD/JPY
The yen appreciated to around 157.80 per dollar on Tuesday, after approaching 159 in the previous session, as falling energy prices eased economic pressure on the country as an oil importer. The yen also rose as the dollar weakened, with market hopes for a swift end to the war with Iran reducing safe-haven demand for the dollar. Trump stated that the US military action in Iran was nearing its end, progressing far beyond the initial four-to-five-week timeframe. He also hinted at plans to lift oil-related sanctions and have the US Navy escort oil tankers through the Strait of Hormuz to help control oil prices. In Japan, fourth-quarter GDP growth was revised upward to 0.3% from the initial 0.1%, thanks to strong domestic demand. Earlier data also showed that real wages rose for the first time in 13 months, further supporting the Bank of Japan's case for continuing to normalize monetary policy and providing the government with flexibility to pursue its key policy objectives.
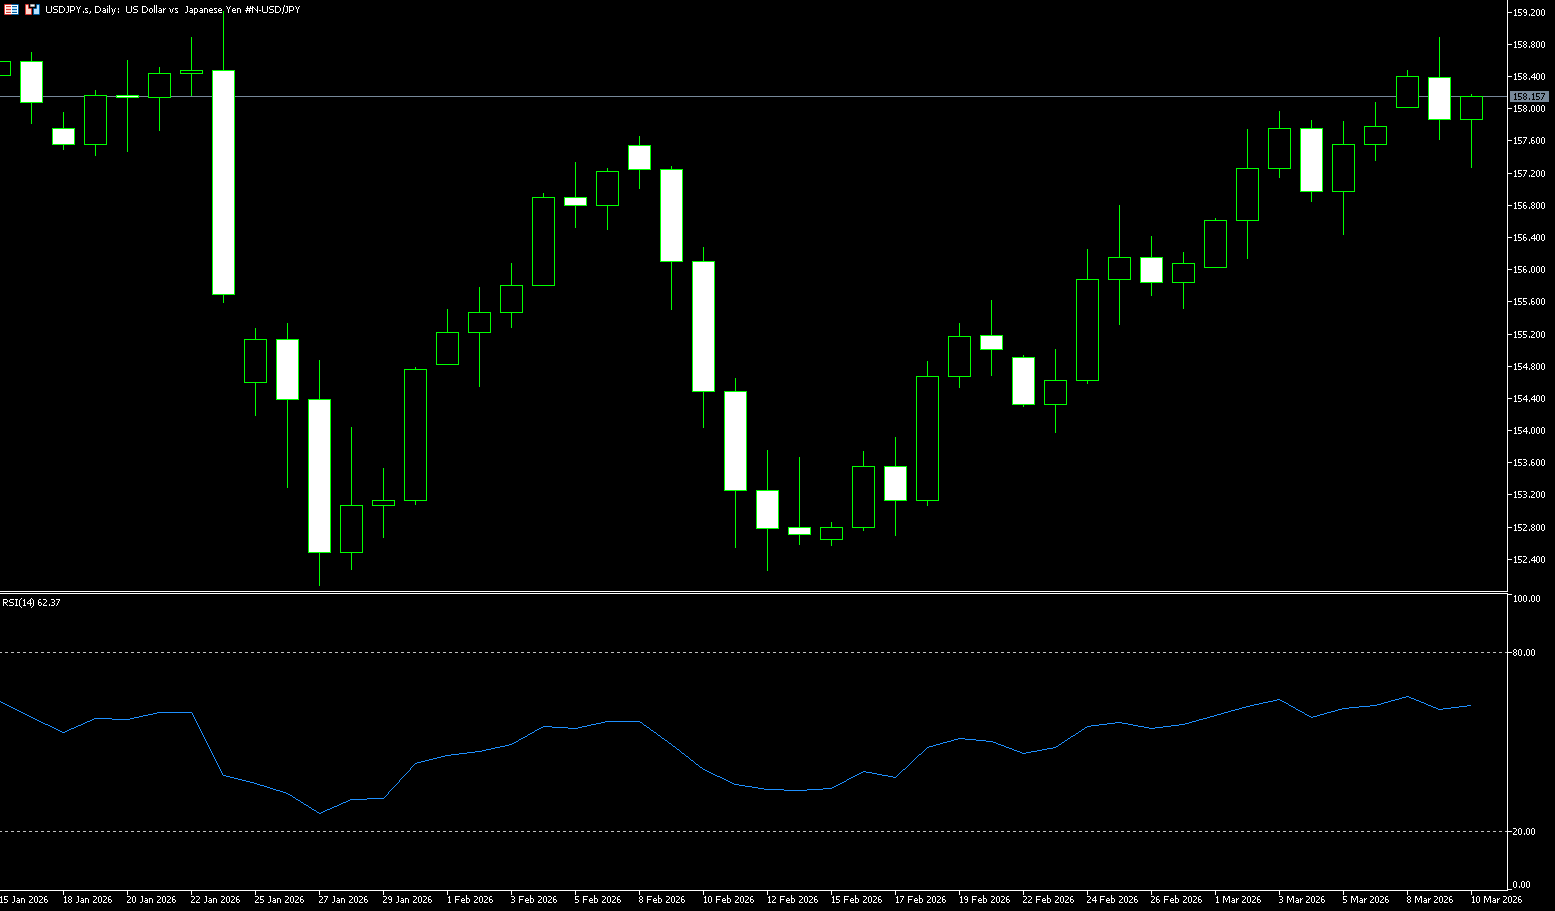
The USD/JPY pair maintained a slightly bullish short-term bias after breaking above the one-week trading range resistance at 158.50 early in the week. Furthermore, the MACD histogram has slightly turned positive, while the MACD line is near the signal line above zero, suggesting improved but still moderate upward momentum. Additionally, the Relative Strength Index (RSI) is around 61.48, still below overbought territory, indicating that buyers remain in control and have not yet shown signs of fatigue. Immediate support is seen at the breakout point of the trading range resistance at 157.27 (the 9-day moving average), with deeper support at the psychological level of 157.00, protecting the recent highs and lows. A break below 157.00 would weaken the bullish bias and make the 155.65 (20-day moving average) area the next downside focus. On the upside, initial resistance is seen at 158.90, the latest swing high, followed by the 159.45 (January 14th) level.
Today, consider shorting the US dollar near 158.20; Stop loss: 158.40; Target: 157.30; 157.40
EUR/USD
The euro/dollar pair lost ground near 1.1610 in early Asian trading on Tuesday. The dollar edged higher against the euro amid concerns that the ongoing Middle East conflict could disrupt global energy supplies and impact economic growth. Iran's Islamic Revolutionary Guard Corps stated that the end of the war would be decided by Tehran, not the US, which warned it might block regional oil exports if US and Israeli attacks continued. Meanwhile, US President Donald Trump said Monday evening that he planned to lift oil-related sanctions, allow US Navy escorts of oil tankers through the Strait of Hormuz, and predicted the war with Iran would be resolved "soon." Uncertainty and the lack of signs of a resolution between the US and Iran continue to push safe-haven currencies like the dollar, putting pressure on this major currency pair. As Europe is a major net energy importer, higher crude oil prices could push up inflation in the region while suppressing economic growth and increasing the risk of stagflation. The market currently expects the European Central Bank to implement up to two 25-basis-point rate hikes this year.
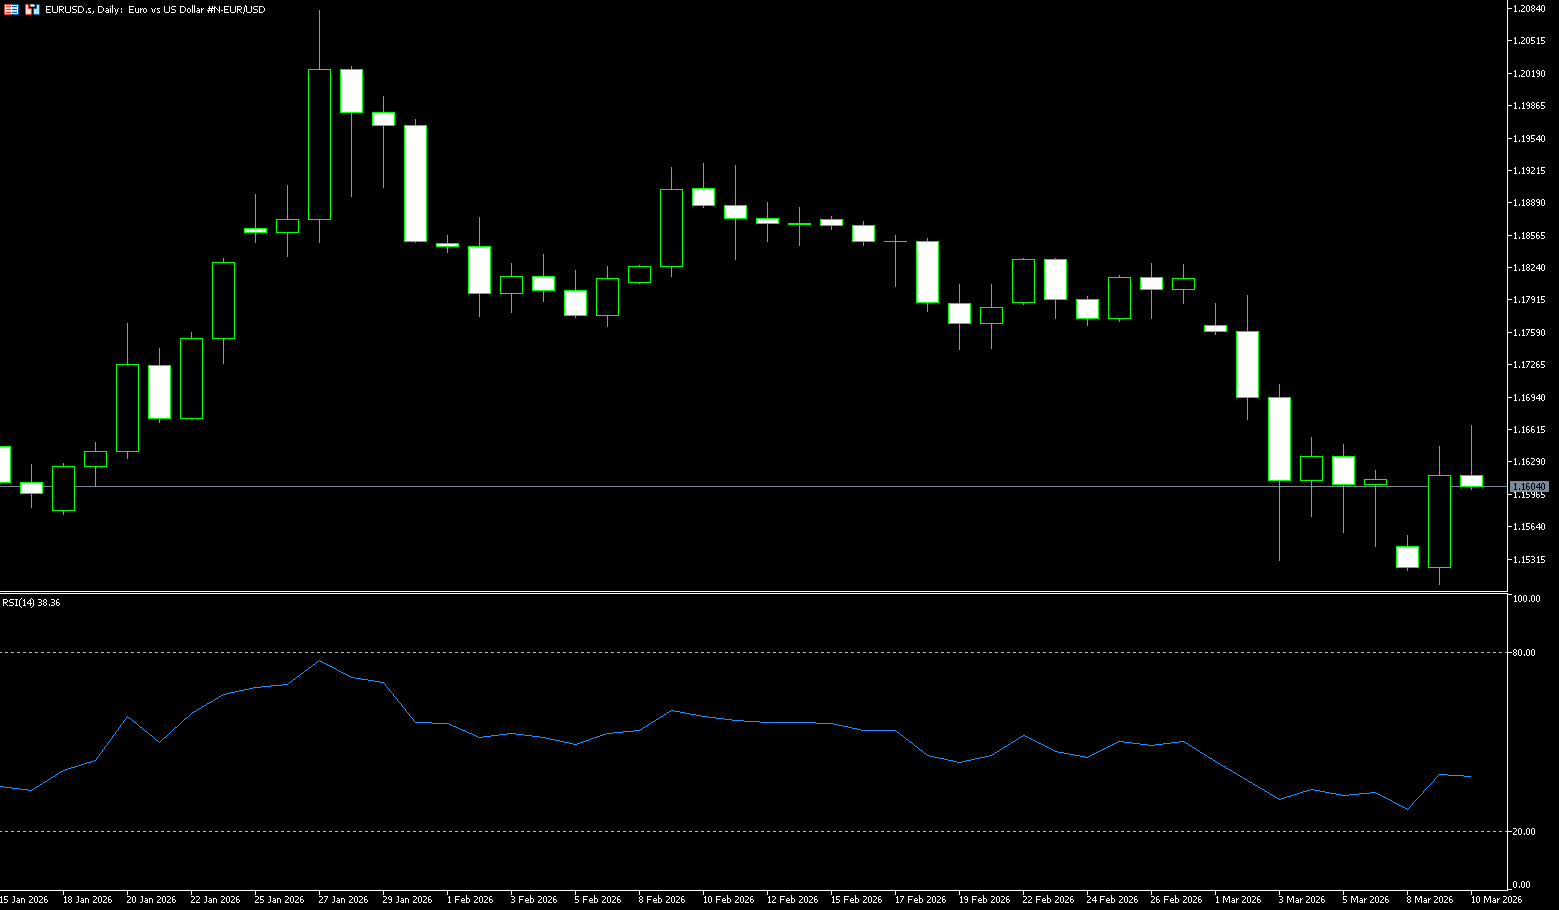
On the 4-hour chart, EUR/USD remains bearish, with the spot price holding below the 50, 100, and 200-period simple moving averages, all of which are trending downwards. Meanwhile, momentum indicators are below their midline and weakened again after a brief period of stability, reinforcing selling pressure rather than signaling a bottom. Furthermore, the 14-day Relative Strength Index (RSI) is hovering around 37, still below the 50 midline, suggesting that any rebound is still a correction within a broader downtrend. Immediate resistance is seen at 1.1675 (200-day simple moving average), a break above which would open up space towards the 1.1700 (psychological level) and 1.1753 (20-day simple moving average) area. On the downside, initial support is at 1.1520, protecting the long-term statistical support area around 1.1470. As long as the price trades below 1.1600, the path of least resistance remains downward, and sellers will maintain the upper hand on rallies to resistance levels.
Consider going long on the Euro today around 1.1600; Stop loss: 1.1590; Target: 1.1650, 1.1660
Disclaimer: The information contained herein (1) is proprietary to BCR and/or its content providers; (2) may not be copied or distributed; (3) is not warranted to be accurate, complete or timely; and, (4) does not constitute advice or a recommendation by BCR or its content providers in respect of the investment in financial instruments. Neither BCR or its content providers are responsible for any damages or losses arising from any use of this information. Past performance is no guarantee of future results.
More Coverage


Risk Disclosure:Derivatives are traded over-the-counter on margin, which means they carry a high level of risk and there is a possibility you could lose all of your investment. These products are not suitable for all investors. Please ensure you fully understand the risks and carefully consider your financial situation and trading experience before trading. Seek independent financial advice if necessary before opening an account with BCR.
BCR Co Pty Ltd (Company No. 1975046) is a company incorporated under the laws of the British Virgin Islands, with its registered office at Trident Chambers, Wickham’s Cay 1, Road Town, Tortola, British Virgin Islands, and is licensed and regulated by the British Virgin Islands Financial Services Commission under License No. SIBA/L/19/1122.
Open Bridge Limited (Company No. 16701394) is a company incorporated under the Companies Act 2006 and registered in England and Wales, with its registered address at Kemp House, 160 City Road, London, City Road, London, England, EC1V 2NX. This entity acts solely as a payment processor and does not provide any trading or investment services.

 English
 简体中文
简体中文
 繁體中文
繁體中文
 Bahasa
Melayu
Bahasa
Melayu
 Tiếng
Việt
Tiếng
Việt
 ไทย
ไทย
 日本語
日本語
 한국어
한국어
 ភាសាខ្មែរ
 español