null
US Dollar Index
The Federal Reserve announced on Wednesday, September 20th, that it would keep the benchmark interest rates unchanged, while suggesting that borrowing costs might remain at higher levels for a longer period after another rate hike later this year. The US Dollar Index saw a short-term increase of 60 points, briefly rising to 105.44. Ahead of the Fed's September rate decision, due to increased risk aversion and rising US bond yields, the US Dollar Index demonstrated a low and rebound pattern, maintaining its volatility near the recent high of 105. Bond yields across different maturities continued to rise, with the 5-year US Treasury yield reaching multi-year highs. These developments reflected the market's cautious stance regarding the Fed's September rate decision, prompting a rebound in the US Dollar Index, which climbed back above 105.00.
Furthermore, earlier data indicated that the total number of building permits issued in the US reached 1.543 million in August, hitting a nearly five-month high, which also supported the US Dollar. Until the dust settles on the Federal Reserve's September rate decision, it is expected that the volatility of the US Dollar Index will be limited, with both bulls and bears exercising caution. Market participants believe that assessing the impact of this significant event on the market goes beyond surface-level analysis and hinges on the degree of expectations being met. Since the market may have already priced in the expectation of the Federal Reserve maintaining a hawkish stance, there is a risk of the US Dollar running out of positive momentum. However, if the Fed surprises with a more hawkish stance, the US Dollar Index may continue to hit recent highs.
The daily chart shows that the US Dollar Index has remained above 105.00 for the past week. Currently, the KDJ indicator has crossed bearishly in the overbought zone, suggesting the presence of correction pressure. If the US Dollar falls back below 105.00 this week, there is a possibility of a significant retracement. Key support levels below are at 104.45 (Power Law Centerline) and 104.50 (an upward trendline extending from the July low of 99.57). If these levels are breached, the market may have reached a temporary peak, potentially leading to further declines towards 104.04 (23.6% Fibonacci retracement level from 99.57 to 105.43) or even lower levels. However, if the US Dollar breaks above 105.43 (last Friday's high) and 105.77 (Power Law Upper Line), the more significant resistance at 105.88 (March 8th high) will be challenged. Once this level is breached, more upside potential may open up.
Today, it may be considered to go long on the US Dollar Index near 105.20, with a stop loss at 105.00 and targets at 105.60 and 105.65.

WTI Crude Oil
Despite a decrease in US inventories failing to provide support, and the Federal Reserve maintaining interest rates but hinting at a possible rate hike later this year, crude oil futures continued to decline for the second consecutive day from their highs earlier this year. At the beginning of the week, the yield on the 10-year US Treasury bond climbed further to 4.371%, reaching a 16-year high not seen since 2007. WTI crude oil briefly rose to a ten-month high of $92.23 per barrel during the trading session but then lost momentum and retreated to consolidate near $90.00 per barrel, giving back all of its intraday gains. As the Federal Reserve's September rate decision approaches, concerns about rising oil prices persist in the market, with various investment institutions issuing warnings. The continued rise in oil prices may increase inflation pressure by year-end, drive bond yields higher, potentially worsening the global growth/inflation mix, and dampening market risk appetite. Furthermore, with Saudi Arabia and Russia extending additional production cuts, oil prices could rise above $100 per barrel, potentially signaling a near-stagnation of the global economy in Q4 2023. On the other hand, due to the rise in the yield of the 10-year US Treasury bond, considered the "anchor" of global asset pricing, short-term adjustments in oil prices are expected.
The daily chart shows that WTI crude oil is currently consolidating above the $90 per barrel level, facing short-term resistance at $92.23 (Tuesday's high) and $93.0, with the possibility of further upward movement to $96.0 or even $100. However, the presence of a long upper shadow on the overnight closing suggests an increased possibility of short-term profit-taking by the bulls. Looking ahead, it is expected that WTI crude oil may experience a short-term corrective pullback, with potential support levels below at $90.0 (a psychological level) and $88.51 (10-day moving average) per barrel. In terms of the medium-term trend, if WTI crude oil can effectively stabilize above $85.50 per barrel in the future, there remains the possibility of further upward movement towards the $100 level.
Today, it may be considered to go short on crude oil near $89.40, with a stop loss at $89.80 and targets at $88.30 and $88.10.

XAUUSD
Spot Gold Investors are awaiting decisions on monetary policies from the Bank of Japan and the Bank of England.
Meanwhile, after the Federal Reserve kept the benchmark federal funds rate unchanged as expected, gold prices fell yesterday. After a rebound in the past few trading days, spot gold lost some momentum and is currently trading around $1,930 in the short term. Traders are now patiently waiting for the results of the Federal Reserve's interest rate meeting scheduled for Wednesday evening. For gold, the Federal Reserve's monetary policy meeting today is undoubtedly crucial, and the market widely predicts that the Federal Reserve will temporarily halt rate hikes this week. If the Federal Reserve chooses to raise rates further to control inflation, this could affect the attractiveness of gold. There is room for further decline in gold prices this year as the demand for gold as a hedge against economic uncertainty and a high inflation environment has actually decreased. The holdings of the world's largest gold-backed exchange-traded fund, SPDR Gold Trust, approached an eight-month low last week. Therefore, in the short term, the outlook for gold remains uncertain, swinging between bullish and bearish sentiment. The market is eagerly awaiting clues from central banks regarding monetary policy adjustments, especially the decision to be made by the Federal Reserve on Wednesday.
The daily chart shows that the gold price is currently hovering near the 50% Fibonacci retracement level of $1,936.20 (from $1,987.50 to $1,884.90) and just below the $1,936.00 level (downward resistance trendline extending from the July high of $1,987.50). The intraweek high for gold this week was $1,937.30 per ounce, marking a two-week high, but it is currently in a downward state. Gold's technical outlook is neutral as it continues to trade below the bearish 100-day moving average of $1,944, which converges with the Fibonacci retracement level of $1,943.50 (from $1,804.80 to $2,081.90). At the same time, the 20-day (at $1,924.90) and 200-day (at $1,924.80) moving averages are declining below the current gold price level. If gold falls below $1,924, the downside risk may increase towards $1,921 (9-day moving average), and further attention can be paid to the level of $1,909.10 (23.6% Fibonacci retracement level from $1,987.50 to $1,884.90).
Today, it may be considered to short gold before $1,934, with a stop loss at $1,938 and a target of $1,922 and $1,918.

AUDUSD
The Reserve Bank of Australia's meeting minutes for September, released midweek, revealed that the central bank had considered a 25-basis-point interest rate hike but ultimately decided to keep the overnight cash rate unchanged at 4.1%. The committee noted signs supporting a rate hike, such as weak productivity growth and elevated services price inflation. However, the risk lies in the impact of the tightening cycle that only began in May last year and has yet to fully materialize, ultimately offsetting the effects of these factors. The committee also pointed out that if inflation persists longer than expected, further monetary policy tightening may still be necessary.
AUD/USD continued its upward trend earlier this week, reaching 0.6473, forming a small double top pattern with the high from last Friday at 0.6473. A break above 0.6473, 0.6480 (September 4th high), and 0.6884 (23.6% Fibonacci retracement level from 0.6895 to 0.6357) resistance areas could pave the way for a rapid move towards the 0.6600 level. In the short term, a rebound towards around 0.6626 (50% Fibonacci retracement level from 0.6895 to 0.6357) and 0.6620 (30-week moving average) is possible. On the other hand, if market momentum turns in favor of the bears, AUD/USD may shift downwards. In such a scenario, initial support would be at 0.6357 (previous low). Although AUD/USD may consolidate near this level during a pullback, a significant decline could open the path towards the 0.6275 level. If this occurs, it would signify the failure of the double top pattern.
Today, it may be considered to go long on the Australian Dollar near 0.6420, with a stop loss at 0.6400 and targets at 0.6480 and 0.6490.

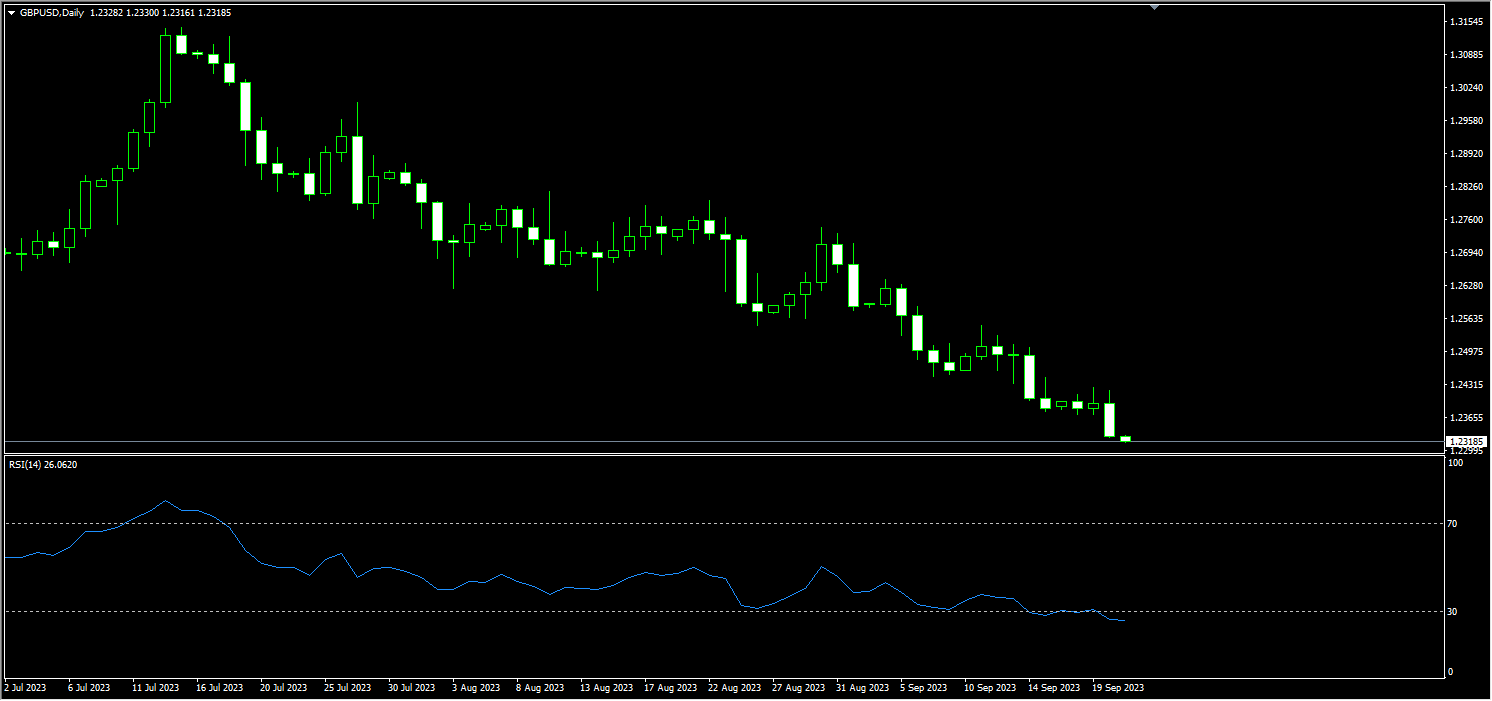
GBPUSD
The Bank of England is scheduled to hold its meeting on Thursday, and the market is currently awaiting the outcome. UK inflation has dropped from a 41-year high of 11.1% in October last year to 6.8%, but it remains the highest among major economies, and progress in reducing inflation has been much slower. A Reuters survey of economists last week showed that a minority of economists believe there is still at least one rate hike space for the Bank of England after September this year. However, expectations for the Bank of England to continue raising rates this year have diminished in the past few weeks, largely due to concerns about stagnation in the UK's economic growth. As a result, speculative investors have trimmed some of their long positions in the Pound, though not significantly. On Wednesday evening, the Federal Reserve held its interest rate meeting ahead of the Bank of England. If the Federal Reserve stays put and reveals a dovish stance in its forward rate guidance, there is a risk of oversold rebound in GBP/USD.
Due to the continued strength of the US Dollar, the GBP/USD exchange rate has fallen to around a four-month low of 1.2330. The Pound remains weak ahead of major events such as UK inflation data, the Federal Open Market Committee's decision on Wednesday, and the Bank of England's decision on Thursday. GBP/USD made a small rebound for two consecutive trading days earlier this week but failed to reach the 1.2400 (upper channel line) and 1.2402 (220-day moving average) resistance areas before declining again yesterday. Meanwhile, the relative strength index (RSI) remains below 40, reflecting insufficient buyer interest. On the downside, the first support level is at 1.2308 (May 25th low). A close below this level could open the door to further decline below 1.2300 to 1.2236 (260-day moving average). If the currency pair rises above 1.2400 and 1.2402 and holds steady there, sellers may shift to a wait-and-see approach. In this case, further upside to 1.2472 (14-day moving average) and 1.2539 (Bollinger Bands centerline) may be observed.
Today, it is recommended to go short on the British Pound near 1.2360, with a stop loss at 1.2385 and targets at 1.2280 and 1.2750.
USDJPY
Despite the speculation triggered by the remarks of Bank of Japan Governor Kuroda that the central bank might abandon its ultra-loose monetary policy, the market expects the Bank of Japan to maintain ultra-low interest rates on Friday and assure the market that monetary stimulus policy will not change at least for now. In addition, the Federal Reserve's interest rate meeting is also approaching this week. If the Federal Reserve continues to maintain a hawkish stance on future interest rate prospects, it is likely to stimulate the USD/JPY to continue its attempt to move higher. However, on Tuesday, Japan's Vice Finance Minister, Manabu Kanda, stated that excessive volatility in the Yen is undesirable. Japan will maintain close communication with the U.S. Treasury and take appropriate measures in the foreign exchange market when necessary, without ruling out any options. Signs of possible intervention by the Japanese government are beginning to emerge. Therefore, caution should be exercised to guard against the risk of a turnaround brought about by government interventions in the market.
USD/JPY experienced a rapid decline early last week but found support near the 145.90 low. This led to a swift rebound in the currency pair in the subsequent trading sessions, steadily rising in recent days, and yesterday it reached a recent high of 148.36, seemingly challenging the key resistance near the 148.00 psychological level once again. Since the beginning of this month, USD/JPY has been struggling to break through the 148.00 level. Every effort made by the bulls to break through this upper limit has been met with resistance by the bears, indicating significant pressure in this area. Given this, a similar outcome may occur during the retesting process, but there could be a rebound to 148.80 after the breakthrough, with further potential to rise towards 150.00. If the bears regain control of the market and trigger a meaningful pullback, initial support will be at 145.90 and 146.03 (34-day moving average). If USD/JPY weakens further, attention will shift to 144.44 (this month's low). However, it is worth noting that considering the U.S. Treasury yields at multi-year highs, the bearish trend will face significant resistance.
Today, it is advisable to go long on the U.S. Dollar near 148.00, with a stop loss at 147.70 and targets at 148.80 and 148.90.

EURUSD
Reports on Tuesday suggested that the European Central Bank (ECB) may soon begin discussing how to withdraw some excess liquidity from the banking system, which briefly put slight pressure on the EUR/USD pair. However, the impact on the US dollar is likely to be minimal when the prevailing narrative of the US exception and the more credible message from the Federal Reserve of 'keeping rates higher for longer' comes into play. According to the CME Group's FedWatch tool, traders expect the Federal Reserve to stand pat at the upcoming meeting, but the focus will be on the Fed's forward guidance. The market perceives that the Federal Reserve may sound less dovish, but it may require more supportive evidence to push the currently elevated US dollar further upward. The Federal Reserve will hold its rate-setting meeting on Wednesday evening, and ahead of that, the EUR/USD is expected to cautiously maintain narrow-range fluctuations. If the Federal Reserve's forward guidance does indeed lean dovish, precautions should be taken against the risk of the euro rebounding.
The EUR/USD has seen mostly directionless fluctuations for most of this week. Last week, the EUR/USD experienced a significant decline but eventually found support near the 38.2% Fibonacci retracement level from the 2022 low of 0.9535 to the 2023 high of 1.1275, which is located near 1.0610. While 1.0610 may continue to act as strong support in the short term to prevent further declines in the EUR/USD, breaking below this level could intensify downward pressure, potentially paving the way for the exchange rate to drop further towards the key psychological level of 1.0500 and further towards 1.0405 (50% Fibonacci retracement level from 0.9535 to 1.1275). If the EUR/USD reverses to the upside, initial resistance is observed at 1.0790 (the descending trendline formed since July), and a decisive breakthrough above this level could ignite buying interest in the market, potentially paving the way for a further rise towards the 200-day moving average at 1.0828. In that case, the market's focus would shift to 1.0882 (this month's high).
Today, it is advisable to short the euro near 1.0685, with a stop loss at 1.0710 and targets at 1.0625 and 1.0615.

More Coverage


Risk Disclosure:Derivatives are traded over-the-counter on margin, which means they carry a high level of risk and there is a possibility you could lose all of your investment. These products are not suitable for all investors. Please ensure you fully understand the risks and carefully consider your financial situation and trading experience before trading. Seek independent financial advice if necessary before opening an account with BCR.
BCR Co Pty Ltd (Company No. 1975046) is a company incorporated under the laws of the British Virgin Islands, with its registered office at Trident Chambers, Wickham’s Cay 1, Road Town, Tortola, British Virgin Islands, and is licensed and regulated by the British Virgin Islands Financial Services Commission under License No. SIBA/L/19/1122.
Open Bridge Limited (Company No. 16701394) is a company incorporated under the Companies Act 2006 and registered in England and Wales, with its registered address at Kemp House, 160 City Road, London, City Road, London, England, EC1V 2NX. This entity acts solely as a payment processor and does not provide any trading or investment services.

 English
 简体中文
简体中文
 繁體中文
繁體中文
 Bahasa
Melayu
Bahasa
Melayu
 Tiếng
Việt
Tiếng
Việt
 ไทย
ไทย
 日本語
日本語
 한국어
한국어
 ភាសាខ្មែរ
 español