0
Currency and Commodity Analysis:
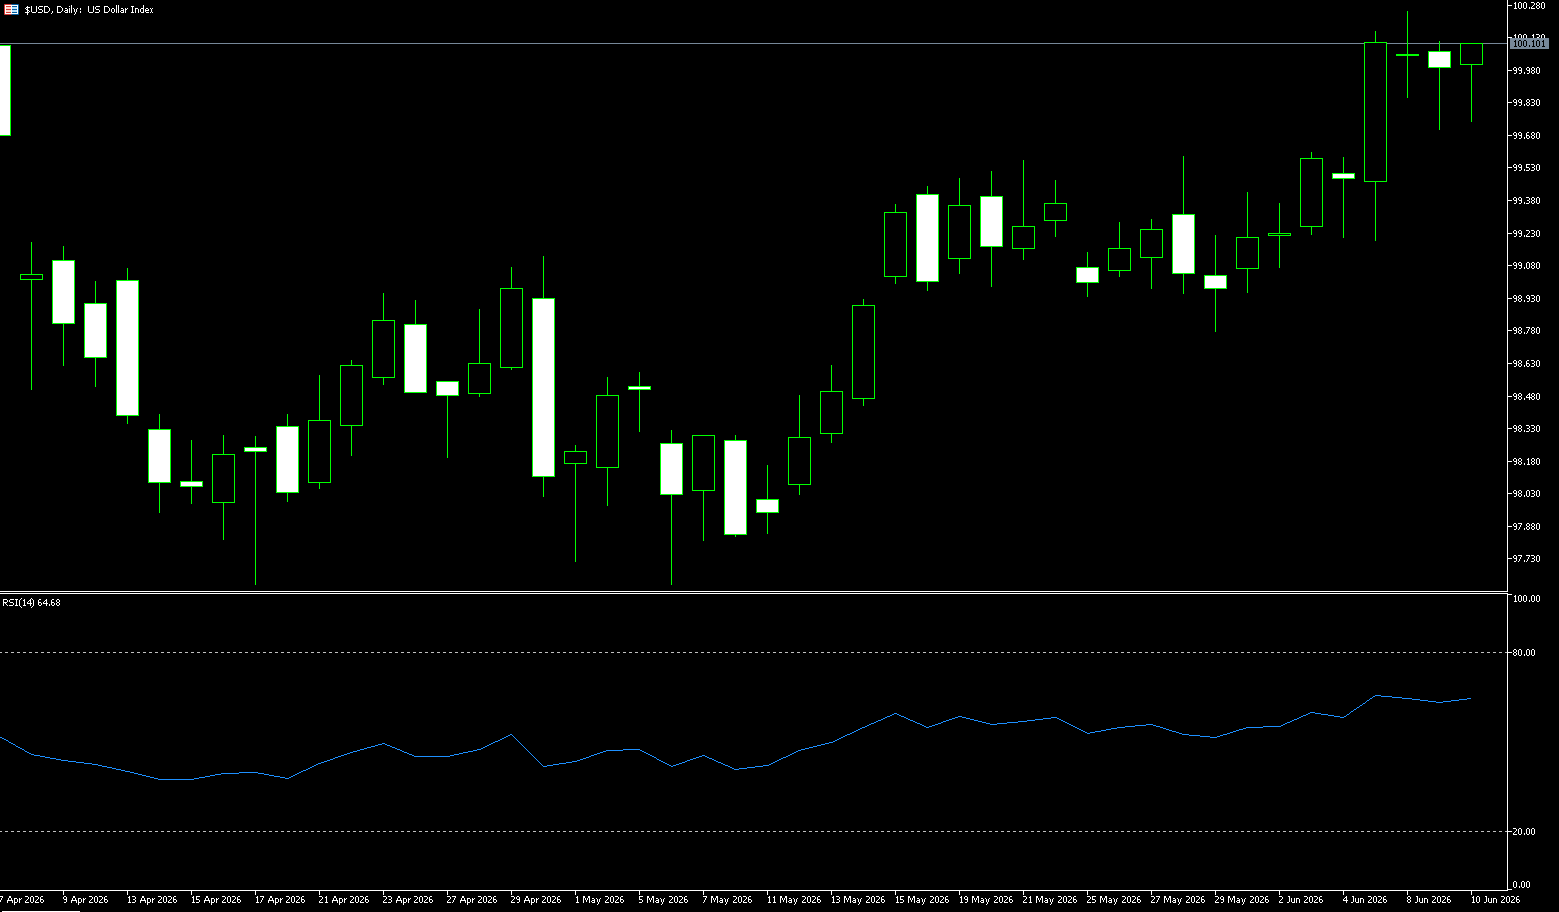
US Dollar Index
The US dollar index hovered around 100 on Wednesday, after a sharp intraday rebound in the previous session, as renewed hostilities in the Middle East clouded the prospects for a fragile ceasefire and a long-term peace agreement. The US launched a "self-defense strike" against Iran in response to the downing of a US helicopter, while Iranian Foreign Minister Abbas Araqchi warned that the Iranian armed forces would respond to any attack or threat. Markets expressed concerns about inflation and the possibility of central bank interest rate hikes as regional conflict drove up energy prices. Investors are also awaiting the latest US inflation data for new signals on the Federal Reserve's policy outlook, after stronger-than-expected jobs data last week strengthened expectations of a rate hike this year. Furthermore, the market widely expects the European Central Bank and the Bank of Japan to raise interest rates later this month.
The US dollar index is currently in a strong upward channel on the daily chart, having rebounded steadily from its May low of 97.62, recently rising to near the 100 mark and approaching the previous high of 100.64, indicating a clear bullish trend. The moving average system is in a bullish alignment, with the price above the 20-day, 50-day, 100-day, and 200-day moving averages. Support levels are at 99.59 (the 9-day moving average) and 99.00 (a psychological level), indicating solid support. Key resistance levels are at 100.21 (this week's high) and 100.64 (the high of March 31st). A break above these levels could open up further upside potential to the 101 level. In terms of indicators, the MACD DIFF line is above the DEA line, and the red bars are continuing to expand, indicating strengthening bullish momentum. The RSI is at 62.89, in the bullish zone but not yet overbought, suggesting further upside potential. Overall, the US dollar index shows a clear short-term strength; pullbacks do not change the upward trend. Attention should be paid to whether the previous high resistance level can be broken.
Today, consider shorting the US Dollar Index at 100.15, with a stop-loss at 100.25 and targets of 99.70 and 99.60.
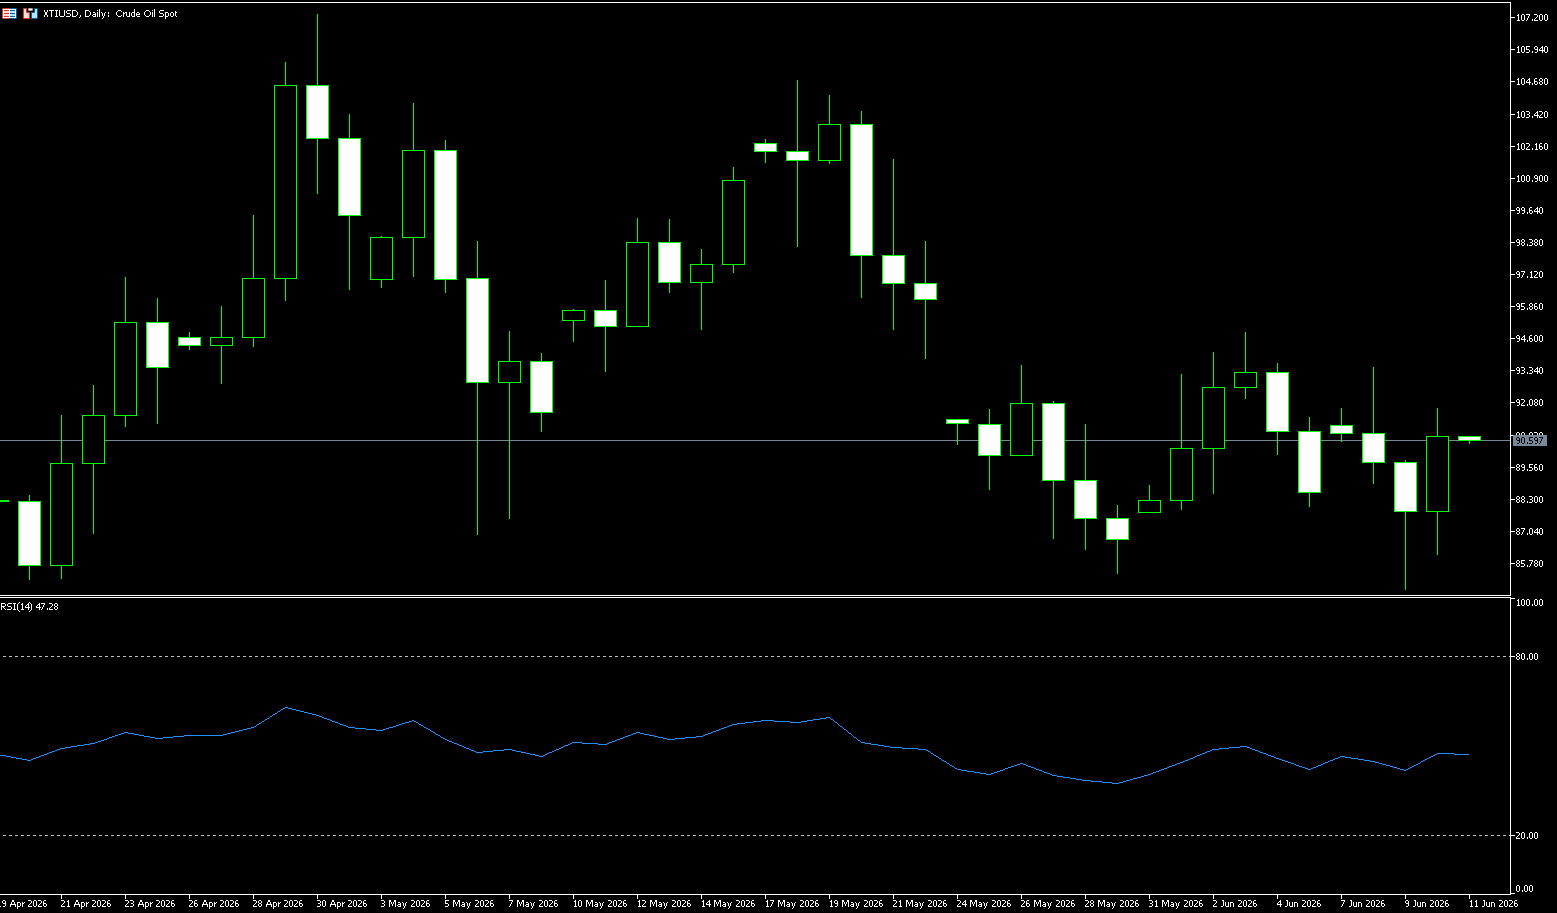
WTI Crude Oil
WTI crude oil prices rose more than 2% on Wednesday, approaching $90.30 a barrel, as traders weighed escalating tensions in the Middle East. President Trump vowed to take another strong stance against Iran, stating that Iran had spent too much time negotiating an agreement and now "must pay the price." This statement came after Iran launched attacks on several Gulf states, including Bahrain, Jordan, and Kuwait, following a "self-defense" strike by the United States that shot down a U.S. helicopter. Traffic in the Strait of Hormuz remains significantly disrupted, with Iran blocking most shipping through this crucial waterway and the United States imposing restrictions on Iranian ports. However, U.S. Energy Secretary Wright stated that despite the ongoing disruptions, shipping traffic in the Gulf region and oil exports through the strait are still increasing.
From a daily chart perspective, WTI crude oil prices are currently at a critical juncture with multiple technical signals converging. Prices recently tested the 20-day moving average (approximately 93.03) and retreated, breaking below the 50% Fibonacci retracement level of the previous upward wave (91.64). After reaching a low near $84.87, a candlestick with a long lower shadow appeared, indicating some buying support at that level, but the rebound was weak and has not yet regained the 50% retracement level. Oil prices are currently consolidating within a converging triangle pattern, facing resistance at the previous high of $90.00 and the 20-day moving average (around $93.03). Support lies at the week's low of $84.87, followed by the psychological level of $80.00. Overall, the price action is characterized by a slightly bearish bias. The MACD indicator has formed a death cross below the zero line, with the histogram showing negative bars. While bearish momentum has weakened, it hasn't fully reversed, and the bearish signal remains. The RSI (14) is currently at 44.91, in the lower-middle neutral range, not yet oversold, and lacks a clear trend signal, further confirming the consolidation pattern.
Today, consider going long on crude oil at 90.10, with a stop loss at 89.90 and targets at 92.00 and 93.00.
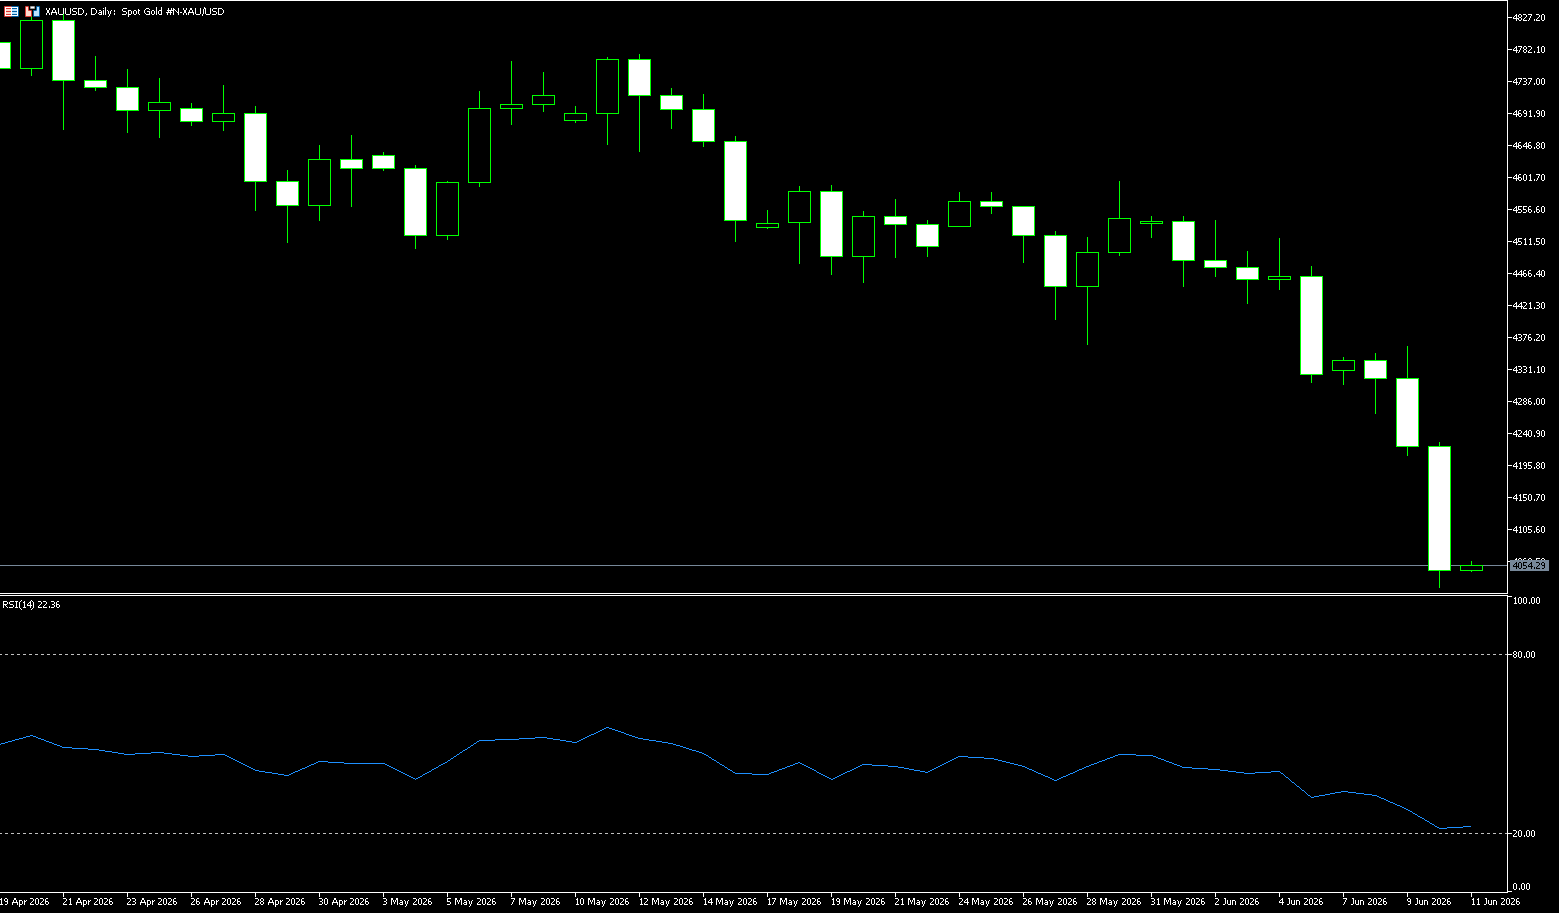
Spot Gold
Gold prices continued to fall on Wednesday, nearing $4,000 an ounce, reaching their lowest level since the end of November 2025, as US inflation data largely met expectations while the conflict with Iran escalated. Overall inflation rose to 4.2% in May, the highest level since April 2023, primarily driven by soaring energy costs related to the conflict with Iran, while core inflation climbed to 2.9%, a seven-month high. Traders slightly lowered their expectations for a Fed rate hike this year, although the possibility of a 25 basis point rate hike in December was still fully priced in after last week's stronger-than-expected US jobs data. Meanwhile, escalating tensions in the Middle East, with the US and Iran launching new attacks on each other, and President Trump stating that Iran would "pay the price for delaying negotiations," undermined the fragile ceasefire and dimmed the prospects for a broader peace agreement.
In summary, the current gold market is in a typical "mixed bullish and bearish" phase. The bulls hold the cards of Middle East geopolitical uncertainty and the potential for valuation recovery should interest rate hike expectations cool down, while the bears are emboldened by strong US economic data and the resulting rise in interest rate hike expectations. Looking at the daily chart, after falling from a high of $4,773.30/oz, spot gold's subsequent rebound high fell to $4,595.00/oz, with the price center continuing to shift downwards. The intraday low of $4,071/oz indicates that the rebound has been briefly broken, and technical trading funds are clearly more sensitive to trend continuation. In terms of MACD, bearish momentum is recovering. More importantly, the price did not touch the lower Bollinger Band during the wide-range fluctuations. For traders, the current focus is not on predicting a single-point rebound, but rather on identifying whether the $4,150-$4,200/oz area can regain buying support. If the pullback fails to return above this area, the market will continue to view the $4,050-$4,000/oz area as key support.
Consider going long on gold today at $4,065, with a stop-loss at $4,060 and targets at $4,120 and $4,140.
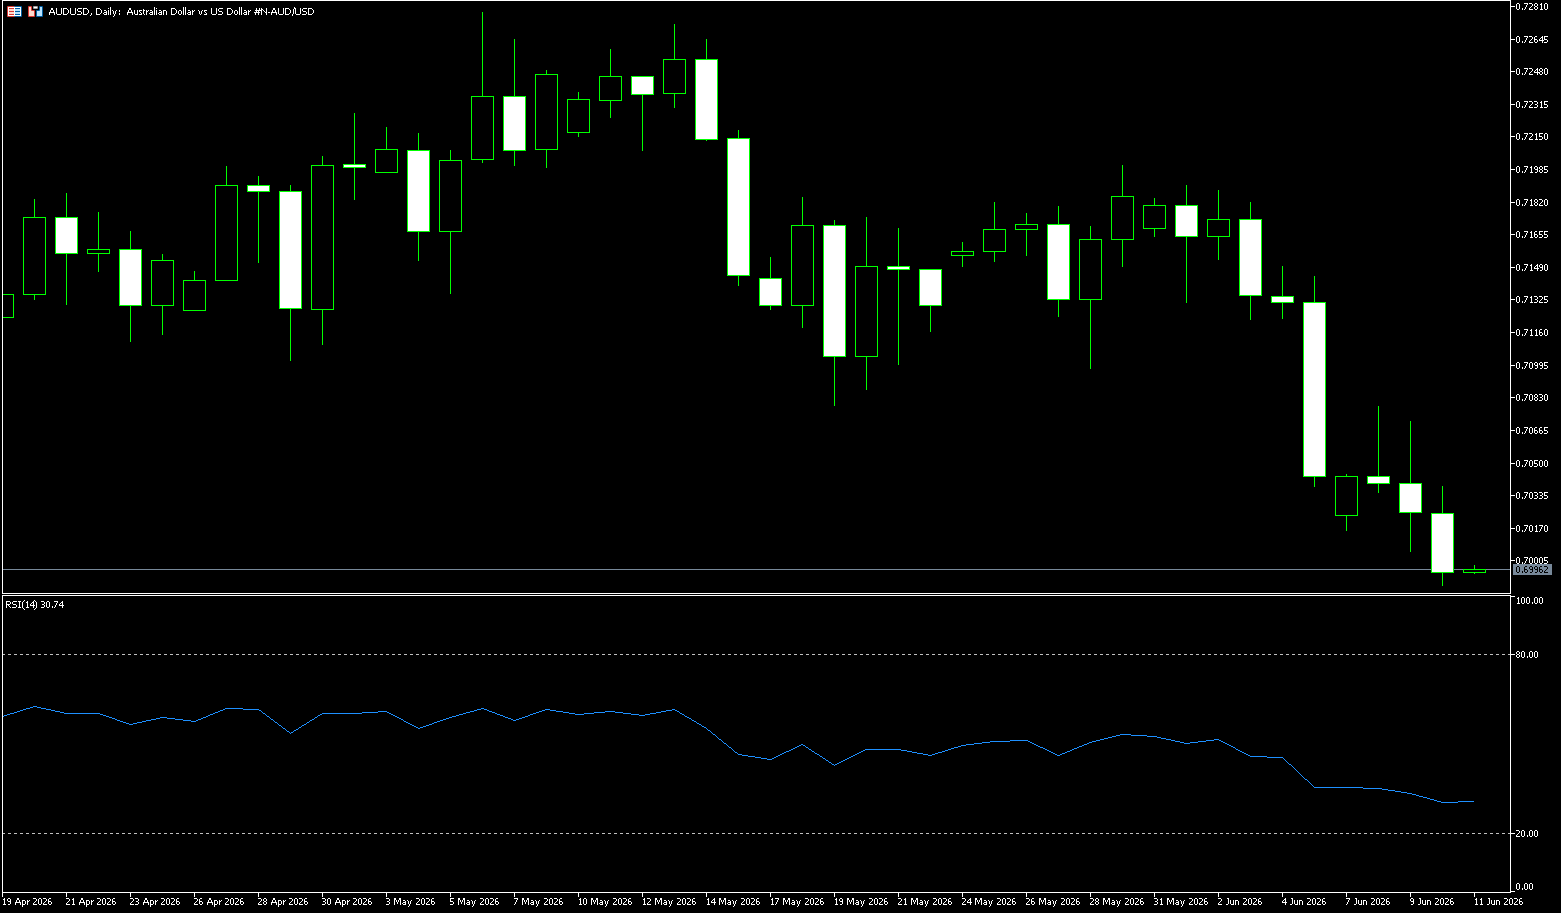
AUD/USD
The Australian dollar remains below US$0.7050, continuing its nine-week low, as ongoing tensions in the Middle East weigh on global risk sentiment. The conflict escalated after a new round of US strikes against Iran, with President Trump accusing Tehran of shooting down a helicopter in the Strait of Hormuz, casting a shadow over an already fragile ceasefire. The escalation has pushed up energy prices, exacerbating inflation concerns and increasing the risk of further central bank rate hikes. In Australia, consumer confidence weakened further in June as rising inflation and fuel costs continued to pressure household budgets. The focus now shifts to the Reserve Bank's upcoming policy decision next week, with interest rates widely expected to remain unchanged. Premier Bullock reiterated last week that the Reserve Bank remains firmly committed to reducing inflation, following three rate hikes earlier this year. Meanwhile, economists have lowered their expectations for an August rate hike, now anticipating the cash rate to peak at 4.35%.
The Australian dollar against the US dollar is currently in a weak consolidation phase, having retreated from its highs. A double-top pattern formed at 0.7186 and 0.7277, and the price has fallen to around 0.7020, breaking below the 20-day, 50-day, and 100-day moving averages, indicating a weakening short-term trend. Key support is at 0.6960 (140-day simple moving average), with strong support at 0.6900 (psychological level). Resistance is concentrated above 0.7079 (100-day simple moving average) and 0.7100 (psychological level). Technically, the MACD has crossed below the zero line, forming a death cross, and the green histogram is showing bearish momentum. The RSI is at 35.09, in a neutral-to-weak range, approaching oversold territory but without a clear rebound signal. In summary, the exchange rate is weak in the short term. If it cannot hold above 0.7079, it is likely to test the 0.7000 support level; if it breaks through the resistance level with significant volume, it may rebound to test the moving average resistance. The longer-term trend remains supported by the 200-day moving average (MA200), currently exhibiting a slightly weak and volatile pattern. Caution is advised regarding potential disruptions from fundamental factors.
Today, consider going long on the Australian dollar at 0.6990, with a stop-loss at 0.6980 and targets at 0.7050 and 0.7040.
GBP/USD
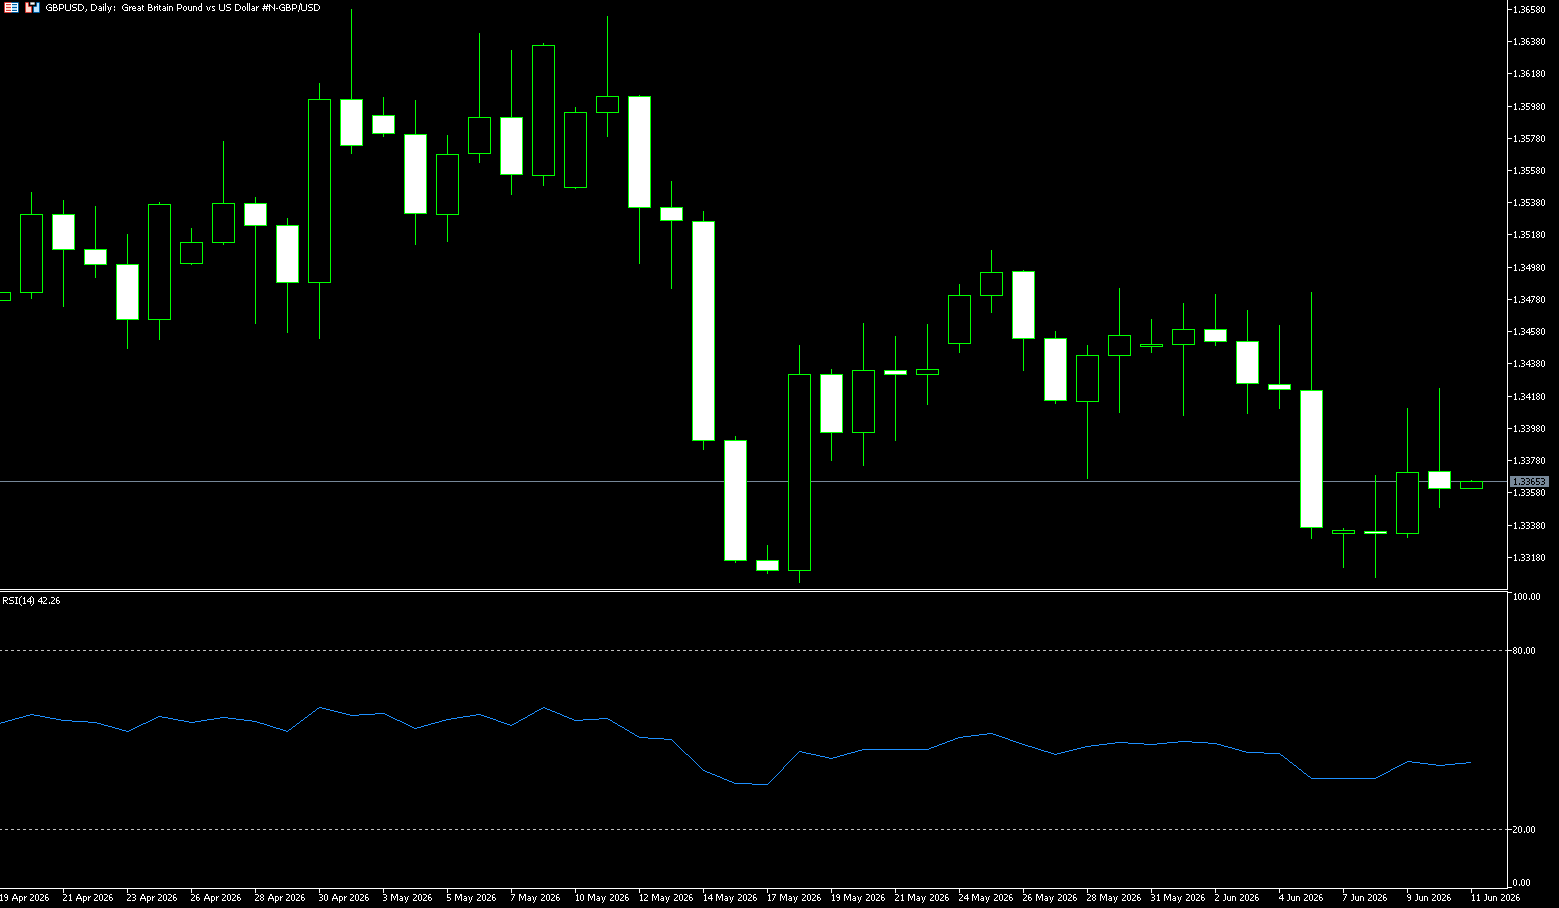
The pound/dollar pair rebounded to just below $1.34, recovering from a three-week low, after Iran and Israel agreed to de-escalate tensions at the urging of US President Donald Trump. Earlier clashes led to a rise in oil prices on Monday, amid market concerns that the ceasefire might fail. Rising energy costs due to tensions have exacerbated inflation concerns, prompting investors to expect at least a 25 basis point rate hike by the Bank of England in September, with a high probability of a second hike. However, Alan Taylor, a moderate member of the Monetary Policy Committee who supported the 8-1 decision in April to keep rates unchanged, stated on Monday that current interest rates are "quite tight" and further tightening to combat inflation is unnecessary.
The current GBP/USD exchange rate is influenced by a combination of factors, including strong US economic performance, rising market expectations of interest rate hikes, and safe-haven demand from the Middle East. The US dollar remains strong overall, while political uncertainty in the UK further weakens the pound's performance. In the short term, although the exchange rate has seen a technical rebound, the overall trend remains biased towards a weak and volatile movement. Technically, the GBP/USD daily chart has broken below some previous support areas, and the overall trend has gradually shifted from a slightly bullish to a slightly bearish bias. The exchange rate is currently trading below 1.3411 (the 10-day moving average) but remains near the medium- to long-term moving average system. The MACD indicator has shown a death cross signal, with the green bars gradually expanding, indicating that bearish momentum has increased. The RSI indicator has fallen back to around 45, suggesting that the market still has room for further short-term correction. Key support levels are first at 1.3330 (Tuesday's low) and then around 1.3300 (the psychological level). Initial resistance is at the psychological level of 1.3400; followed by the 50.0% Fibonacci retracement level at 1.3476, with other resistance levels at the 61.8% retracement level at 1.3517.
Consider going long on GBP/JPY today at 1.3360, with a stop loss at 1.3350 and targets at 1.3420 and 1.3430.
USD/JPY
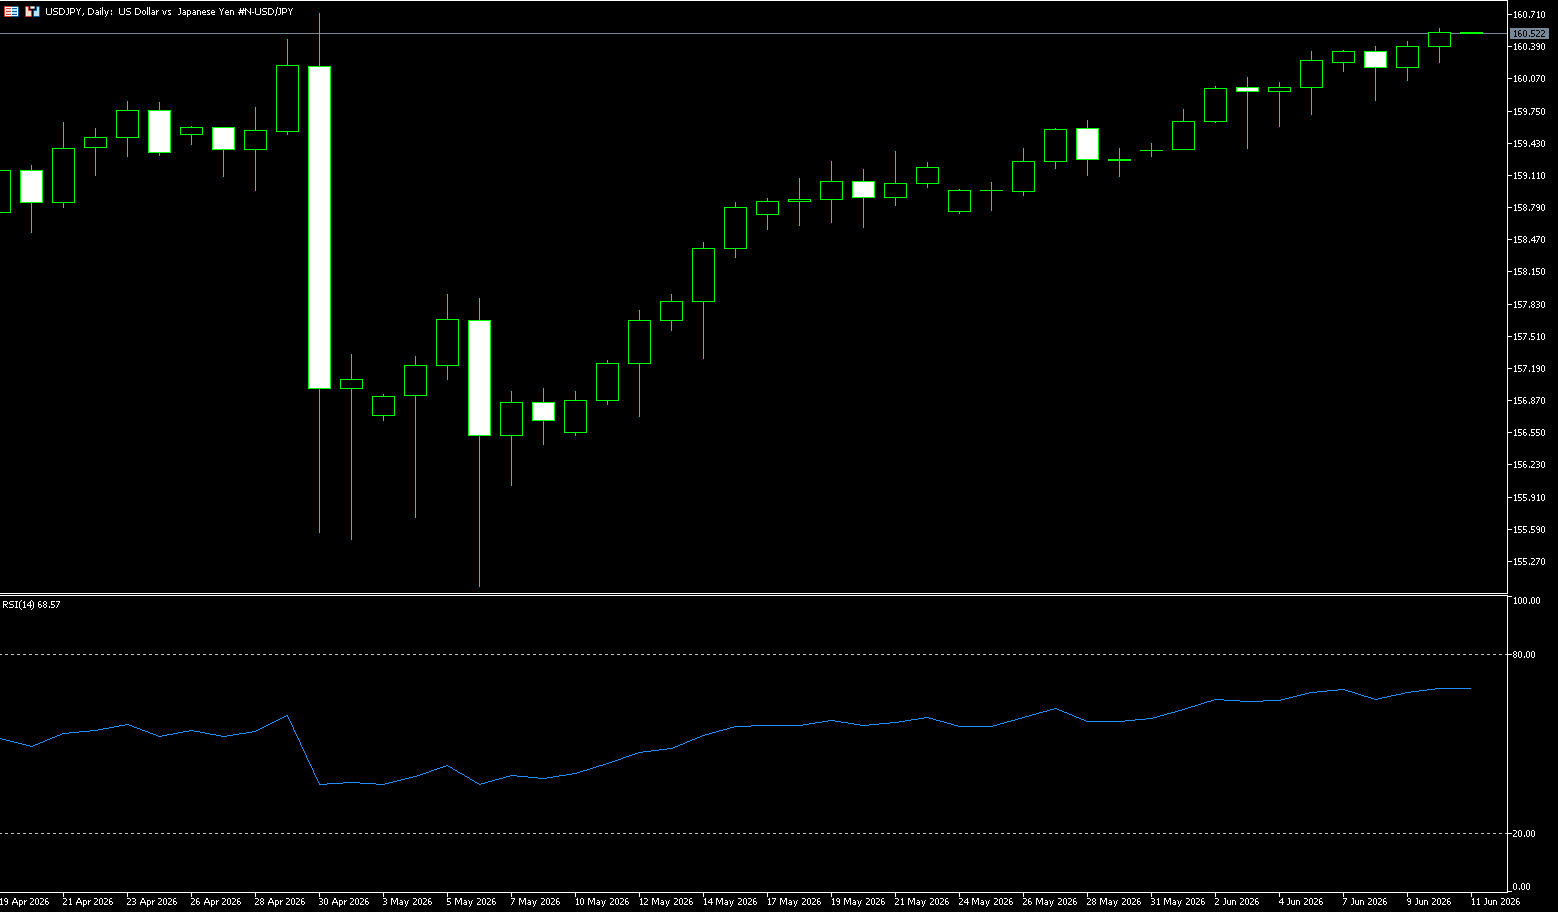
The yen traded around 160.50 per dollar on Wednesday, hovering near its lowest level since July 2024, despite the country's wholesale inflation accelerating at its fastest pace in three years due to soaring energy prices. Japanese producer prices rose 6.1% year-on-year in May, exceeding market expectations of a 5.5% increase after an upward revision to 5.3% in April. The latest data strengthened market expectations that the Bank of Japan will raise interest rates next week, as policymakers face increasing inflationary pressures stemming from Middle East conflicts and a sharp depreciation of the yen. Investors are still searching for hawkish signals from Bank of Japan Governor Kazuo Ueda, with increasing speculation about a possible rate hike in September and a third in December.
The net position of USD/JPY clearly shows a loosening of long positions, or rather, a significant increase in short positions. Compared to the dollar bulls, USD/JPY even faces the risk of a trend reversal. However, if the Bank of Japan confirms a rate hike but the yen does not fall, failing to trigger stop-loss orders for long positions, it could lead to yen longs covering their positions or shorts closing out, ultimately resulting in a significant breakout above the key 160 level. Recently, the dollar has surged, but USD/JPY has not followed suit. Furthermore, the recent USD/JPY exchange rate appreciation has shown increased volatility, indicating hesitation due to divergence between bulls and bears. Faced with the Bank of Japan's combined rate hikes and intervention, the strength of the bulls is weakening. Technically, USD/JPY is moving along an upward channel, currently slightly below the 5-day moving average of 160.23, with clear signs of intervention on the intraday chart, which will affect the bulls' willingness to push higher. Support is at 159.46 (20-day moving average) and near the 159 level. On the upside, watch for key resistance at 160.73 (April 30 high) and 161.00 (psychological level).
Consider shorting the US dollar at 160.70 today, with a stop loss at 160.85 and targets at 159.70 and 159.80.
EUR/USD
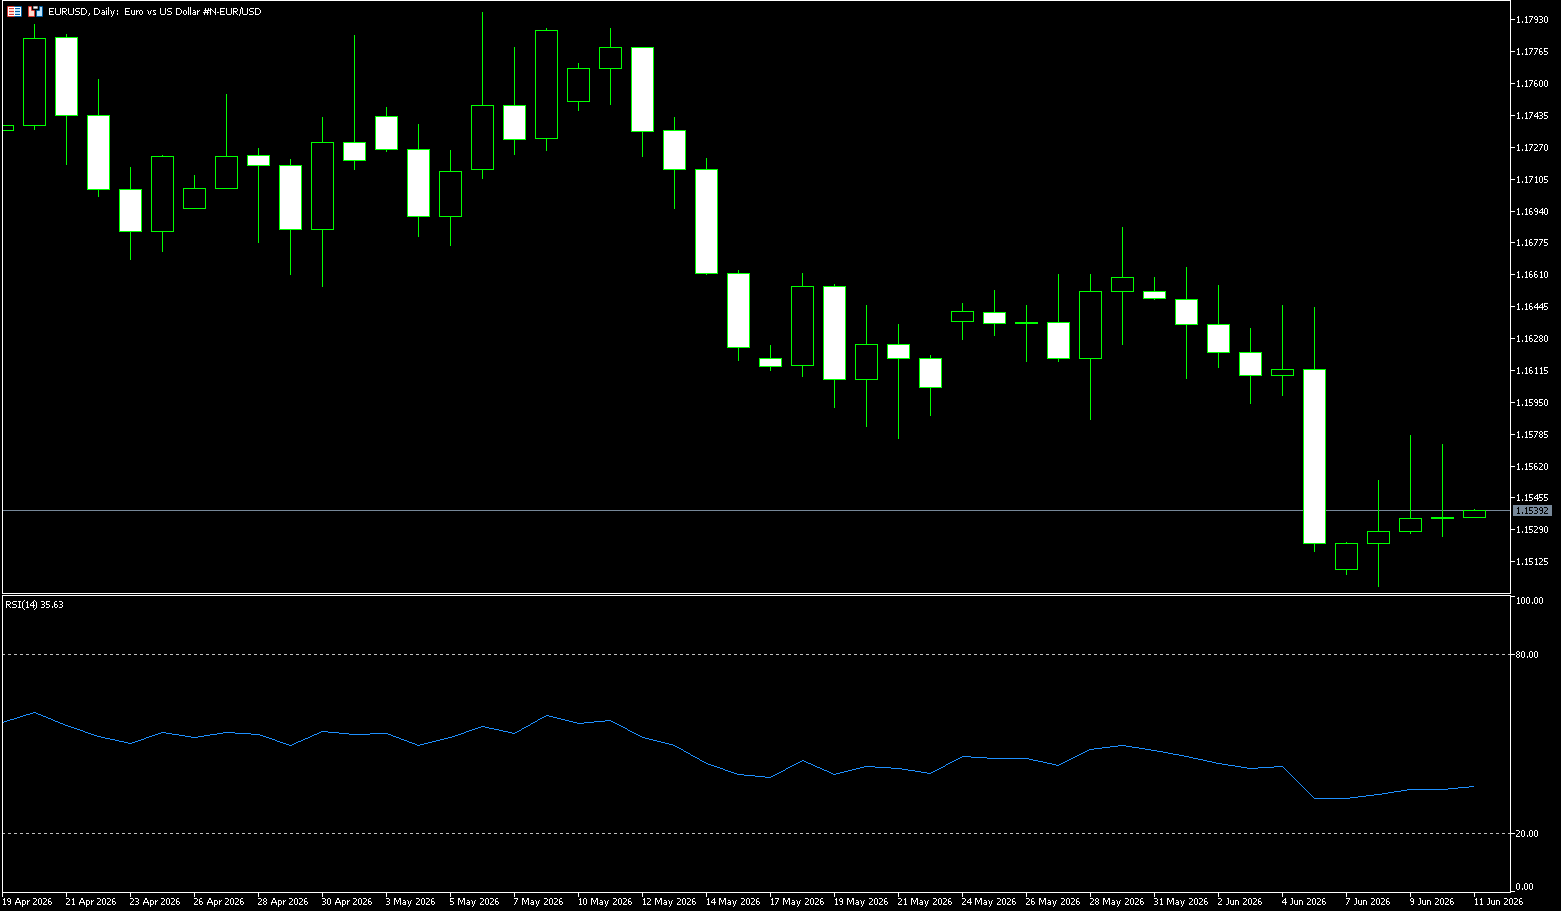
The euro rose slightly to $1.1540, attempting to rebound from a two-month low, as easing tensions between Israel and Iran temporarily reduced concerns that weekend attacks could undermine US-led Middle East peace efforts. Focus now shifts to the European Central Bank's policy meeting on Thursday, where a 25 basis point rate hike is expected—the first in a year—driven by the impact of the conflict on energy prices and inflation. Markets will also analyze President Lagarde's press conference for clues about further action. This anticipated rate hike comes after eurozone inflation reached its highest level in two and a half years. Money markets anticipate a tightening of approximately 70 basis points by the end of the year, implying one more 25 basis point rate hike and a greater than 70% probability of a third hike.
The euro/dollar pair is currently in a clear downtrend on the daily chart, having broken below the key support level of 1.1678 (the 200-day moving average), indicating strong overall bearish momentum. The moving average system is in a typical bearish alignment, with the price breaking below the 20, 50, 100, and 200-day moving averages, forming layers of resistance. Support lies at this week's low of 1.1499; a break below this level would open up further downside potential. In terms of indicators, the MACD DIFF line is below the DEA line, with the green bars continuing to expand, indicating continued bearish momentum. The RSI value is 39.20, in a weak zone; although close to oversold, there are no clear signs of a rebound, suggesting the short-term weakness is unlikely to change. Overall, the technical signals for the euro/dollar pair are bearish, with a short-term downtrend targeting this week's low of 1.3499 and 1.1443 (the low of March 30th). The rebound is merely a technical correction, with significant resistance ahead, namely the psychological level of 1.1600 and the 200-day moving average at 1.1678.
Consider going long on the Euro today at 1.1525, with a stop-loss at 1.1515 and targets of 1.1570 and 1.1580.
Stock Analysis:
Australian ASX 200 Stock Index
Basic Market Overview:
The Australian Securities Exchange (ASX) 200 index rose 49 points, or 0.6%, to close at 8,653 on Wednesday, ending three consecutive days of declines, supported by strong growth in retail trade, logistics, utilities, and transportation. Traders were unfazed by weakness in US futures, betting that the Reserve Bank of Australia might pause the cash rate next week, after three rate hikes this year. Meanwhile, business confidence improved in May, reaching a three-month high although still in negative territory, while business conditions remained stable. In China, a major trading partner, annual inflation stabilized at 1.2% in May, while transportation costs rose and food prices saw their biggest drop in seven months.
Sector Performance:
Leading Gains:
Consumer Staples +3.87% (Strongest performer overall)
Leading Stocks: Coles (+5%), Woolworths (+3.2%), CSL (+3.5%); Expectations of interest rate cuts benefit defensive consumer stocks.
Consumer Discretionary +3.58%
Leading Stocks: Wesfarmers, Harvey Norman, JB Hi-Fi all rose over 3.5%, reflecting a recovery in sentiment within the retail sector.
Real Estate Investment Trusts (REITs) +1.85%
Expectations of lower interest rates boosted real estate asset valuations. Other strong sectors: Financials (Banks +0.9%, Westpac up 2%), Utilities saw slight gains.
Leading Declines:
Information Technology (IT) -2.34% (largest drop)
Weakness in heavyweight stocks: NextDC (-2.1%), WiseTech (-1.5%), Xero (-1.4%).
Materials -1.14%
Overall pressure, the gold sub-sector plummeted **-4.45%** (due to lower gold prices); Rio Tinto and Fortescue declined slightly, with only BHP showing slight resilience.
Energy -0.87%
Oil price volatility dragged down Woodside, while Santos saw a slight increase to offset the decline.
Outstanding Stocks:
Steadfast Group +35.2%: Received a A$7.7 billion takeover offer, including debt, marking its best single-day performance.
Reece Group +8.57%: Barrenjoey upgraded its rating to "Overweight" with a target price of $16.50, citing improved earnings prospects.
Coles Group +4.95%: The consumer sector continued its strength, with the market anticipating a pause in RBA rate hikes.
Technical Analysis:
This week started with a continuation of the previous week's downward trend. Monday saw downward pressure, Tuesday continued the decline, and Wednesday saw a rebound after hitting a low, exhibiting an overall pattern of initial decline followed by a rise and consolidation. Weekly chart structure: It is currently in a mid-term correction channel following the decline from the April high, and a trend reversal has not yet formed. It is a high-level consolidation and correction, not a one-sided bear market. The index is currently hovering below the 21-EMA and near the 50-SMA, with the moving averages flattening out, indicating a shift from a strong to a weak bullish trend. The 500-SMA provides solid long-term support, and the overall cycle remains within a bullish framework; the current movement is merely a mid-term pullback. The RSI (Relative Strength Index) fell to the 45 range last week and rebounded slightly to around 50 this week, neither oversold (below 30) nor overbought, indicating a balance between bulls and bears and a lack of unilateral momentum. A stronger rebound would require the RSI to stabilize above 55-60. Meanwhile, the MACD histogram continues to narrow, with the fast line showing signs of crossing below the slow line to form a death cross, indicating continued bearish pressure. Wednesday's rebound only slightly narrowed the negative difference, without a clear golden cross reversal signal. Furthermore, the volume structure shows increased volume during declines and decreased volume during rebounds, typical characteristics of a weak rebound. Selling was concentrated in the resource and gold mining sectors, while interest rate-sensitive sectors (consumer, real estate, and banking) saw stronger buying support.
Trading Strategies:
The following are technical trading ideas only and do not constitute investment advice. Leveraged trading may result in losses exceeding the principal.
Short-Term Strategies (1-5 days)
Long Positions:
SDF: Driven by acquisition news, but be wary of a pullback after a surge. Small positions are recommended, with a 5% stop-loss, and a target price near the acquisition price.
Retail Sector (COL, WOW): With the RBA's expected pause in rate hikes, pay attention to the effectiveness of the 8,600 support level. Consider entering near the 20-day moving average.
Bank Stocks (WBC, ANZ): Interest rate sensitive. Add to positions if it breaks through the 50-day moving average, with a target of the previous high.
Short Positions:
Materials/Gold Stocks (LTR, PDN): Commodity prices are weak. Consider a small short position on a rebound to the 10-day moving average, with a stop-loss above the 5-day moving average.
Technology Stocks (XRO, WTC): Dragged down by US technology stocks, consider shorting opportunities when the rebound is weak.
Key Risk Warnings Geopolitical Risks: Escalating tensions in the Middle East could lead to a surge in oil prices, impacting inflation expectations and interest rate paths, dragging down market performance.
RBA Policy Risks: An unexpected interest rate hike on June 16 (with a probability of approximately 35%) would hit interest rate-sensitive sectors (banks, real estate, and consumer goods), potentially causing the index to fall below 8,400 points.
Shanghai Composite Index
Basic Market Overview:
On Wednesday, the Shanghai Composite Index fell 0.42% to close at 3,993 points, while the Shenzhen Component Index fell 2.06% to 14,954 points, reversing gains from the previous trading day, as investors weighed the inflationary impact of soaring global energy prices caused by Middle East tensions. In May 2026, the annual producer price index climbed to 3.9% from 2.8% the previous month. This is the highest level since July 2022, as higher commodity and energy costs are exacerbated by war-related supply disruptions. Meanwhile, China's annual consumer inflation rate remained high at 1.2% in May, although slightly below market expectations of 1.3%. While China has mitigated some of the energy shock through strategic reserves and renewable energy capabilities, continued cost pressures may squeeze corporate profit margins and impact household consumption through higher prices.
Sector Performance:
Leading Sectors (Strong Against the Trend, Defensive Funds + Thematic Driven):
Financial Sector (Strongest Market Support)
Insurance: Overall gains exceeded 3%, with China Life and New China Life surging 3%-10%, demonstrating strong defensive characteristics and attracting safe-haven funds; Banks: Xiamen Bank +5%, Qingdao Bank and Qilu Bank +3%, undervalued heavyweights supporting the index; Securities firms followed suit with slight gains, liquidity hedging against downside risks.
Chemical Price Increase Sub-sectors
Industrial gases and propylene oxide performed strongly; multiple stocks, including Hangzhou Oxygen Plant Group, Heyuan Gas, and Sinochem International, hit their daily limit, with tight supply and demand pushing up product prices.
Semiconductor Materials / Electronic Specialty Gases
Unlike the sharp decline in AI hardware, upstream materials bucked the trend and remained resilient; GRINM Powder Materials hit its 20cm daily limit, while CSIC Specialty Gas and CMCI reached new highs, supported by positive industry expectations.
Event-Driven Consumption
Beer (catalyzed by the World Cup): Huiquan Beer hit its daily limit, while Zhujiang and Yanjing rose over 6%; tourism and hotels, and some food and beverage stocks saw slight gains.
Other Minor Themes: Ordnance equipment restructuring and PCB copper-clad laminate rebounded from low levels.
Leading Declining Sectors (High-flying sectors experiencing concentrated profit-taking):
AI Computing Hardware Chain (Largest Decline)
CPO optical modules, passive components, high-speed copper cables, and memory chips all suffered heavy losses; Tianfu Communication and Guangku Technology fell over 7%, with many stocks hitting their daily limit down, reflecting profit-taking after significant previous gains.
High-end Manufacturing Growth Sector:
Humanoid robots/reducers saw a sharp decline, with Huachen Equipment falling over 15%; power grid equipment, power supply equipment, and photovoltaics also retreated; superhard materials and commercial aerospace weakened.
Cyclical Sectors:
Coal mining and processing suffered a significant drop, with Haohua Energy falling over 7%; non-ferrous metals and precious metals also declined, with falling gold prices suppressing sector sentiment.
Technology Themes:
Consumer electronics and AI application software followed suit with adjustments, with only a few individual stocks showing independent performance.
Technical Analysis:
The daily chart of the domestic A-share market shows a small negative candle, trading below yesterday's closing price and falling below the 4000-point mark, which is a healthy consolidation after a continuous rebound. Currently, it maintains the initial W-shaped double bottom pattern (both pullbacks to the 3950-point support level were quickly recovered), and the medium-term upward structure remains intact. Technical indicators: KDJ indicator: The blue line continues to diverge upwards, indicating that the short-term bullish momentum continues and the adjustment space is limited; MACD indicator: The green bars on the daily level are narrowing, indicating that the bearish force is weakening, and the 60-minute level maintains a bottom divergence structure, indicating that the rebound momentum is accumulating; and the volume is decreasing (slightly higher than yesterday), indicating that the selling pressure is limited and it is a stage of clearing out the chips after a big rise. 3878 stocks declined across the two exchanges, while only about 1200 rose, indicating a weakening profit-making effect and a more cautious market sentiment.
Trading Strategy:
The following is for reference only and does not constitute investment advice. Stock market volatility carries the risk of principal loss.
Short-term Strategy:
Buy on dips at support levels (3970-3980 points), sell on rallies at resistance levels (4010-4020 points), and strictly adhere to stop-loss orders (below 3950 points).
Focus on undervalued defensive sectors (banks, insurance, and consumer goods), and avoid the short-term pullback risk of high-flying technology growth stocks.
Mid-term Strategy:
Maintain the view of an upward trend with fluctuations. View pullbacks as buying opportunities. Monitor volume changes and the 4050-point level breakout.
Equip a balanced portfolio of defensive and growth stocks, maintaining a position of 60%-70%, and avoid chasing highs.
Risk Warning:
If the 3950-point support level is broken, decisively reduce positions to 30%-40% and wait for stabilization signals. Closely monitor the movements of US stocks and international commodities tonight, and guard against overnight risks.
Disclaimer: The information contained herein (1) is proprietary to BCR and/or its content providers; (2) may not be copied or distributed; (3) is not warranted to be accurate, complete or timely; and, (4) does not constitute advice or a recommendation by BCR or its content providers in respect of the investment in financial instruments. Neither BCR or its content providers are responsible for any damages or losses arising from any use of this information. Past performance is no guarantee of future results.
More Coverage


Risk Disclosure:Derivatives are traded over-the-counter on margin, which means they carry a high level of risk and there is a possibility you could lose all of your investment. These products are not suitable for all investors. Please ensure you fully understand the risks and carefully consider your financial situation and trading experience before trading. Seek independent financial advice if necessary before opening an account with BCR.
BCR Co Pty Ltd (Company No. 1975046) is a company incorporated under the laws of the British Virgin Islands, with its registered office at Trident Chambers, Wickham’s Cay 1, Road Town, Tortola, British Virgin Islands, and is licensed and regulated by the British Virgin Islands Financial Services Commission under License No. SIBA/L/19/1122.
Open Bridge Limited (Company No. 16701394) is a company incorporated under the Companies Act 2006 and registered in England and Wales, with its registered address at Kemp House, 160 City Road, London, England, EC1V 2NX. Open Bridge Limited acts solely as a payment processor for BCR Co Pty Ltd and does not provide any financial, trading, or investment services on its behalf. Open Bridge Limited's role is limited to payment processing.

 English
 简体中文
简体中文
 繁體中文
繁體中文
 Bahasa
Melayu
Bahasa
Melayu
 Tiếng
Việt
Tiếng
Việt
 ไทย
ไทย
 日本語
日本語
 한국어
한국어
 ភាសាខ្មែរ
 español