


0
Currency & Commodity Analysis:
US Dollar Index (DXY)
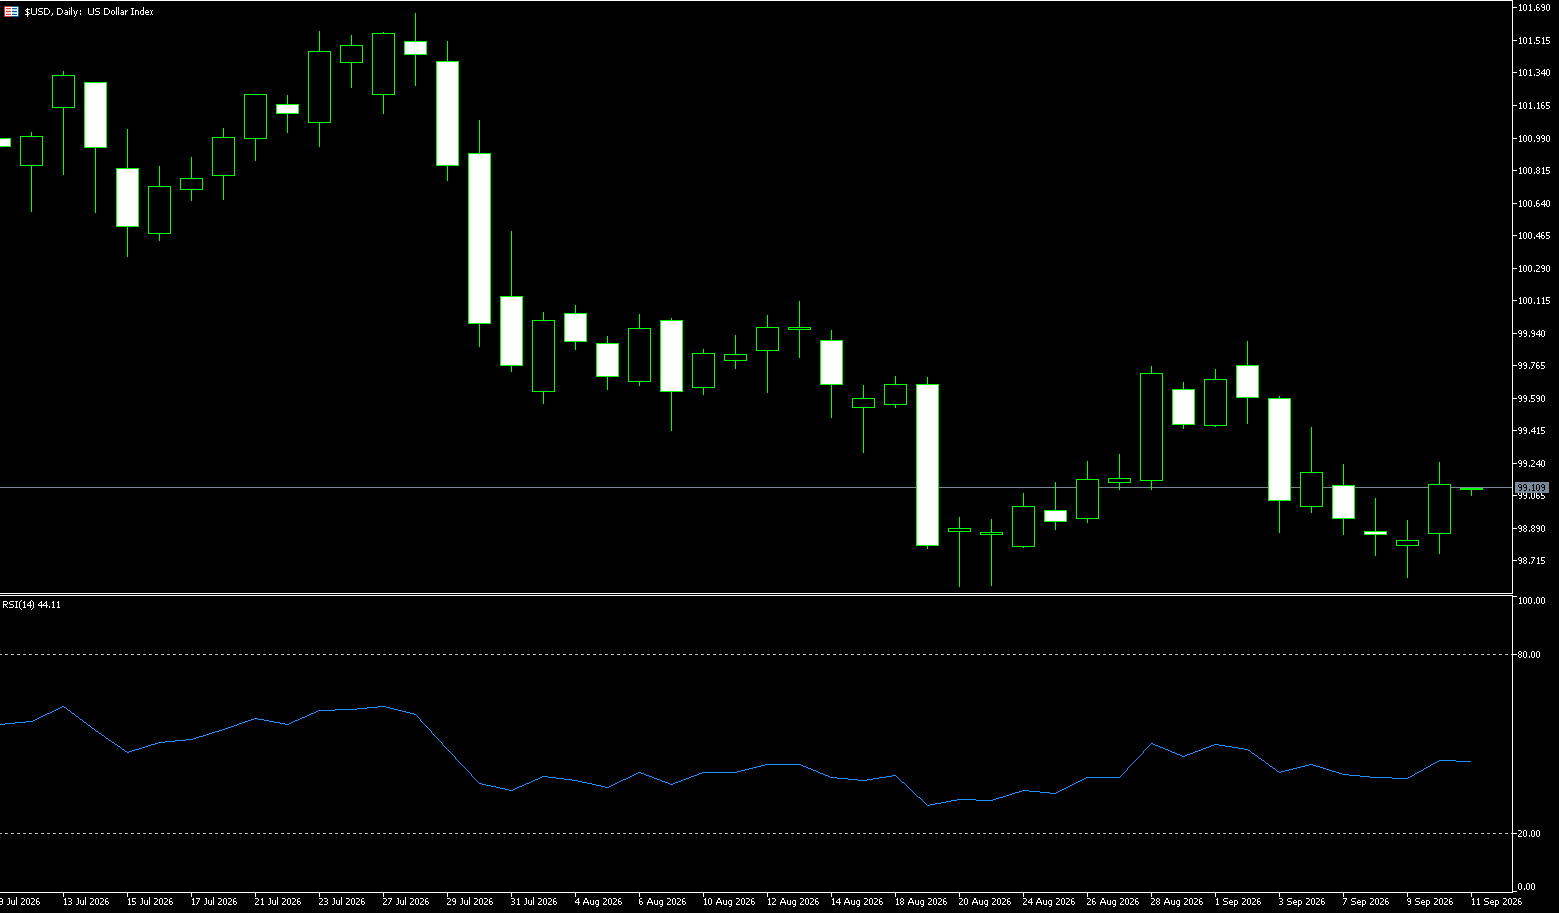
The US Dollar Index rose to 99.60 on Monday, marking its fourth consecutive day of gains, as investors prepared for the upcoming Federal Reserve policy meeting and assessed the impact of surging oil prices. Markets currently price in an 86% probability of a 25-basis-point rate hike by the Fed on Wednesday, with expectations for another hike later this year. Data released on Friday showed US consumer inflation holding at 3.4% in August—matching both the July reading and market expectations—while core CPI rose 0.3% month-over-month, indicating higher-than-expected underlying inflation. US producer prices also accelerated in August, and labor market data demonstrated continued employment resilience. Oil prices climbed after Saudi Arabia shut down the key East-West Pipeline—which provides an alternative route bypassing the Strait of Hormuz—further adding to inflationary pressures.
Bullish positioning on the US dollar weakened further during the week ending September 1. According to Commodity Futures Trading Commission (CFTC) data, non-commercial net long positions fell to just over 17,000 contracts, continuing a recent downward trend. Additionally, the four-week change turned negative (approximately -5,500 contracts), confirming a shift toward a bearish positioning trend. Other data showed open interest rising to just over 50,000 contracts—an increase of about 4.3%. With net positioning deteriorating alongside rising market participation, the trend suggests the establishment of new bearish positions rather than merely the unwinding of existing long positions. The dollar's historically constructive positioning advantage is fading. On the upside, the level to watch is 99.86 (the September 2 high); a breakout above this resistance confluence would trigger a bullish reversal and push the index toward the 100.00 mark. On the downside, support lies at 99.13 (the 200-day moving average); a break below this level would open the way for a test of the 99.00 round-number level.
Consider shorting the US Dollar Index at 99.58 today; stop-loss: 99.70; targets: 99.20, 99.10.
WTI Spot Crude Oil
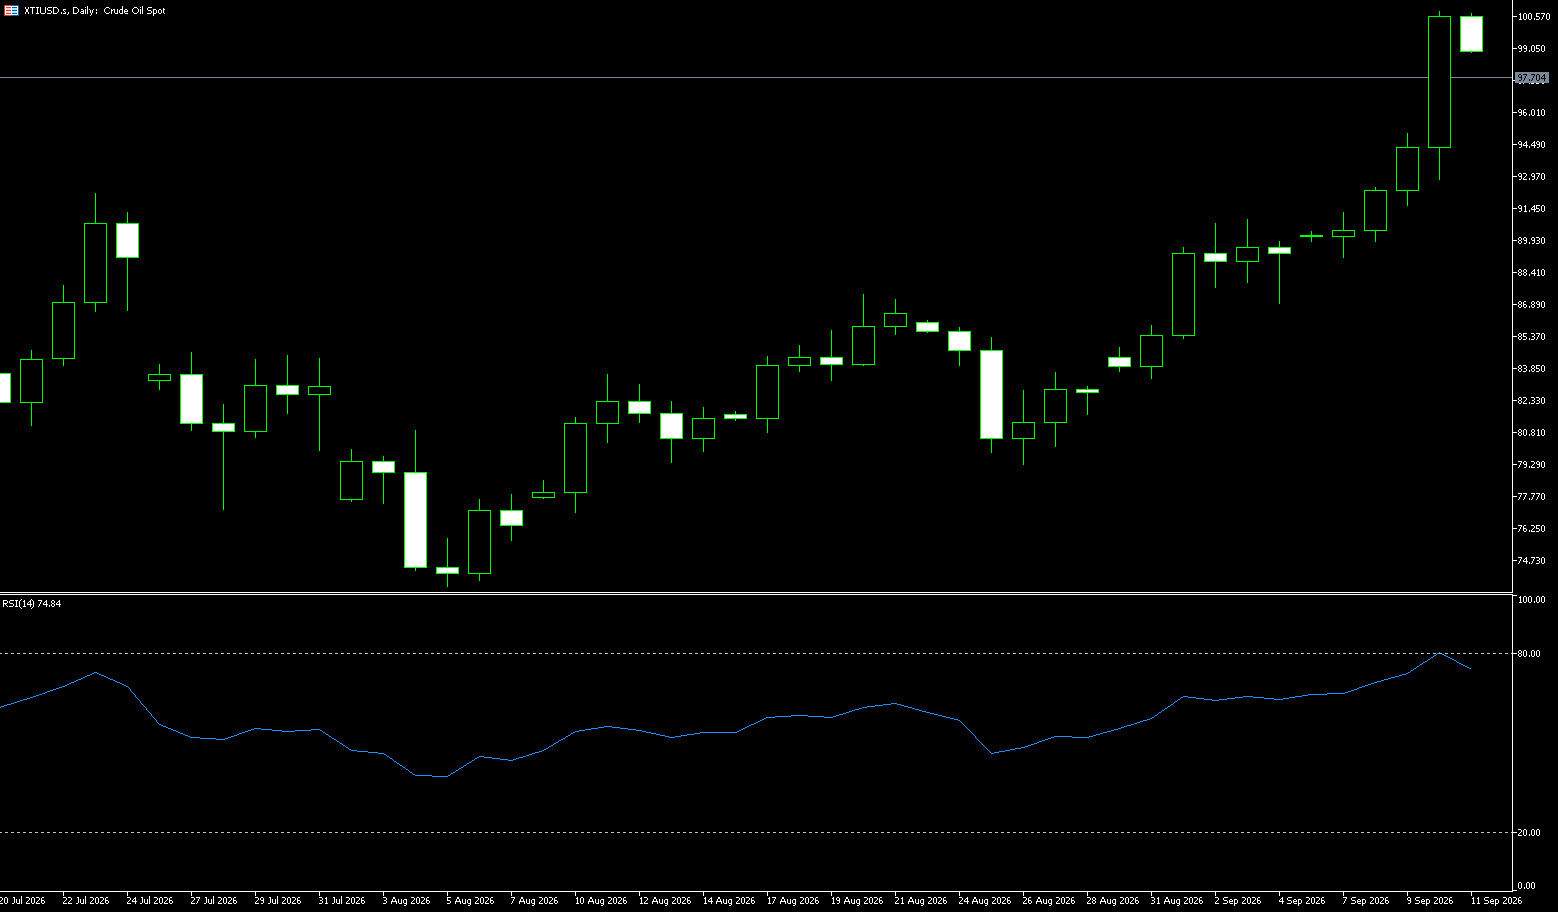
US crude oil surged over 2% at the open on Monday, trading near $98.50. Factors driving this move include targeted operations by Houthi forces near the Bab el-Mandeb Strait, the suspension of a key Saudi pipeline following an attack, and the reported postponement of a scheduled meeting (originally set for the 14th) between Iran and several Gulf states regarding a temporary shipping corridor in the Strait of Hormuz. Citing attacks on Saudi energy facilities, the International Energy Agency (IEA) reported last Friday that Saudi Arabia's crude oil supply in August fell by 2.3 million barrels per day (bpd) from the previous month to 6 million bpd—the lowest level in over 30 years. Energy markets showed divergent trends last week. The two major crude oil benchmarks posted strong weekly gains, each recording four consecutive bullish sessions followed by a single bearish day, with capital flows initially concentrated on long positions; US heating oil and unleaded gasoline prices rose in tandem, while natural gas bucked the trend and fell. Disruptions to Middle East shipping, Saudi supply dropping to multi-decade lows, and record-high US diesel prices formed the primary narrative on the supply side. However, long upper shadows on candlesticks and profit-taking indicate growing short-term divergence, though the medium-term bullish structure remains intact.
WTI crude oil displays a "four bullish days followed by one bearish day" pattern. After surging significantly for four consecutive trading days, WTI crude oil broke through the $100 mark, tested a recent high, and approached a previous resistance zone. Overall, the latest US-Iran geopolitical conflict has decisively ended the market's low-price stability, causing the baseline oil price to shift systematically upward. However, as alternative shipping routes are implemented, supply and demand self-adjust, and nations deploy policy countermeasures, market panic is gradually subsiding, making a sustained, extreme one-way price rally unlikely. Amid a prolonged geopolitical standoff with no clear victor, the crude oil market has entered a new phase characterized by high volatility, a significant risk premium, and a fragile balance; supply and demand are dynamically adjusting as the market gradually moves toward a new equilibrium. Consequently, key resistance levels to watch include the psychological $100.00 mark and $100.85 (last week's high); a decisive break above this zone would pave the way for a further rise toward the $103 level. On the downside, support levels to consider are $96.52 (5-day moving average) and $90.00 (a key psychological support level).
For today, consider going long on crude oil at $97.85; stop-loss: $97.70; targets: $99.50 and $100.00.
Spot Gold
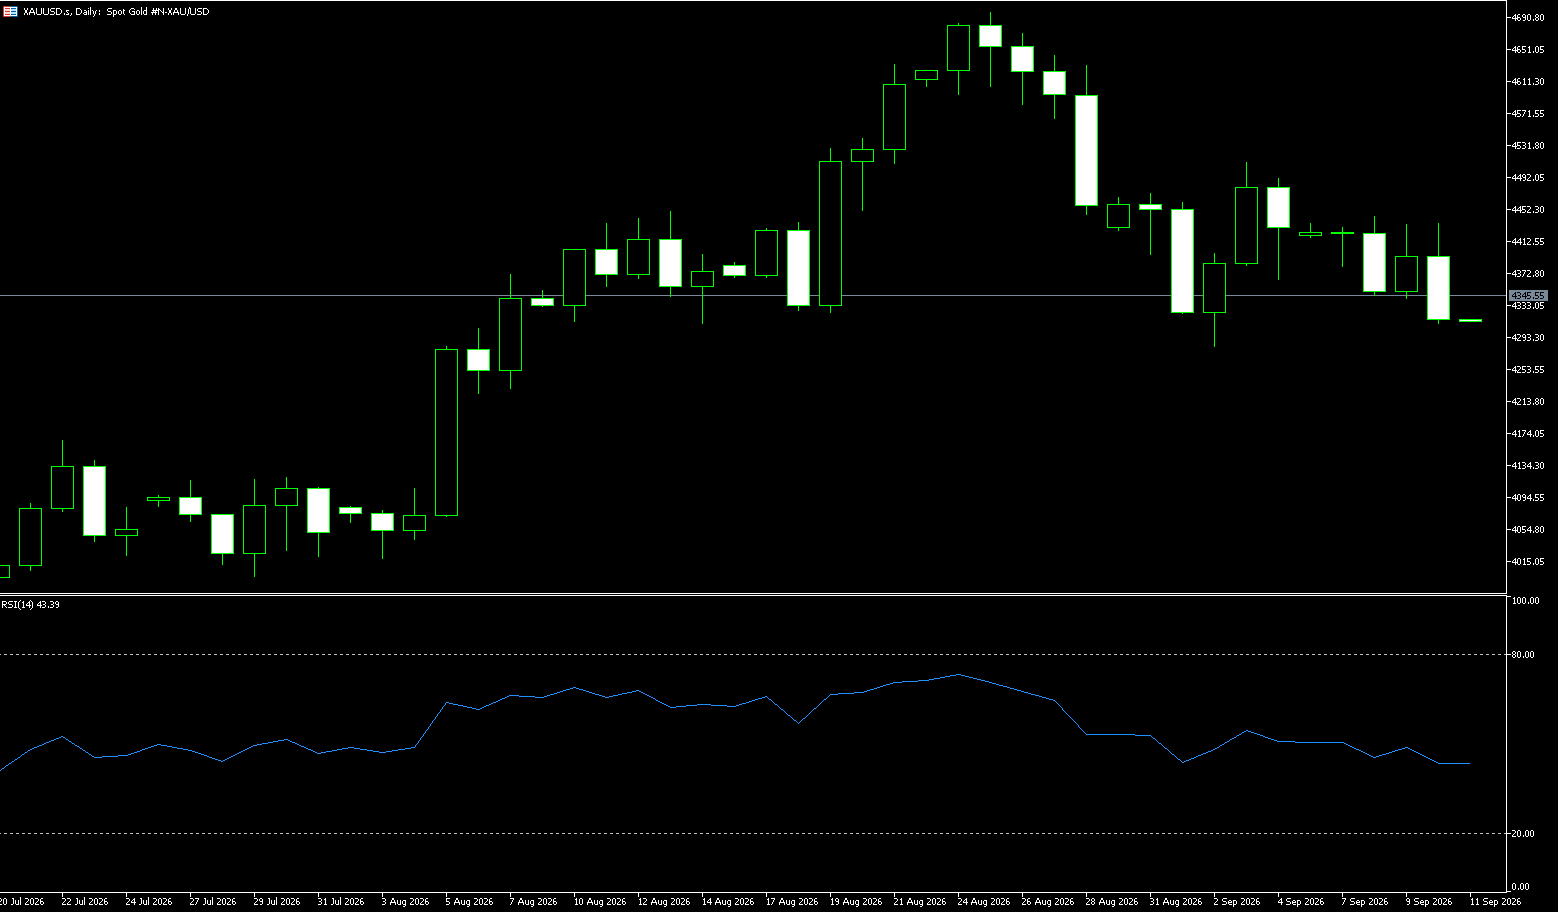
Gold hovered just below $4,300 per ounce on Monday—following three consecutive weeks of declines—weighed down by surging oil prices and bets on tighter Federal Reserve monetary policy. Oil prices spiked to a four-month high on Monday after Saudi Arabia shut down a key pipeline—used to bypass the Strait of Hormuz—following a drone attack. The ongoing Middle East crisis has delivered an inflation shock to the global economy, reinforcing hawkish expectations regarding interest rates. Markets currently price in an approximately 86% probability that the Federal Reserve will raise its policy rate by 25 basis points on Wednesday. Data released on Friday showed US consumer inflation holding steady at 3.4% in August—matching July's figure and meeting expectations—while the monthly CPI rose by 0.4%, marking the largest increase in three months. US producer prices accelerated in August as the conflict involving Iran drove up wholesale energy costs, while labor market data indicated continued resilience in employment.
On a daily chart, spot gold entered a phase of choppy retracement after hitting a high near $4,696.50/oz in August, subsequently establishing a low around $4,282.50/oz. The Bollinger Bands show the middle band at approximately $4,456/oz, the upper band at $4,684/oz, and the lower band at $4,230/oz. Prices are currently trading between the middle and lower bands; the bandwidth has narrowed compared to the expansion seen in August, reflecting a shift in volatility from a sharp impulse to a consolidation phase. The MACD shows the fast line positioned below the slow line. These readings indicate a loss of momentum following the August peak, though this does not necessarily signal a trend reversal. More significant are the structural details: lower highs, support found near the lower Bollinger Band, and a dynamic reference zone formed by the moving average system and the Bollinger middle band. Key levels to watch on the upside include $4,380 (9-day moving average) and the psychological $4,000 mark; on the downside, watch the $4,281.60 level (September 2 low). A break below this level would point toward the lower Bollinger Band at approximately $4,230.
Consider going long on gold at $4,290 today; stop-loss at $4,285; targets: $4,350 and $4,340.
AUD/USD
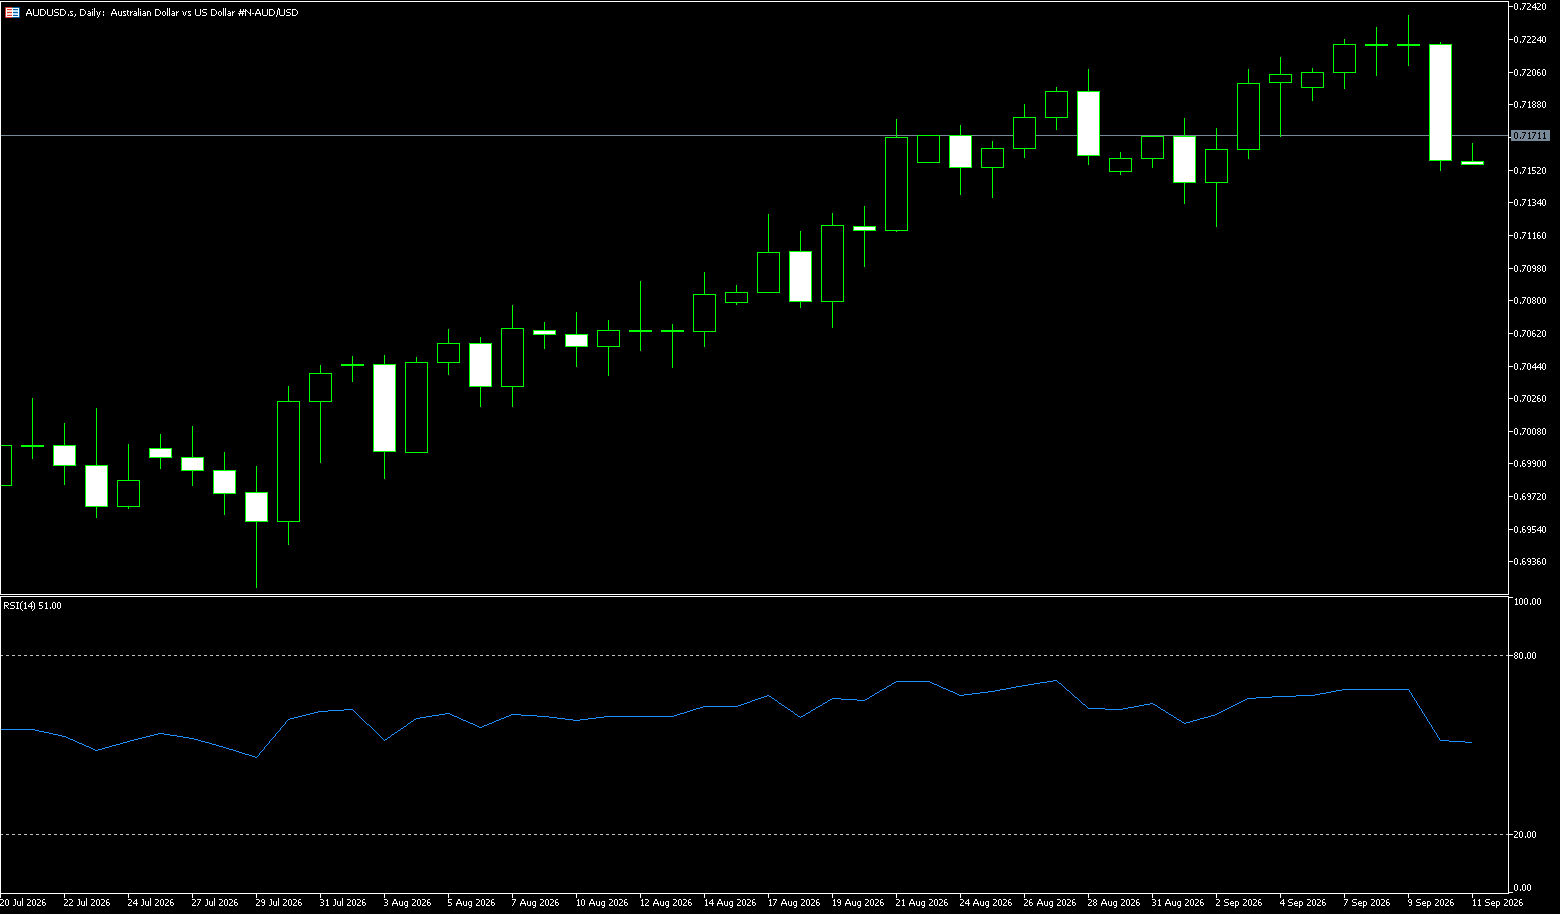
During Monday's early Asian session, AUD/USD edged lower to around 0.7130. A stronger-than-expected US inflation report provided some support for the US dollar against the Australian dollar. Market attention is now focused on the Federal Reserve's interest rate decision scheduled for Wednesday. The US Bureau of Labor Statistics reported on Friday that the US Consumer Price Index (CPI) rose 0.4% month-on-month in August, bringing the 12-month increase to 3.4%; both figures met market expectations. This CPI data followed strong readings in several components of the Producer Price Index (PPI) released on Thursday, fueling market concerns about a potential Fed rate hike and bolstering the dollar. However, the Reserve Bank of Australia's (RBA) hawkish tone may help limit the Australian dollar's decline. RBA Assistant Governor Sarah Hunter stated on Tuesday that the central bank might need to raise rates again if inflation proves stickier than anticipated, keeping the possibility of a September rate hike on the table.
On the daily chart, AUD/USD remains above the lower Bollinger Band at 0.7098, indicating a constructive short-term tone, while the price tests the area below the middle Bollinger Band at 0.7166. The 14-day Relative Strength Index (RSI) stands at 48—slightly positive—suggesting buyers remain in control, though momentum is not overextended. On the upside, initial resistance lies at the 9-day simple moving average (SMA) of 0.7188, followed by the upper Bollinger Band near 0.7236 and the May 14 high of 0.7264, where upward momentum may face headwinds. On the downside, initial support lies at the 0.7100 round figure and the lower Bollinger Band near 0.7096; a break below this level would undermine the bullish bias and expose the pair to a deeper pullback towards the 50-day simple moving average (SMA) near 0.7070.
Consider going long on the AUD at 0.7130 today; stop-loss: 0.7120; targets: 0.7180, 0.7200.
GBP/USD
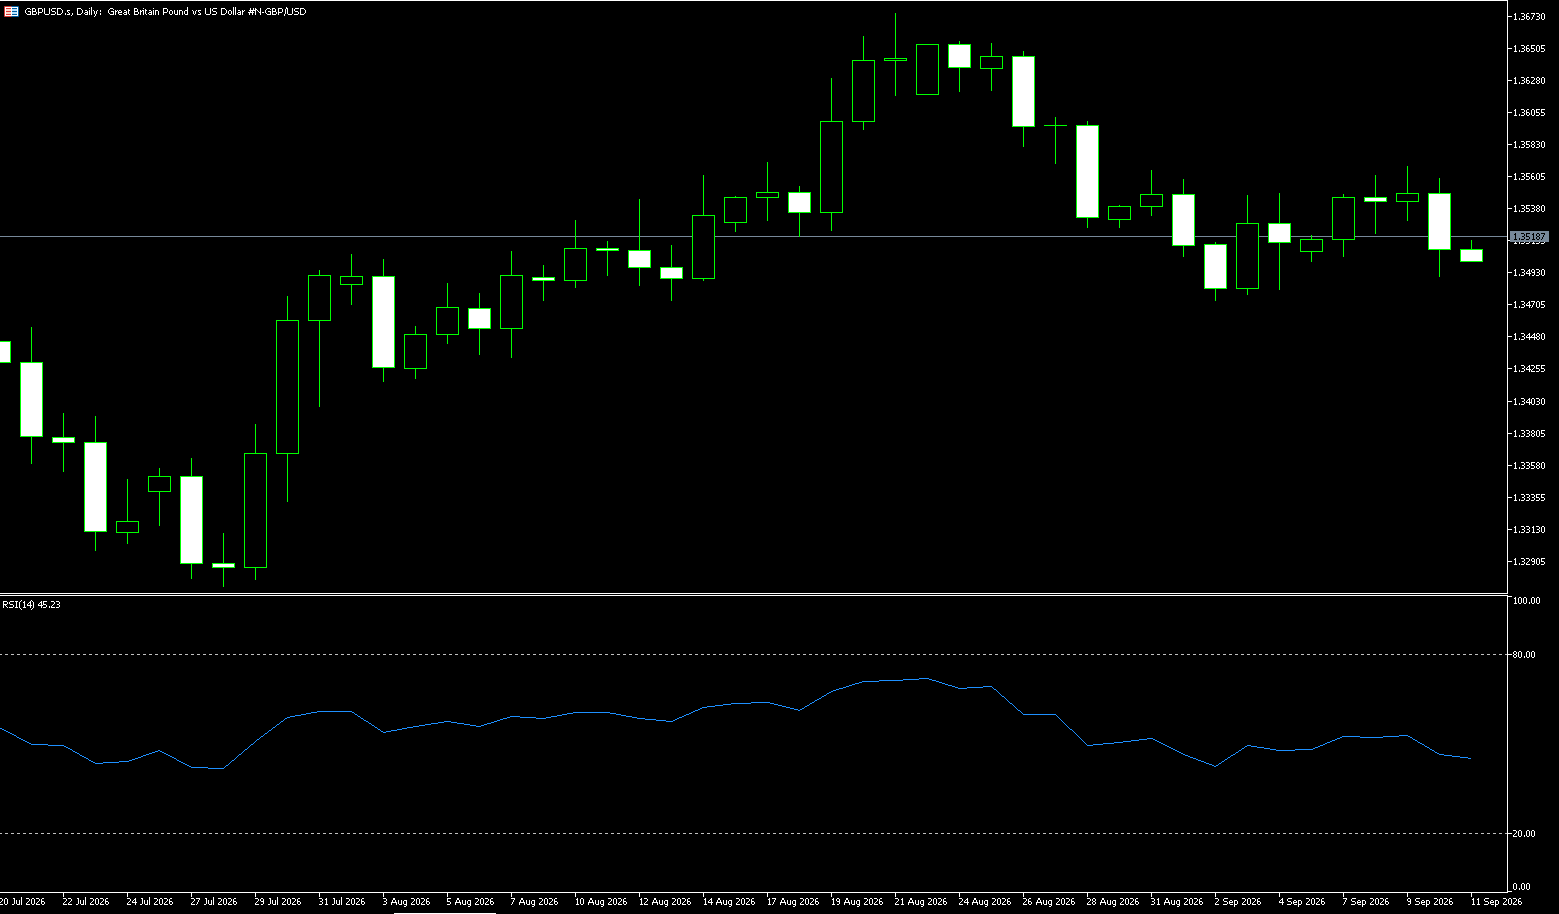
GBP/USD struggled to capitalize on Friday's rebound from near-monthly lows, consolidating above the 1.3500 psychological mark at the start of the new week. Traders appeared reluctant to place aggressive directional bets, opting to stay on the sidelines ahead of key central bank events. The Federal Reserve and the Bank of England are scheduled to announce their monetary policy decisions on Wednesday and Thursday, respectively. US inflation data released last week reinforced market bets that the US central bank might raise interest rates by 25 basis points. This, combined with escalating tensions in the Middle East, provided support to the safe-haven US dollar and capped gains for the GBP/USD pair. Recent developments indicate that a planned regional meeting between Gulf states and Iran regarding the Strait of Hormuz has been postponed; this has kept the geopolitical risk premium intact, serving as another factor supporting the safe-haven dollar. On the other hand, the British pound found support in Friday's better-than-expected UK GDP report.
The GBP/USD pair remains below the 20-day simple moving average (SMA) at 1.3559 and the 1.3568 level (last week's high). This keeps the short-term tone slightly bearish, suggesting that upside attempts will remain limited unless buyers can decisively reclaim this area of resistance. Technical indicators show the 14-day Relative Strength Index (RSI) hovering near 46, while the MACD histogram is slightly negative, implying that upward momentum is fading rather than accelerating. A sustained break above the aforementioned levels would open the way for a further rise toward the 23.6% Fibonacci retracement level at 1.3575, followed by the 1.3600 psychological mark. On the downside, initial support lies at the 50.0% retracement level of 1.3468, with deeper support located near the 61.8% level at 1.3420 and the 1.3400 round figure.
Consider going long on GBP at 1.3490 today; stop-loss: 1.3480; targets: 1.3550, 1.3560.
USD/JPY
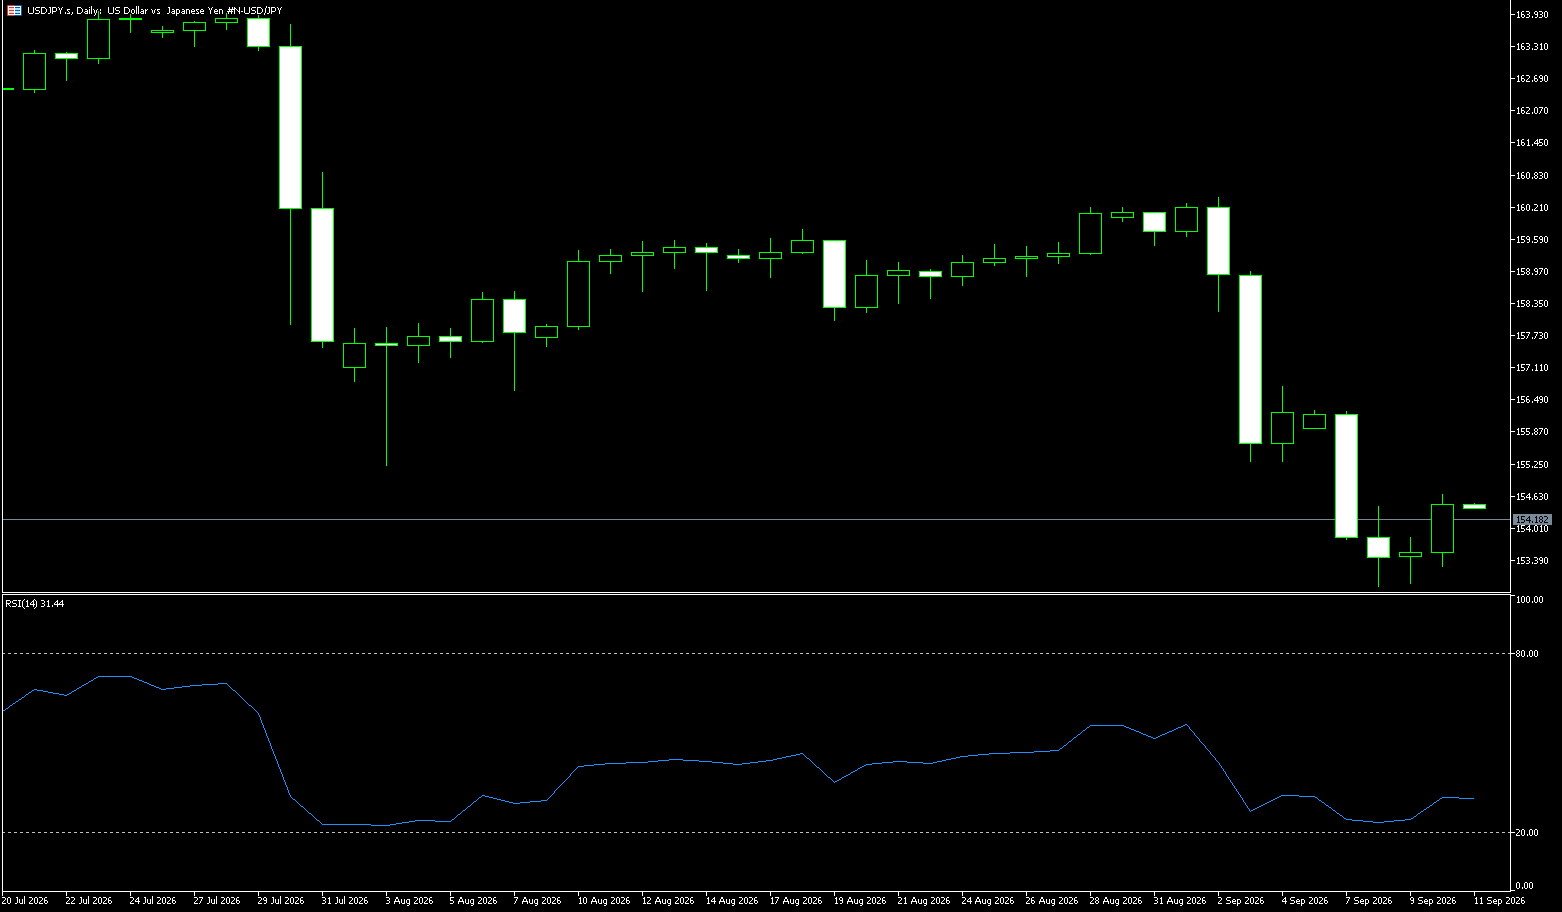
The USD/JPY pair attracted some buying interest at the start of the new week, rising toward the 154.35 level during the Asian session and recovering some of Friday's losses. However, the spot price remains confined within the range established over the past week or so and stays close to the near seven-month low hit last Tuesday, as traders await key central bank events this week. The Federal Reserve and the Bank of Japan are set to hold high-stakes policy meetings on September 15–16 and September 17–18, 2026, respectively. Recent US inflation data released last week reinforced market bets that the Fed will raise borrowing costs on Wednesday. Additionally, escalating tensions between the US and Iran have bolstered the safe-haven US dollar, acting as a tailwind for the USD/JPY pair. A repricing toward a more hawkish policy-tightening path by the Bank of Japan could continue to support the yen and limit the pair's upside potential. Indeed, traders have fully priced in a 25-basis-point rate hike for later this week and assign a high probability to another hike in December.
On the daily chart, USD/JPY recently traded at 154.35, maintaining a short-term bearish bias as the spot price remains below the 9-day Simple Moving Average (SMA) of 155.02. Trading below this short-term trend indicator suggests that upside attempts will likely be limited amid weak momentum; the 14-day Relative Strength Index (RSI) hovers near 35.45, indicating weak demand without yet entering oversold territory. On the upside, immediate resistance lies at the 9-day SMA of 155.02. With no clear immediate support levels in the current data, market focus remains on whether sellers can sustain pressure below the 20-day Simple Moving Average (SMA) at 157.40; a decisive break and hold above this SMA would be required to alleviate the current bearish bias. On the downside, the 153.00 round-number mark and the 152.89 level (this week's low) stand out as the most critical psychological support levels. A confirmed break and sustained trading below this zone would signal a new leg lower, potentially leading to a test of support near 152.50 or even 152.00.
Consider shorting the USD at 154.50 today; Stop-loss: 154.70; Targets: 153.80, 153.60.
EUR/USD
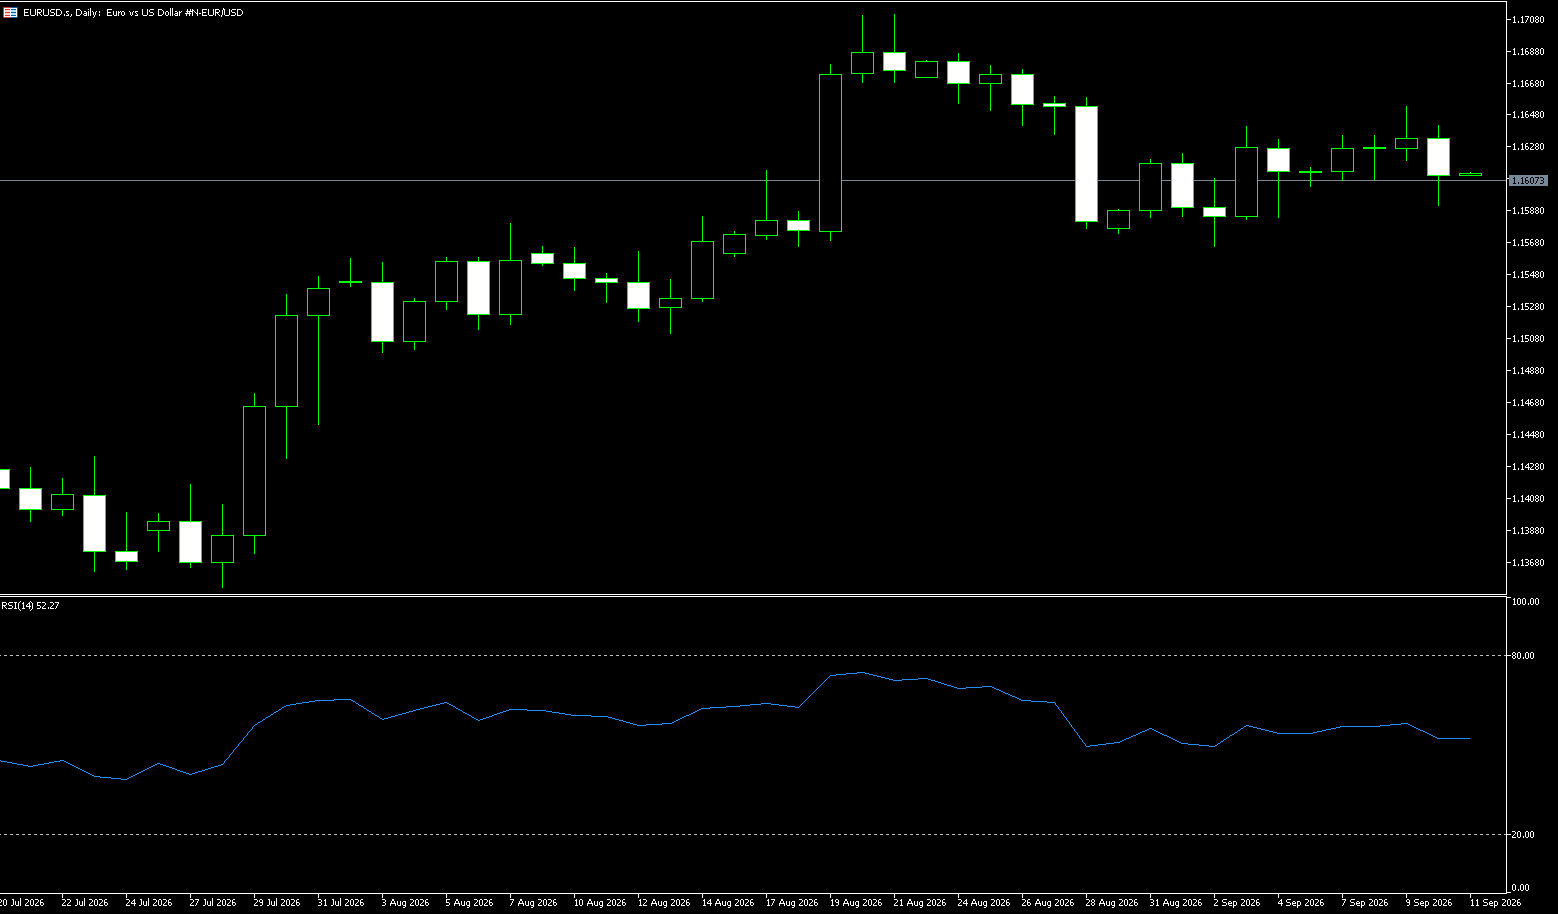
The EUR/USD exchange rate dipped to 1.1545—its lowest level since mid-August—as the US dollar remained strong ahead of the widely anticipated Federal Reserve rate hike on Wednesday. Rising oil prices, driven by escalating conflict in the Gulf region, further weighed on market sentiment. With inflationary pressures remaining high six months into the conflict involving the US, Israel, and Iran, oil prices have surged well beyond $100 per barrel; this has clouded the monetary policy outlook and triggered a sell-off in long-term government bonds. The European Central Bank (ECB) raised rates last week and hinted at further tightening, leading markets to price in at least one more hike this year. Attention now shifts to a busy week for central banks, featuring the Fed's decision on Wednesday, followed by the Bank of England on Thursday and the widely expected rate hike from the Bank of Japan on Friday. The Bank of England is expected to keep rates unchanged, though the vote could be a close call.
On the daily chart, EUR/USD retains a mildly bullish bias, as the spot price remains above the 50-day SMA at 1.1530 and finds support near the 1.1500 round-number level. The Relative Strength Index (RSI) stands at 48.93—slightly positive and showing no signs of overbought conditions—suggesting that as long as buyers hold the cluster of underlying moving averages, there remains room for further upside. On the upside, initial resistance appears at 1.1611 (aligned with the 9-day Simple Moving Average at 1.1607), followed by the level near last week's high of 1.1654. On the downside, initial support lies at the 50-day Simple Moving Average (1.1530), which coincides with the 1.1500 psychological level; a sustained break below this zone toward the 1.1400 mark would be required to undermine the current constructive tone and pave the way for a deeper pullback.
Consider going long on the EUR at 1.1538 today; Stop Loss: 1.1525; Targets: 1.1580, 1.1600.
Stock Analysis:
Australia ASX 200 Index
Market Overview:
The ASX 200 index edged up on Monday to close at 8,750 points, stabilizing after four sessions of weakness. Gains were led by consumer goods, business services, and retail trade, though these were capped by losses in healthcare, non-energy minerals, and manufacturing. Bargain hunters stepped in after the market neared a two-month low, although overall sentiment remained cautious due to falling US stock futures and a surge in oil prices following fresh Houthi attacks on Saudi Arabia and Iranian strikes on Gulf shipping. Traders are also bracing for the US Federal Reserve's policy meeting later this week and the release of China's August economic activity data on Tuesday.
Northern Star Resources (+2.5%), CSL Limited (+2.7%), and Aristocrat Leisure (+0.9%) all posted gains. Three of the "Big Four" banks also rose. Conversely, heavyweights BHP (-0.5%) and Rio Tinto (-0.1%) retreated as iron ore and copper prices softened. Mineral Resources (-4.4%), Evolution Mining (-3.2%), and Lynas Rare Earths (-2.8%) were among the notable decliners.
Sector Performance:
Top-performing sectors: Healthcare +1.52% (driven largely by CSL), Consumer Staples, Financials (banks), and Energy (Santos strengthened due to rising oil prices); capital favored defensive sectors.
Worst-performing sectors: Information Technology -1.14% and Materials -0.55% (BHP and Rio Tinto weakened in line with iron ore and copper prices); Industrials also weakened.
Clear sector divergence: Capital rotated out of cyclical and technology stocks into defensive assets, reflecting risk-averse sentiment and caution ahead of this week's Federal Reserve meeting. Technical Analysis:
After four consecutive days of decline, the index closed the start of the week at 8749.9 (+0.10%), with an intraday range of 8733–8768. It formed a stabilizing "Doji" pattern: Monday saw a small bullish Doji candle, signaling a halt to the decline and stabilization at low levels; intraday volatility narrowed as the battle between bulls and bears intensified. "Bottom-fishing" buying emerged as the index retested lows seen over the past two months, yet upward momentum remained insufficient. Closing near the midpoint of the day's range, the market is undergoing a consolidation phase following the drop, rather than a reversal. Regarding moving averages and indicators, the index remains below short-term moving averages, with the 5-day moving average acting as immediate resistance. The RSI hovers around 45—having moved out of oversold territory but not yet entering a strong bullish zone—while the MACD green histogram is narrowing, indicating a marginal weakening of bearish momentum, though a bullish crossover has not yet occurred.
Technical Outlook for Tuesday; Base Case (Highest Probability): Range-bound consolidation; trading range 8716–8767. Overnight performance of overseas futures and China's August economic data will be the primary drivers at the open. If data is neutral, the index will continue to consolidate near Monday's lows; if China's data is weak, the market may immediately test the 8716 support level in early trading; if data is strong, it may challenge the 8767 resistance level. Bullish Scenario: Establishing a firm position above 8767 on increased volume would open the way to 8785–8802. Conditions: China's economic data exceeds expectations, a rebound in commodities, and a recovery in US stock futures; however, given the strong resistance from moving averages, the probability of a sharp rally is low—this would be a rebound rather than a trend reversal. Bearish Scenario: A decisive break and close below 8716 would lead to a re-test of the lows, with the next target at 8699; if 8699 fails to hold, the current correction would extend, opening up further downside potential. Trigger conditions: China's economic data falls short of expectations, continued declines in iron ore/copper prices, and rising expectations of a hawkish Federal Reserve stance. Technical Assessment: A consolidation and bottom-building phase following a decline; 8767 serves as the critical dividing line between bulls and bears. If it holds above this level, the short-term outlook turns bullish; if it falls below 8716, it will continue to test lower levels.
Trading Strategy (Short-term Perspective)
Suitable for intraday or 1–3 day swing trades
Bullish Strategy
• If the price stabilizes in the 8716–8725 range and forms a reversal candlestick (indicating a halt in the decline), initiate a small long position; place the stop-loss below 8695.
• Targets: First target at 8767; if broken, look toward 8785–8802. Scale out positions at resistance levels; do not overstay the trade.
• Constraints: Do not chase highs; a push to 8767 on low volume is likely a false breakout—do not chase long positions in this scenario.
Bearish Strategy
• If the price faces resistance upon rebounding to 8760–8767 and shows a "spike and retreat" pattern, initiate a small short position; place the stop-loss above 8790.
• Targets: 8733; if broken, look toward 8716. If 8716 breaks, hold the position until exiting near 8699.
Key Risk Warnings:
Macro Risks: China's August economic data (due Tuesday) will directly impact the resources sector of the Australian market (e.g., BHP, RIO). The Federal Reserve's policy meeting this week poses risks; hawkish signals could drive up US Treasury yields, suppress global risk assets, and weigh on the ASX 200. RBA officials continue to voice inflation concerns and fuel rate-hike expectations, putting pressure on stock market valuations.
Commodity Risks: Fluctuations in iron ore and copper prices directly impact heavyweight mining stocks and are key drivers of ASX 200 volatility. Rising oil prices benefit the energy sector but also raise inflation expectations, creating a dual impact.
Sector-Specific Risks: The technology sector remains weak, and earnings expectations for resource stocks have been downgraded. Defensive sectors are providing short-term support but lack the momentum for sustained upward movement.
Japanese Stock Market Index (JP225)
Market Overview:
The Nikkei 225 index fell 0.81% on Monday to close at 63,493 points, hitting a six-week low and tracking a decline in U.S. stock index futures amidst growing concerns regarding safety risks associated with AI development. On Saturday, Anthropic CEO Dario Amodei called on AI companies to slow the development of their most advanced models due to safety issues. Investors also faced pressure from surging oil prices after Saudi Arabia shut down the key East-West Pipeline, which provides an alternative route bypassing the Strait of Hormuz. Rising energy costs fueled expectations for tighter monetary policy, with both the Federal Reserve and the Bank of Japan expected to raise interest rates this week.
Tech and AI-related stocks led the decline; Kioxia Holdings fell 6.4%, Advantest dropped 2%, and Taiyo Ink fell 5.4%. In corporate news, SoftBank Group plunged 10.7% after OpenAI CEO Sam Altman stated that the ChatGPT maker would not launch an initial public offering (IPO) this year.
Sector Performance:
Leading Sectors (Gainers)
Defensive sectors such as Services, Insurance, and Consumer Staples bucked the trend to close higher, as capital shifted from high-volatility growth sectors to low-volatility defensive assets. Additionally, month-end dividend-related capital entered the market to support low-priced blue-chip stocks, limiting further sell-offs during late trading.
Lagging Sectors (Losers)
Leading the decline were Information & Communication, Semiconductors, and AI-related heavyweights. SoftBank Group plummeted 10.72%, while Kioxia, Tokyo Electron, and Advantest suffered sharp drops; expectations of a slowdown in AI development triggered a concentrated sell-off in tech stocks, serving as the primary driver of the index's decline on Monday. Non-ferrous metals also weakened in tandem. Technical Analysis:
Nikkei 225 Index Monday Close: 63,492.99 (-0.81%); intraday range: 62,726–63,691. The index formed a bearish candle with a long lower shadow; it briefly dipped below the 63,000 mark during the session but recovered some losses toward the close due to bargain hunting. Monday Technical Review: The index closed with a bearish candle featuring a long lower shadow. It opened sharply lower due to negative news regarding OpenAI, hitting a low of 62,726, before buying interest at low levels drove a rebound to above 63,490 by the close. This pattern represents a "low-level resistance" candle following a sharp drop; while bearish momentum was released in the short term, the overall trend has not yet reversed. Following a decline last Friday, the correction continued into the start of this week, with heavy selling in AI and semiconductor heavyweight stocks dragging down the index. Moving Averages & Indicators: The index fell below the short-term 5-day moving average, turning the 5-day line into a level of short-term resistance. The RSI retreated to the lower end of the neutral range without yet entering oversold territory. The MACD green histogram expanded, indicating bearish dominance, though the long lower shadow suggests short-term bargain hunting.
Technical Outlook for Tuesday (September 15): Market Characteristics: A structural plunge rather than a broad market sell-off; heavy selling was concentrated in technology stocks, while traditional domestic demand sectors showed resilience.
Baseline Scenario for Tuesday (Highest Probability): Range-bound consolidation between 62,726 and 63,691. Overnight movements in the US Nasdaq, US Treasury yields, and the USD/JPY exchange rate will be the primary drivers at the open. Barring new negative external news, the index is expected to consolidate above the support level established by Monday's long lower shadow; the strength of any rebound will depend on whether sentiment in the technology sector recovers. With investors adopting a wait-and-see approach ahead of the Federal Reserve's "Super Week," a direct, sustained rally is unlikely. Optimistic Scenario: If the index stabilizes above 63,691 on increased volume, the rebound could target the 64,011–64,300 range. Trigger conditions: A recovery in US tech futures, continued depreciation of the Japanese Yen, and the market digesting negative sentiment regarding AI; characterized as a technical rebound rather than a trend reversal, with significant resistance from moving averages above. Bearish scenario: A decisive drop below 62,726 with a close beneath that level would open the door to a new leg down, targeting the 62,300 area. Trigger conditions: Continued sell-off in US tech stocks, rising US Treasury yields, and rapid appreciation of the Yen, compounded by the market having already priced in hawkish expectations for both the Federal Reserve and the Bank of Japan this week.
Trading Strategy:
Operational Strategy (Short-term perspective)
Bullish Approach
• If the price stabilizes in the 62,750–63,000 range and forms a reversal candlestick (indicating a halt to the decline), initiate a light long position; place the stop-loss below 62,600.
• Targets: First target at 63,691; if broken, look toward 64,011; scale out positions at resistance levels—do not chase highs.
• Constraints: Do not chase the price immediately at the open; low-volume rebounds indicate a weak recovery and carry a high risk of false breakouts.
Bearish Approach
• If the price faces resistance in the 63,600–63,691 range and forms a "spike and reverse" candlestick, initiate a light short position; place the stop-loss above 63,850.
• Targets: 63,000; if 63,000 fails to hold, maintain the position and look toward 62,726; if that level breaks, look toward 62,300.
Key Risk Warnings:
Macro "Super Week" Risks: Policy meetings for the Federal Reserve and the Bank of Japan are taking place this week; statements from these two central banks will directly determine the US-Japan interest rate spread and the Yen exchange rate. If the Bank of Japan signals a hawkish stance while expectations for a Fed rate hike rise, both factors will suppress Japanese stock valuations. Rapid Yen appreciation would hurt the earnings of major exporters like Toyota and drag down the index.
AI / Semiconductor Sector Risks: Monday's decline was driven by negative sentiment regarding AI expectations; sentiment in this sector is fragile. Volatility in US tech stocks overnight will directly impact Nikkei heavyweight stocks, making significant price gaps (gaps up or down) likely. Commodities and Oil Prices: High international oil prices are exacerbating expectations of imported inflation in Japan and increasing pressure on the Bank of Japan to tighten monetary policy.
Disclaimer: The information contained herein (1) is proprietary to BCR and/or its content providers; (2) may not be copied or distributed; (3) is not warranted to be accurate, complete or timely; and, (4) does not constitute advice or a recommendation by BCR or its content providers in respect of the investment in financial instruments. Neither BCR or its content providers are responsible for any damages or losses arising from any use of this information. Past performance is no guarantee of future results.
More Coverage



2026 © - All Rights Reserved by BCR Co Pty Ltd
Risk Disclosure:Derivatives are traded over-the-counter on margin, which means they carry a high level of risk and there is a possibility you could lose all of your investment. These products are not suitable for all investors. Please ensure you fully understand the risks and carefully consider your financial situation and trading experience before trading. Seek independent financial advice if necessary before opening an account with BCR.
BCR Co Pty Ltd (Company No. 1975046) is a company incorporated under the laws of the British Virgin Islands, with its registered office at Trident Chambers, Wickham’s Cay 1, Road Town, Tortola, British Virgin Islands, and is licensed and regulated by the British Virgin Islands Financial Services Commission under License No. SIBA/L/19/1122.
Open Bridge Limited (Company No. 16701394) is a company incorporated under the Companies Act 2006 and registered in England and Wales, with its registered address at Kemp House, 160 City Road, London, England, EC1V 2NX. Open Bridge Limited acts solely as a payment processor for BCR Co Pty Ltd and does not provide any financial, trading, or investment services on its behalf. Open Bridge Limited's role is limited to payment processing.


 English
 简体中文
简体中文
 繁體中文
繁體中文
 Bahasa
Melayu
Bahasa
Melayu
 Tiếng
Việt
Tiếng
Việt
 ไทย
ไทย
 日本語
日本語
 한국어
한국어
 ភាសាខ្មែរ
 español