0
The US Dollar Index
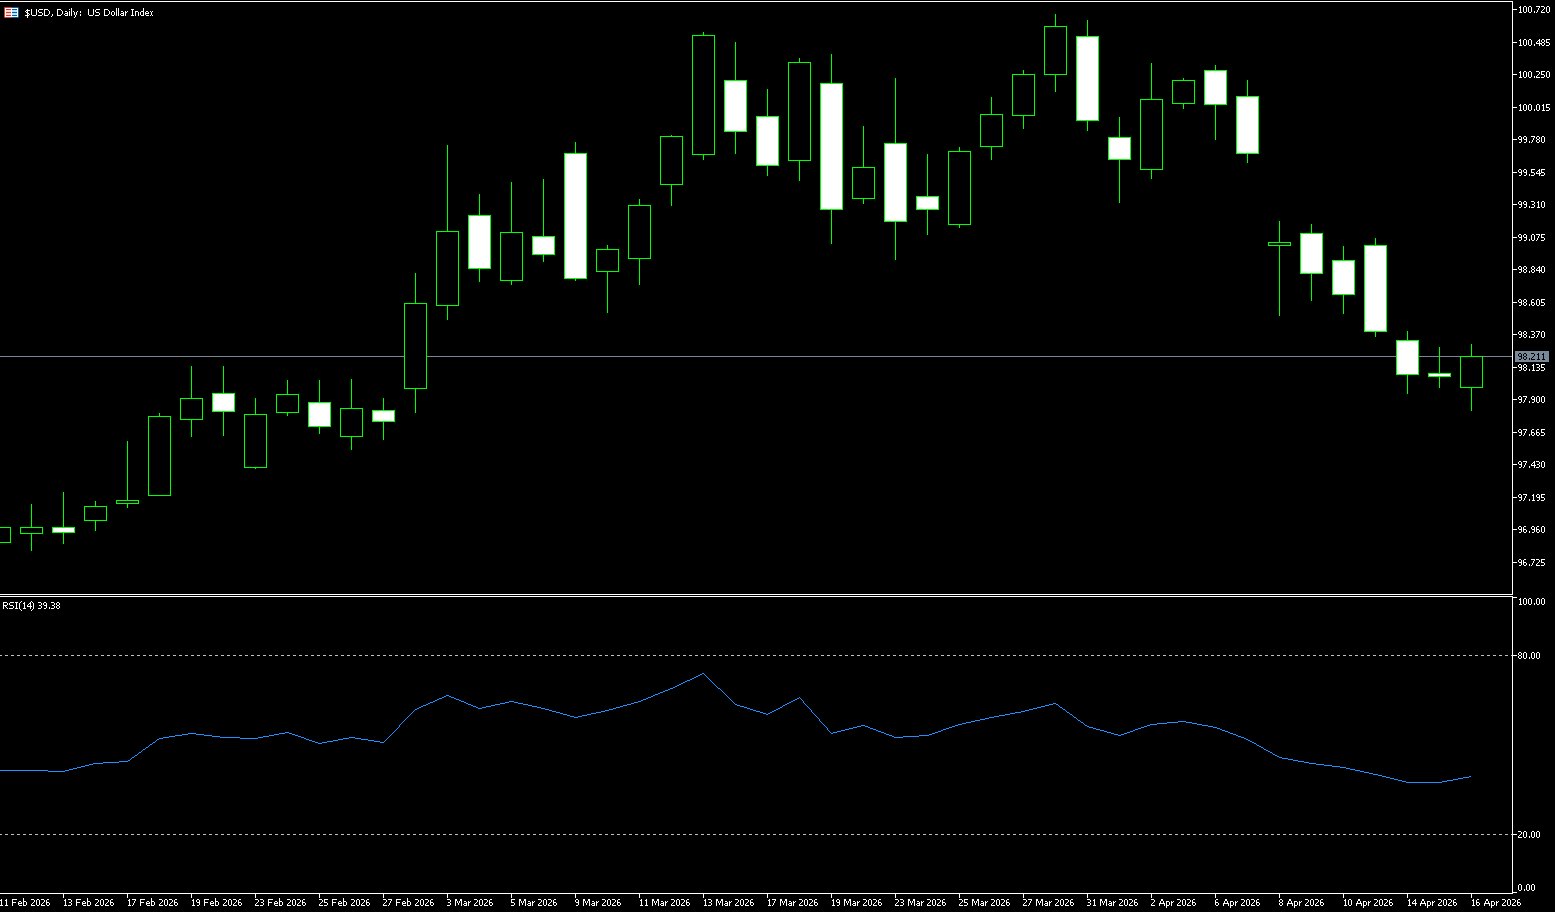
The US dollar index hovered around 98 on Thursday, near a six-week low, as rising expectations of a diplomatic breakthrough between the US and Iran reduced demand for safe-haven currencies. With oil prices continuing to decline and tensions in Iran easing, market inflationary pressures have significantly subsided, allowing the dollar index to stabilize mid-week after several days of losses, but it remains fragile near key support levels. The recent decline in the dollar is mainly driven by two core factors: waning market risk aversion and easing inflationary pressures. Typically, when market panic subsides, the dollar, as a traditional safe-haven currency, tends to weaken in tandem. Simultaneously, the same geopolitical easing news, coupled with adjustments in market demand expectations, led to a sharp drop in international oil prices; lower oil prices directly weakened upward inflationary momentum, further stripping away one of the key factors previously supporting the dollar. Looking at the recent trading range, the dollar index has been between 96.49 and 100.64. Currently, the index is hovering near the 50% retracement level of this range, and this consolidation around a key level is a normal market reaction.
After several consecutive days of decline, market sentiment has become cautious regarding the US dollar index, with investors not yet showing a clear tendency to hold positions in either direction, resulting in a temporary balance of power between bulls and bears. The slight rebound mid-week is not a signal of a trend reversal, but rather a technical consolidation after several days of decline. Currently, the three core negative factors—low inflation, downward oil prices, and easing geopolitical risks—continue to exert their influence. Unless these three factors undergo a substantial reversal, the dollar will remain under pressure. From the daily chart, the main trend of the US dollar index remains downward. If it breaks below the March low of 97.77, it will signify a resumption of the downward trend to 97.35 (the low of February 23); conversely, if the bulls can push the index above the short-term resistance of 98.75 (the 9-day moving average), the short-term trend may turn upward towards the psychological level of 99.00.
Today, consider shorting the US Dollar Index at 98.30, with a stop-loss at 98.40 and targets at 97.90 and 97.80.
WTI Crude Oil
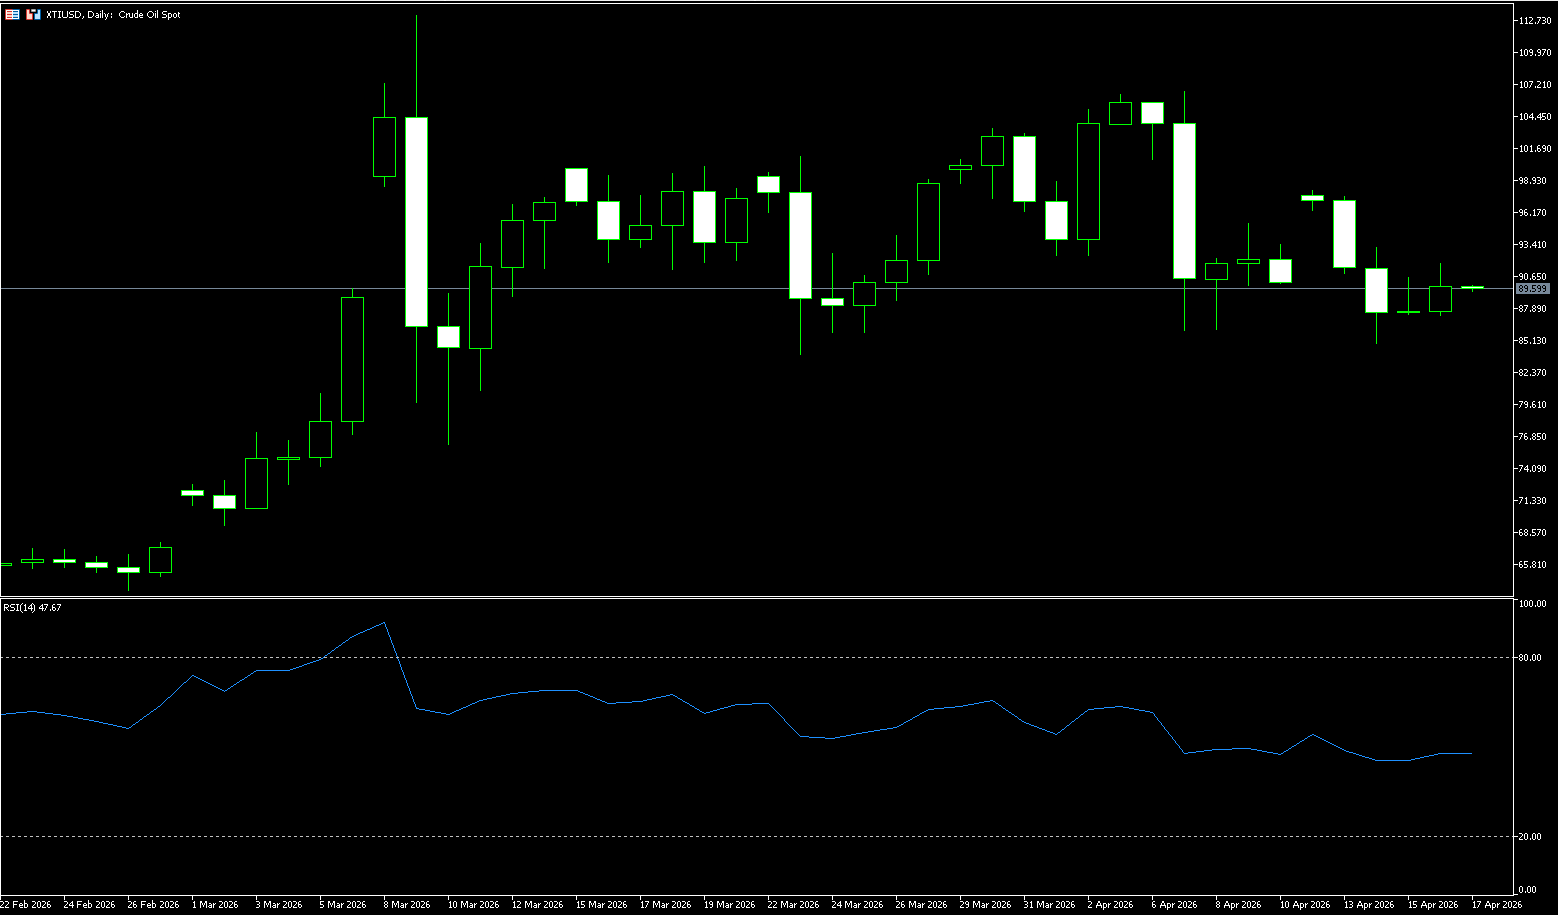
On Thursday, US crude oil traded at around $89.50 per barrel, after facing pressure earlier this week as investors assessed the possibility of an extension of the ceasefire between the US and Iran, while weighing the possibility of a broader agreement that could end the conflict and reopen the Strait of Hormuz. However, Trump's claim that the war against Iran could end soon, and the Iranian Foreign Ministry's hints of de-escalation, have led to cautious optimism in the market regarding a new round of negotiations. Despite President Trump's claim that the war against Iran could end soon, the actual situation remains complex. On one hand, the aftermath of Iran's blockade of the Strait of Hormuz continues to unfold; on the other hand, the US Treasury Department's announcement that it would not extend the waivers for purchasing Iranian and Russian oil has further tightened global heavy crude oil supply. Despite reports that Iran might consider allowing ships freedom of navigation in the Strait of Hormuz near Oman to prevent a renewed conflict, traffic volume has plummeted to a fraction of the pre-war 130+ daily crossings after the Iranian Revolutionary Guard announced a 45-day blockade of the strait, affecting approximately 20% of global crude oil and liquefied natural gas transport.
The current crude oil market is characterized by a combination of high geopolitical risk premiums and tight fundamentals. The full implementation of the Hormuz blockade and the increased US troop presence have significantly amplified concerns about supply disruptions, and the EIA report has provided data-driven confirmation of this concern. The surge in US crude oil exports is a direct response from the global market to Middle East risks. In the short term, WTI oil prices are expected to remain highly volatile in the $85-$100 range, remaining extremely sensitive to any sudden developments in the Middle East. Traders should pay close attention to the progress of the potential second round of US-Iran negotiations this week, the actual navigation situation in the Strait of Hormuz, possible Iranian retaliatory measures, and further confirmation from next week's EIA inventory report. On the upside, watch the $90.00 (psychological level) and the $94.20 (20-day simple moving average) area; on the downside, watch the $86.76 (40-day simple moving average) and the $85.00 (round number) level.
Consider going long on crude oil today at $89.40, with a stop loss at $89.25 and targets of $91.00 and $92.00.
Spot Gold
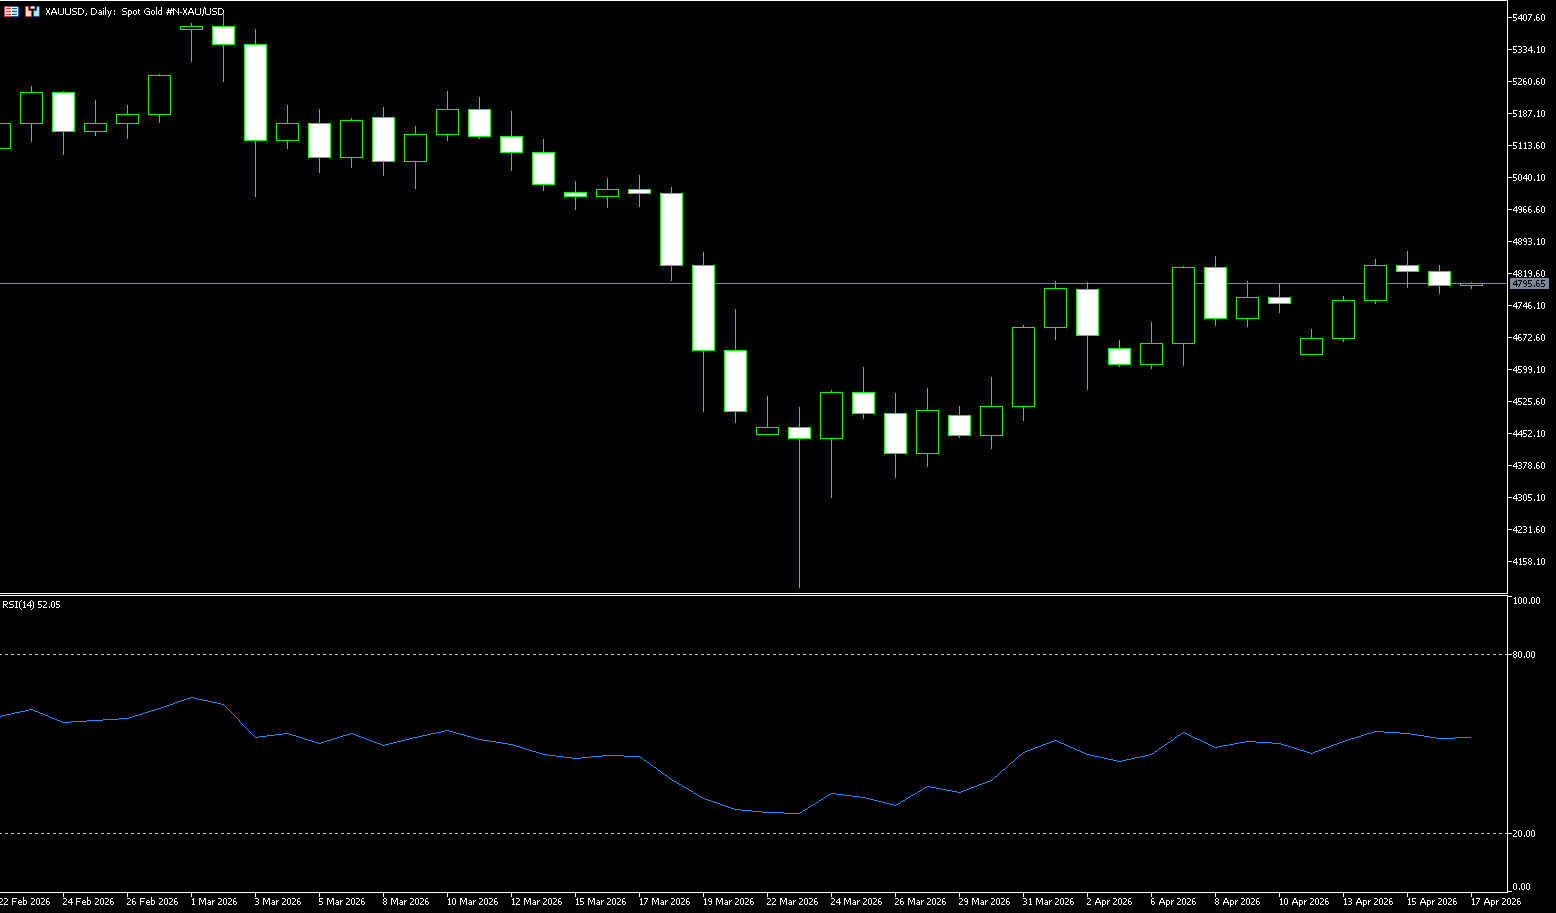
Spot gold touched a one-month high of $4,871 mid-week before falling sharply to close near $4,790, a drop of nearly 1%. Trump stated that the US-Iran war is "close to ending," and ceasefire negotiations are imminent, but the Strait of Hormuz remains blocked. Oil prices fluctuated at high levels, and Fed official Goolsby warned of persistent inflation, suggesting that interest rate cuts may be delayed until 2027. Gold's safe-haven appeal failed, traders focused on the opportunity cost of high interest rates, US stocks hit new highs, and gold entered a period of consolidation. Trump's optimistic remarks acted as a shot in the arm, but also instantly burst the safe-haven bubble surrounding gold. He explicitly stated that the joint military operation with Israel against Iran was nearing its end, while the Pakistani Army Chief of Staff rushed to Tehran to try to prevent the conflict from reigniting. This contradictory situation of "peace negotiations underway, military action continuing" has left gold investors in a dilemma. Traditionally, escalating geopolitical conflicts drive up demand for gold as a safe haven, but this time, gold prices saw profit-taking after Trump's "nearing the end" statement. Recently, gold has risen when risk appetite improves but fallen when risk aversion intensifies, completely contradicting its traditional safe-haven attributes. Traders are no longer truly focused on the simple risk of war, but rather on the long-term impact of tightening monetary policy and inflationary pressures.
In summary, this gold price correction is not a simple technical adjustment, but an inevitable result of the deep interplay between global macroeconomics and geopolitics. The window of opportunity for the US-Iran conflict to transition from "hot war" to "peace talks" has, while reducing extreme safe-haven premiums, also exposed the fragility of the energy supply chain and the stubbornness of inflation. The Fed's hints of a rate cut in 2027 have further strengthened expectations of a high-interest-rate environment, and gold's traditional protective aura—safe haven and inflation hedge—is undergoing an unprecedented test. Looking at the 4-hour chart, spot gold is maintaining a high-level range-bound movement, generally bullish but lacking upward momentum. Gold prices have repeatedly tested the 200-period simple moving average at $4,827, but have failed to hold, forming strong resistance in the near term. Short-term support is at the 20-period moving average at $4,777, with stronger support around the 50-period moving average at $4,747. The RSI indicator is around 60.55, in bullish territory but not overbought, and the MACD remains positive, indicating that the medium-term upward trend remains intact. Technical analysis suggests that if gold prices can hold above the 200-period simple moving average at $4,827, they are likely to open up upward potential, challenging the 50-day moving average at $4,898 and the psychological level of $5,000.
Today, consider going long on spot gold at $4,790, with a stop-loss at $4,785 and targets at $4,850 and $4,860.
AUD/USD
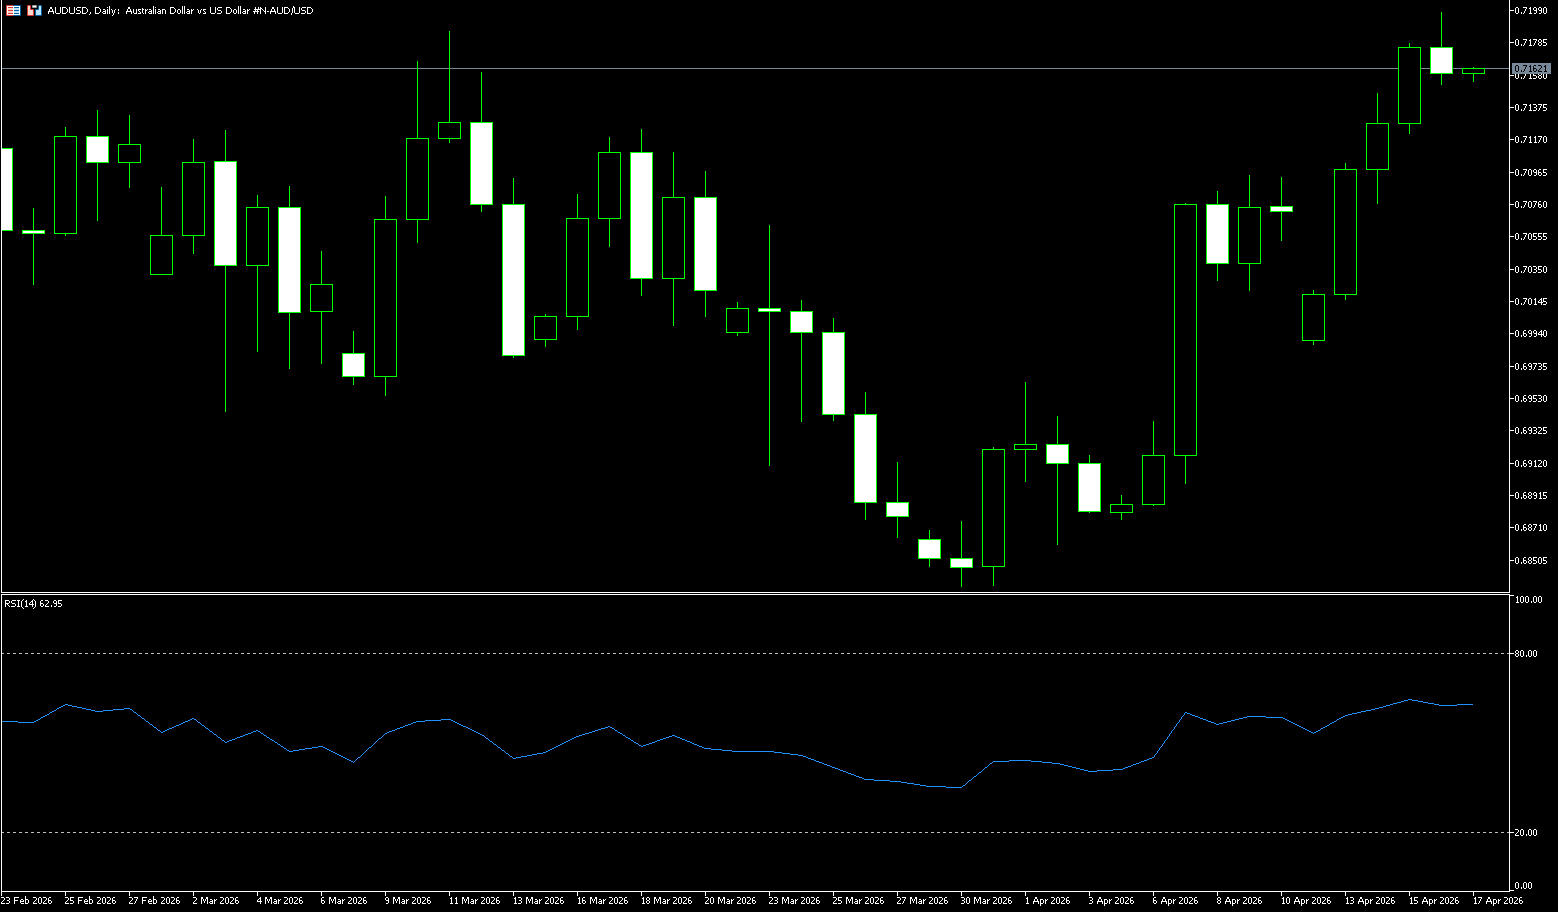
Following the release of Australian March labor force data, the pair continued to be under pressure. Australia's March unemployment rate remained at 4.3%, in line with market expectations. Furthermore, the change in employment in March fell to 17,900, lower than February's 48,900 and also lower than the market consensus of 20,000. Meanwhile, Australian consumer inflation expectations for April rose to 5.9% from 5.2% in March, a significant increase mainly reflecting the recent surge in oil prices. With improved market sentiment and expectations of a possible easing of the Middle East conflict, the Australian dollar has found support, and the downside potential for AUD/USD may be limited. The Australian dollar reached US$0.7180, its highest level in five weeks, as market hopes for a US-Iran peace deal rose, while investors weighed the latest comments from the Reserve Bank of Australia. Deputy Governor Andrew Hauser emphasized that inflation remains above the 2-3% target, and policymakers lack strong confidence that current interest rates are sufficient to restrain inflation. He noted that interest rates may need to rise further if necessary, especially as the economy absorbs the inflationary effects of high oil prices linked to the Middle East turmoil.
On the daily chart, the AUD/USD pair is at 0.7165, maintaining a short-term bullish bias, with the spot price holding above the 50-day simple moving average (around 0.7041) and the recent breakout point of the uptrend line (0.7043). The triple moving averages (50, 100, 200 simple moving averages) act as support, indicating that the decline has been absorbed, while the Relative Strength Index (RSI) (14) is around 66, showing solid but not extreme buying pressure, suggesting that the uptrend may continue as long as the exchange rate remains above the aforementioned support range. Initial support is located at the 50-day simple moving average at 0.7041. A sustained break below this area would weaken the structurally bullish pattern to 0.7000 (a psychological level). Resistance is first at the 0.7200 level, followed by higher structural resistance near 0.7283.
Consider going long on the Australian dollar today at 0.7150, with a stop-loss at 0.7140 and targets at 0.7190 and 0.7200.
GBP/USD
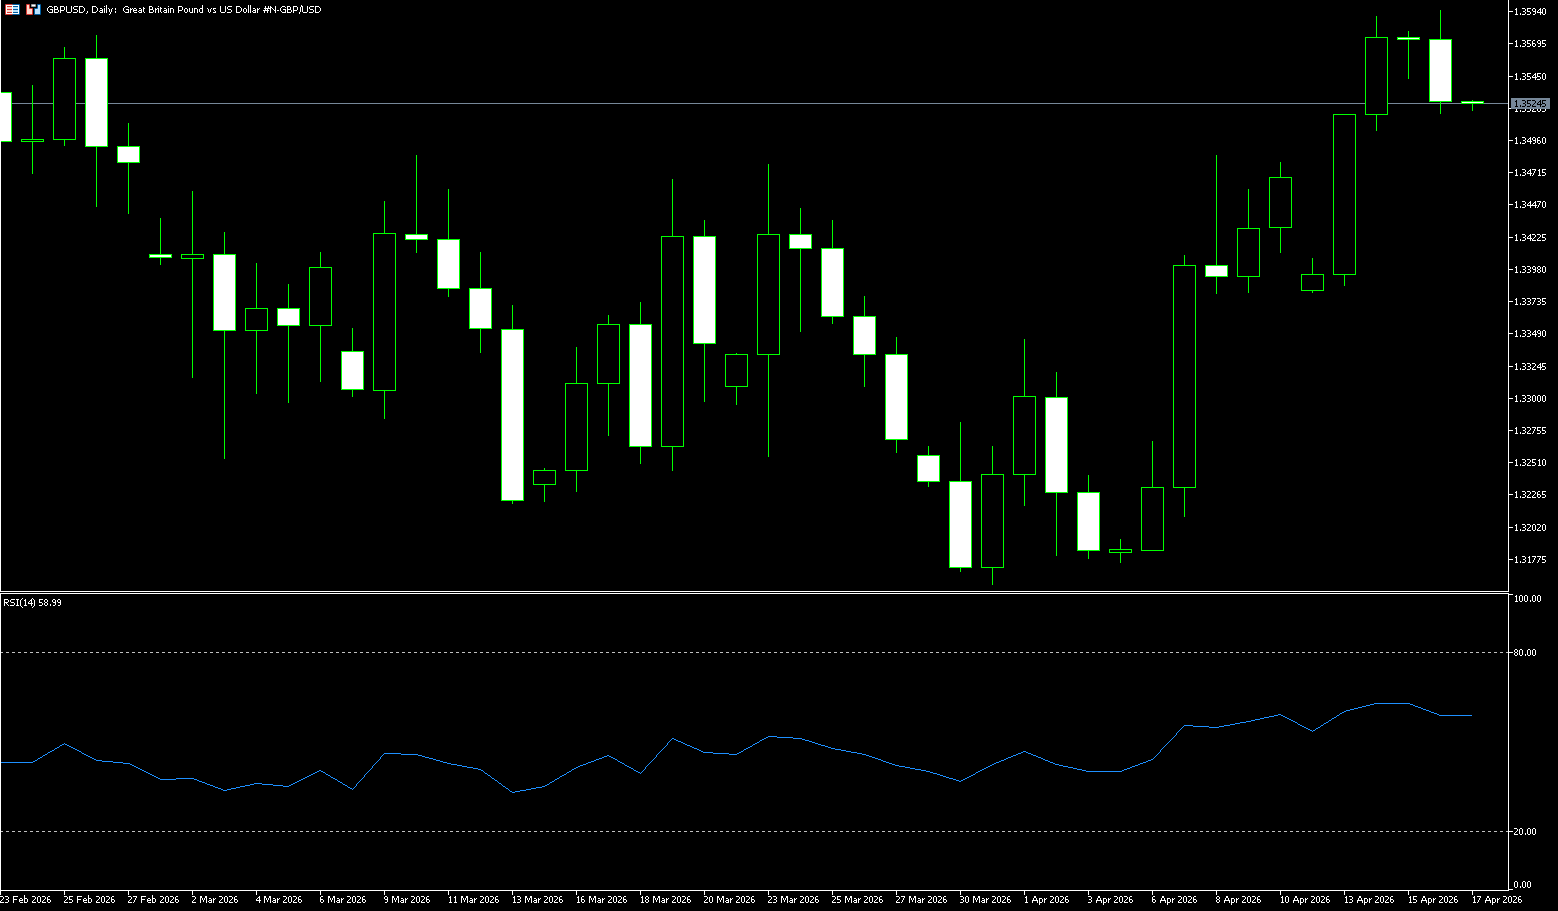
The pound/dollar pair rebounded after a slight decline the previous day, hovering around 1.3560 in Asian trading on Thursday. The pair rose as market sentiment improved, driven by expectations of a possible de-escalation of the Middle East conflict. US President Trump stated the war was "close to ending." Markets speculated that the ceasefire might be extended for two weeks, although Trump denied this was necessary, saying negotiations aimed at ending the conflict were underway. However, uncertainty remains after Washington revealed plans to send an additional 10,000 troops to the region. The continued closure of the Strait of Hormuz has maintained high energy prices and inflationary pressures, leading to market expectations that the Bank of England will raise interest rates twice this year. Investors are also focused on the meeting between UK Chancellor of the Exchequer Raeves and US Treasury Secretary Scott Bessant during the IMF-World Bank Spring Meetings in Washington.
The GBP/USD pair is currently in a correction phase after its recent rise, with a short-term rebound in the US dollar and a decline in UK yields jointly driving the pullback. In the short term, the pair may fluctuate around the 1.35-1.36 range, awaiting new fundamental drivers. The key to future price movements lies in changes in expectations for Federal Reserve policy and the path of UK inflation and interest rates. If the US dollar weakens again, the pair still has room to rise. From a technical perspective, on the daily chart, the GBP/USD pair maintains an upward trend, with prices continuously making new highs, and the overall bullish structure remains intact. However, the pair encountered significant pressure near the 1.3600 level, indicating strong resistance in that area. If this level is broken, a further test of the 1.3700 area is possible; however, the 1.3400-1.3450 range forms important support, and a break below this level could trigger a deeper correction.
Consider going long on GBP at 1.3525 today, with a stop loss at 1.3510 and targets at 1.3580 and 1.3590.
USD/JPY
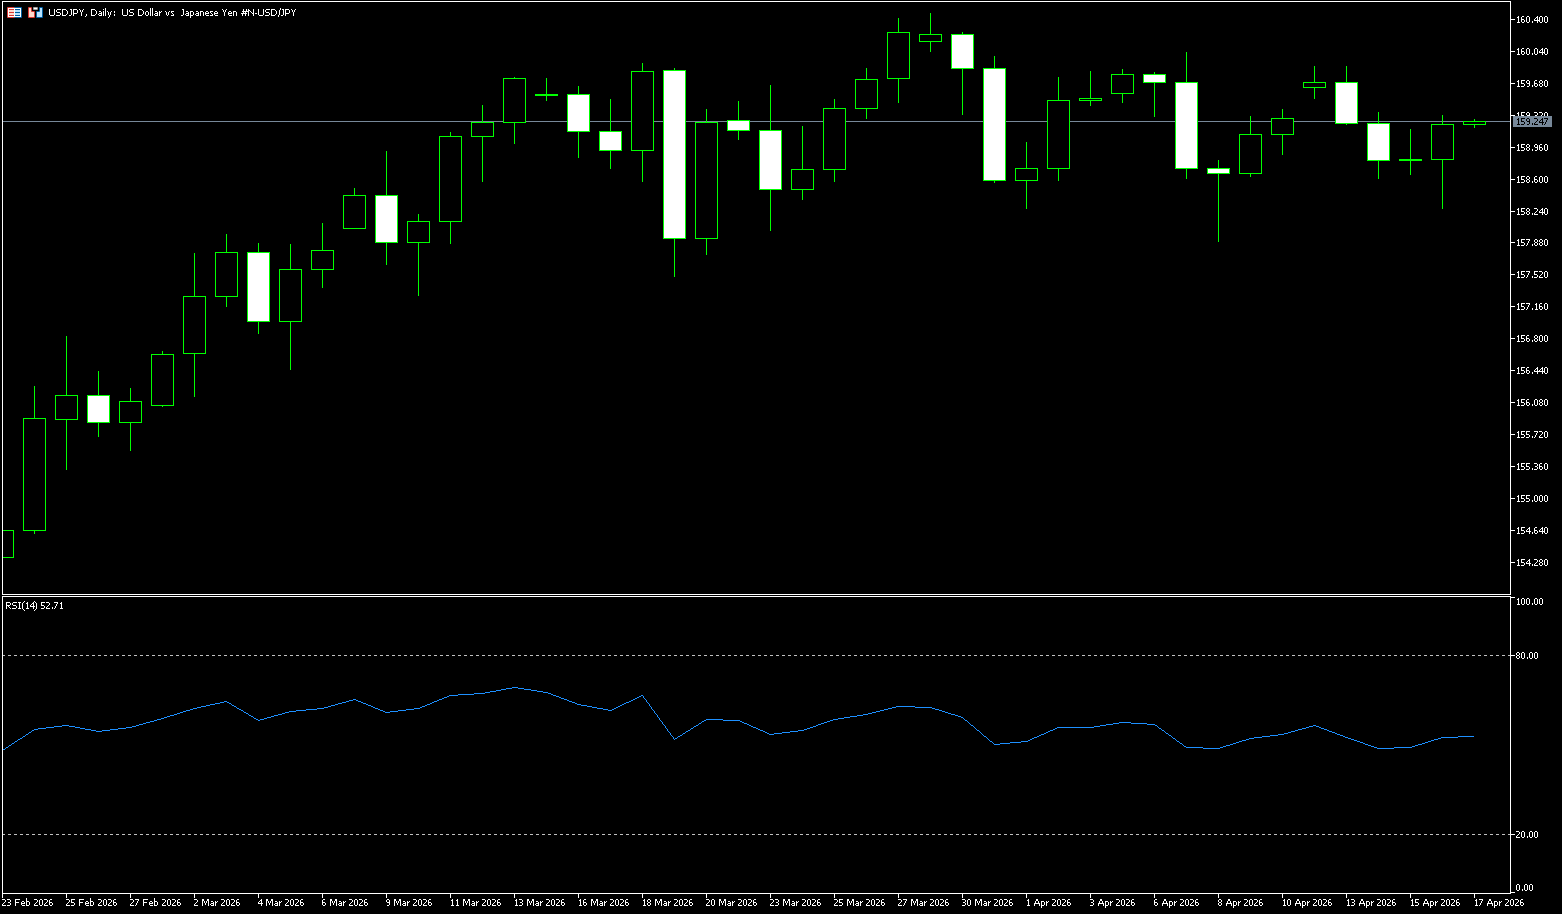
USD/JPY struggled to capitalize on the previous day's modest gains, encountering renewed supply pressure during Thursday's Asian session. The spot price fell to the 158.70-158.65 range in the last hour, near Tuesday's weekly low, influenced by a weaker dollar. The dollar index hovered near its lowest level since early March due to expectations of a lasting ceasefire between the US and Iran, supporting market optimism. In fact, US President Trump stated that the war with Iran was nearing its end. This news, coupled with optimistic expectations of continued US-Iran negotiations, weakened the dollar's status as the global reserve currency, putting downward pressure on USD/JPY. Meanwhile, expectations of diplomatic efforts to end the conflict kept crude oil prices near the three-week low hit on Tuesday. This helped ease inflation concerns and dampen hawkish expectations from the Federal Reserve, becoming another factor suppressing the dollar. On the other hand, the yen received some support due to market speculation that authorities would intervene to curb its currency's weakness, pushing USD/JPY down.
Last week, USD/JPY was generally in a technical pattern of high-level consolidation, weakening bullish momentum, and increased risk of a pullback. The weekly chart showed weak selling pressure, with a short-term bias towards a downward trend. However, the current USD/JPY movement exhibits typical multi-factor driven characteristics. The daily chart shows that USD/JPY found support and rebounded after pulling back below 158, and is still in a consolidation phase within a medium-term uptrend. The current price has rebounded above the 40-day moving average at 157.91 and the 158.00 (psychological level) area, indicating a recovery in bullish strength, but significant resistance remains at 159.20 (20-day moving average). A successful break above this level could lead to a further test of the 160.00 (psychological level). On the downside, the 40-day moving average at 157.91 and the area around the psychological level of 158.00 form key short-term support. A break below this level could lead to a retest of the 157.40 and 157.00 psychological levels.
Today, consider shorting the US dollar at 159.20, with a stop-loss at 159.40 and targets at 158.40 and 158.30.
EUR/USD
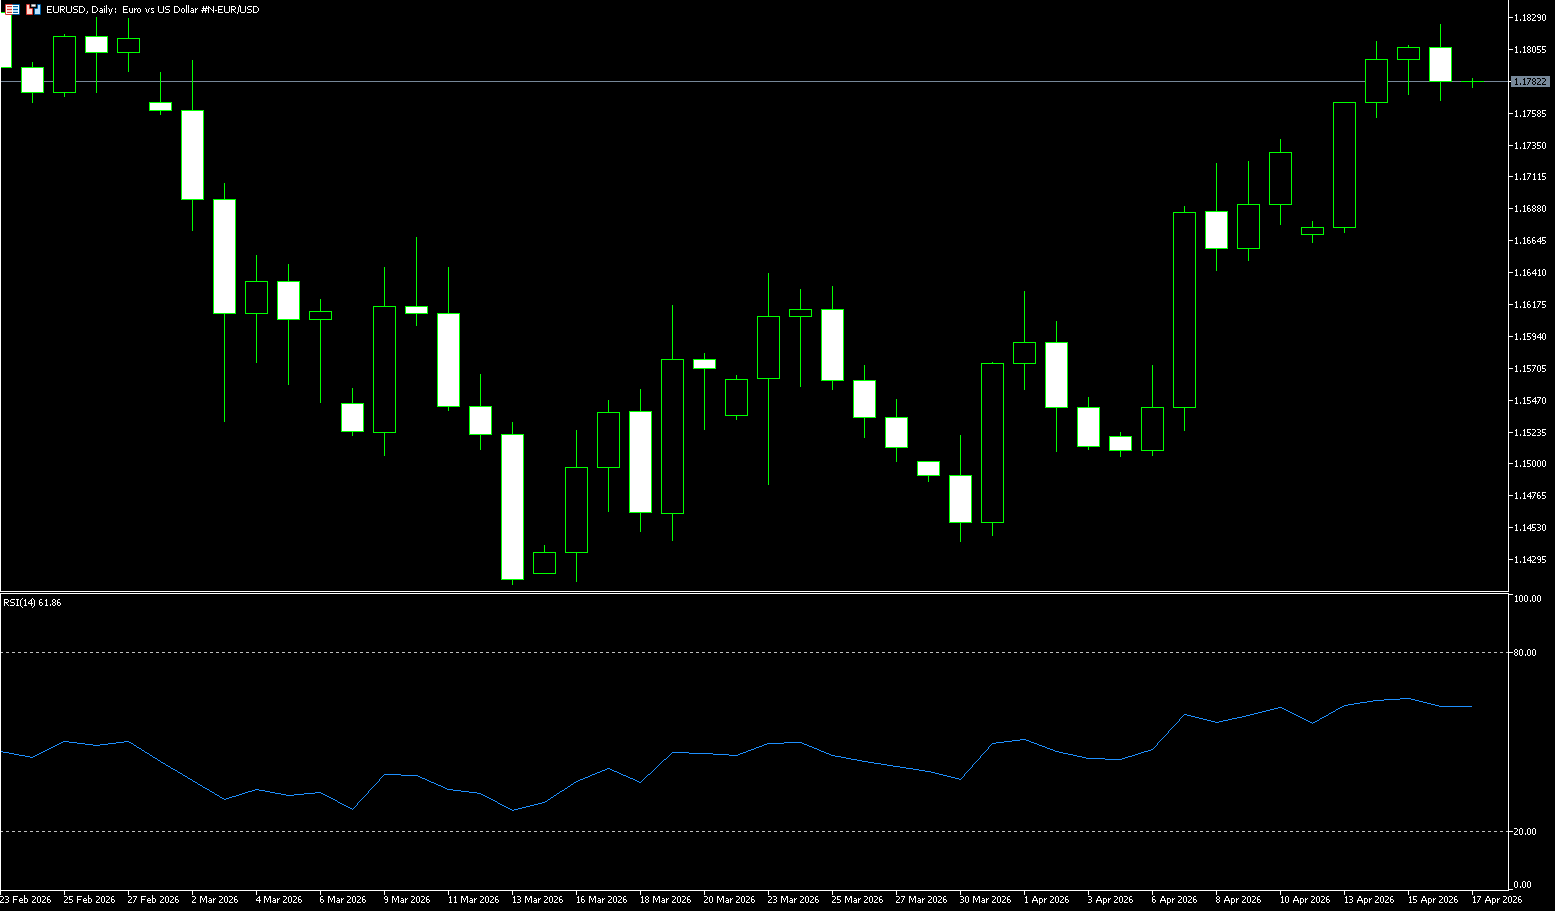
The euro/dollar pair traded positively near 1.1800 in early Asian trading on Thursday. The euro edged higher against the dollar, driven by risk appetite and optimism surrounding a potential ceasefire between the US and Iran. Traders bought risk assets like the euro amid hopes for a new round of negotiations. The Associated Press reported on Wednesday that despite tensions in the Strait of Hormuz, the US and Iran were close to extending the ceasefire and restarting negotiations on a long-term peace agreement. Signs of easing tensions in the Middle East boosted risk appetite, and falling oil prices helped alleviate inflation concerns; European Central Bank policymakers are inclined to keep interest rates unchanged at their April policy meeting. ECB President Christine Lagarde said this week that the central bank needs to remain "fully flexible" on interest rates, but emphasized that there is no inclination to raise rates. However, traders believe a rate hike is inevitable, expecting two 25-basis-point increases this year.
From a technical perspective, the four-hour chart shows a bullish trend for the euro against the dollar in the short term, as the price has clearly stabilized above key moving averages. The 20-period simple moving average (SMA) at 1.1765 provides the first layer of dynamic support, while the 50-period SMA clusters around 1.1686, at a lower level, suggesting a solid upward trend in fundamentals. Momentum indicators remain constructive, rising within positive territory, while the 14-period Relative Strength Index (RSI) hovers around 68, indicating that buying pressure persists even as the exchange rate climbs to new highs. On the daily chart, the euro/dollar pair is in a bullish trend, rising for the seventh consecutive day. Momentum indicators support further gains, while the RSI is at 65, significantly high, suggesting that buying pressure remains dominant for the time being. Immediate resistance is around 1.1830, the high reached at the end of February. A break above this level would target the next resistance at 1.1900. Initial support is seen where the 50-period SMA clusters around 1.1686, reinforcing a deeper support zone. If the current upward trend pauses or retraces, buyers are expected to reappear around the 1.1600 level.
Consider going long on the Euro today at 1.1772, with a stop-loss at 1.1760 and targets at 1.1820 and 1.1830.
Disclaimer: The information contained herein (1) is proprietary to BCR and/or its content providers; (2) may not be copied or distributed; (3) is not warranted to be accurate, complete or timely; and, (4) does not constitute advice or a recommendation by BCR or its content providers in respect of the investment in financial instruments. Neither BCR or its content providers are responsible for any damages or losses arising from any use of this information. Past performance is no guarantee of future results.
More Coverage


Risk Disclosure:Derivatives are traded over-the-counter on margin, which means they carry a high level of risk and there is a possibility you could lose all of your investment. These products are not suitable for all investors. Please ensure you fully understand the risks and carefully consider your financial situation and trading experience before trading. Seek independent financial advice if necessary before opening an account with BCR.
BCR Co Pty Ltd (Company No. 1975046) is a company incorporated under the laws of the British Virgin Islands, with its registered office at Trident Chambers, Wickham’s Cay 1, Road Town, Tortola, British Virgin Islands, and is licensed and regulated by the British Virgin Islands Financial Services Commission under License No. SIBA/L/19/1122.
Open Bridge Limited (Company No. 16701394) is a company incorporated under the Companies Act 2006 and registered in England and Wales, with its registered address at Kemp House, 160 City Road, London, City Road, London, England, EC1V 2NX. This entity acts solely as a payment processor and does not provide any trading or investment services.

 English
 简体中文
简体中文
 繁體中文
繁體中文
 Bahasa
Melayu
Bahasa
Melayu
 Tiếng
Việt
Tiếng
Việt
 ไทย
ไทย
 日本語
日本語
 한국어
한국어
 ភាសាខ្មែរ
 español