


0
Currency & Commodity Analysis:
US Dollar Index
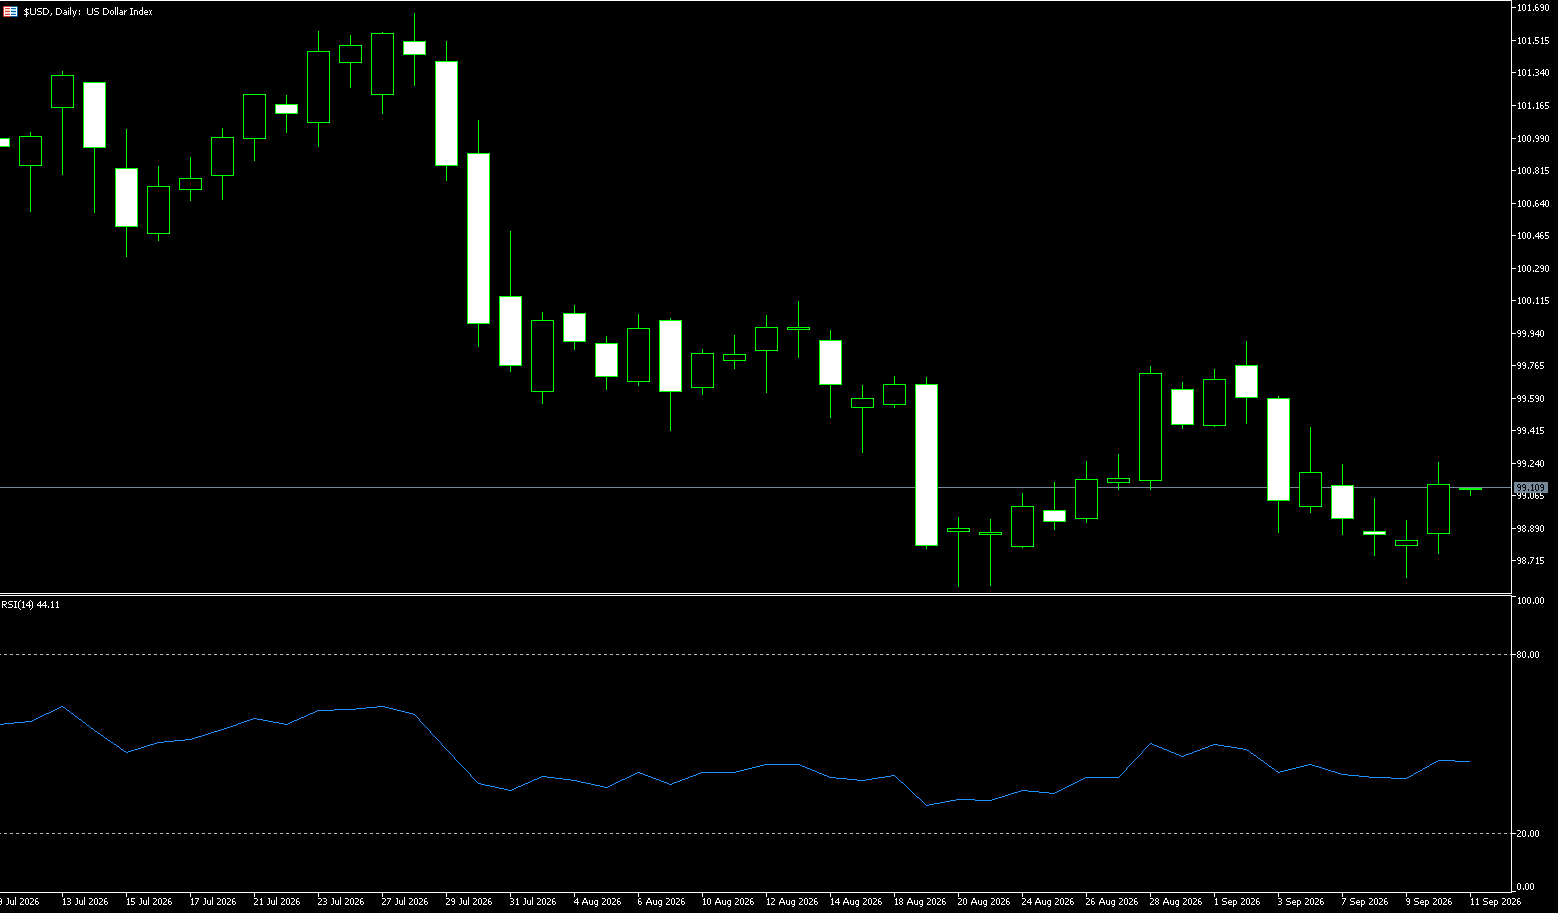
The US Dollar Index climbed above 101.30 on Tuesday, remaining near two-month highs, as rising oil prices bolstered expectations that the Federal Reserve would further tighten policy to curb inflation and increased safe-haven demand for the dollar. Oil prices rose after President Trump rejected Iran's latest proposal regarding the Strait of Hormuz, while Tehran stated it would not relax its conditions for reopening this vital waterway. Regarding monetary policy, several Fed officials noted last week that robust economic growth and a solid labor market could necessitate further rate hikes. Cleveland Fed President Beth Hammack indicated that these factors, combined with concerns over government debt, are driving up long-term Treasury yields. Investors are now awaiting the Fed's preferred inflation gauge and key US employment data due this week for further clues regarding the monetary policy outlook.
After rising for two consecutive weeks, the US dollar opened with a gap higher at the start of this week. This move was likely driven by the triggering of stop-loss orders during the Asian trading session. While some gains were pared back as European markets opened, the bullish trend remains intact. The US Dollar Index has returned to the summer high zone near the 101 level. This retest of the resistance level is occurring against a backdrop of ongoing market reassessment regarding the Federal Reserve's monetary policy outlook, driven primarily by persistent geopolitical tensions in the Middle East and Warsh's determination to curb inflation. A rebound in Brent crude oil prices has pushed the US dollar higher, while risk assets remain under pressure. Supported by US Treasury yields, there appear to be few obstacles to the dollar's continued rise. Consequently, in the short term, attention should be focused on the recent high near 101.40; a decisive break above this level could open the way for further gains toward 101.80 (the June 24 high) and the 102.00 psychological level. On the downside, the area near 100.81 (the 9-day moving average) is a key level to watch, followed by the 100.00 psychological mark and support from the 100-day moving average near 100.05.
Consider shorting the US Dollar Index today at 101.50; stop-loss: 101.60; targets: 101.10, 101.00.
WTI Spot Crude Oil
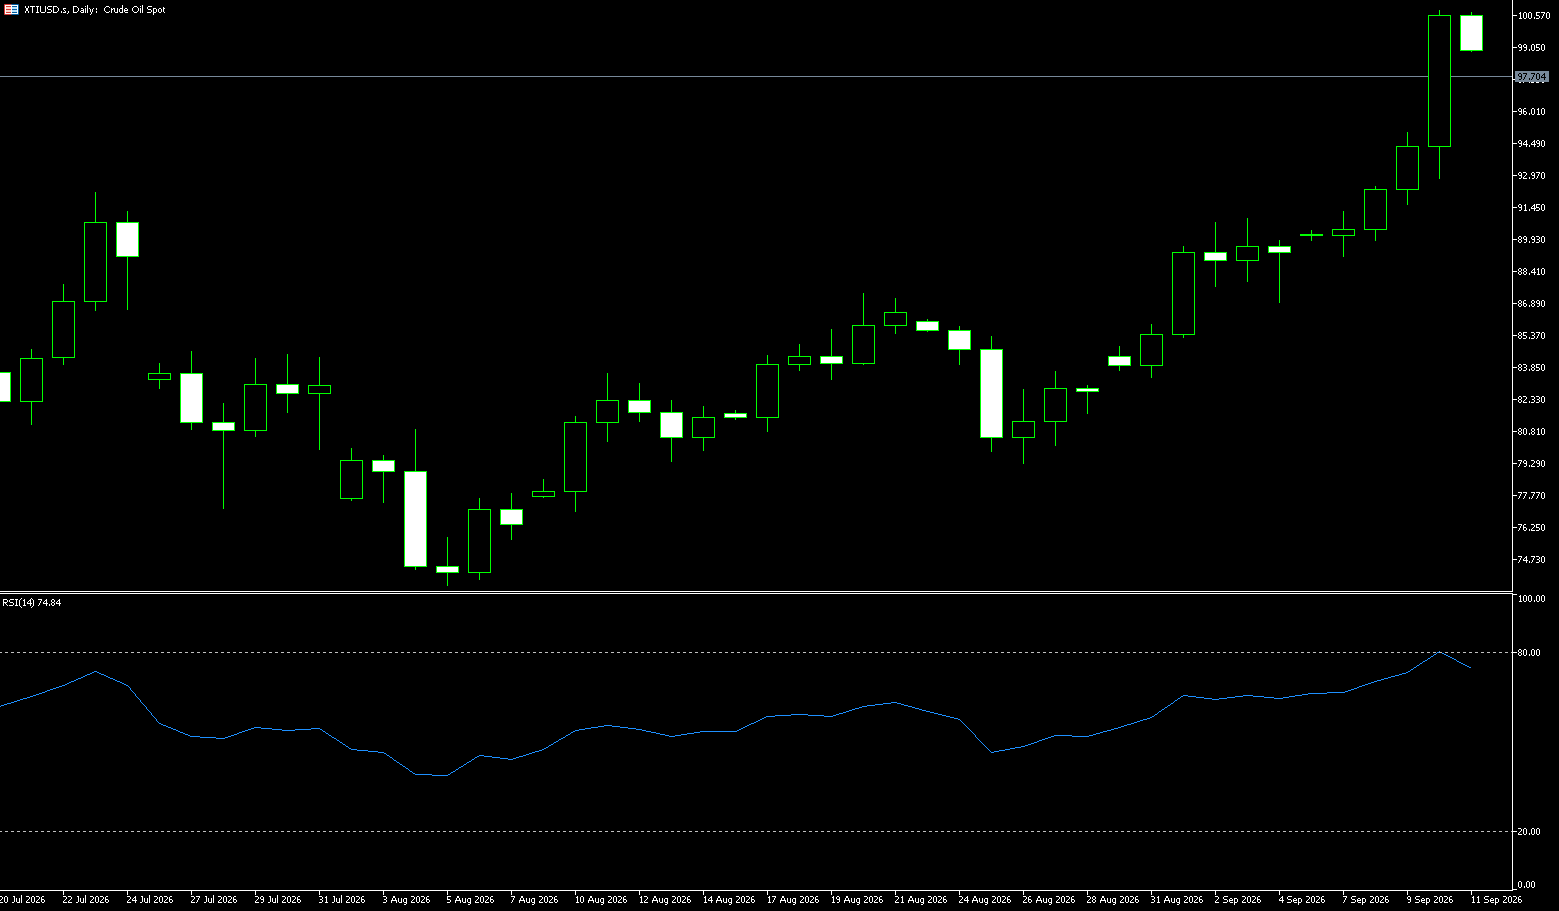
WTI crude oil prices fell to just below $88 per barrel on Tuesday after the US ordered another release from its emergency reserves and Saudi Arabia's crude exports began to recover. The US will supply up to 40 million barrels of crude from the Strategic Petroleum Reserve (SPR)—effectively a loan that companies must repay with interest. The Department of Energy stated that the plan would eventually return approximately 200 million barrels to the reserve next year, about 20% more than the amount released. The deadline for bids on the SPR release is October 6. Energy Secretary Wright indicated that another drawdown is unlikely. Once the latest release is completed, the SPR is expected to fall to its lowest level since 1982. Meanwhile, Saudi Arabia has increased flow through key pipelines, reportedly restoring about half of its capacity following drone attacks. Steady crude flows also appear to be continuing via vessels sailing covertly through the Strait of Hormuz. US and Iranian officials reportedly held separate indirect talks with mediators on Monday.
Going forward, key factors to watch include whether there is a substantive breakthrough in US-Iran communications, whether actual vessel traffic through the Strait of Hormuz recovers, and whether Saudi Arabia's alternative pipeline routes can further increase transport capacity. This will determine whether supply risks ultimately translate into actual price movements. From a daily chart perspective, WTI remains in a corrective phase but is holding above the $86.56 level (55-day moving average) and the $86.54 level (lower Bollinger Band), indicating that the medium-term bullish structure remains intact. Currently trading near $88, the price is gradually testing resistance at the psychological $90.00 mark. The 14-day RSI stands at approximately 50 with no clear oversold signal, suggesting that while the bulls retain some momentum, upward drive is not extreme. The high of $96.57 reached last week serves as a key level to watch for a breakout on the daily chart. If WTI can decisively clear this level, it could open the way for a move toward $90.00; conversely, repeated failures to break the $90 mark could see the price retreat toward the $86.56–$86.54 support zone.
Consider going long on crude oil at $87.45 today; stop-loss: $87.30; targets: $89.00, $90.00.
Spot Gold
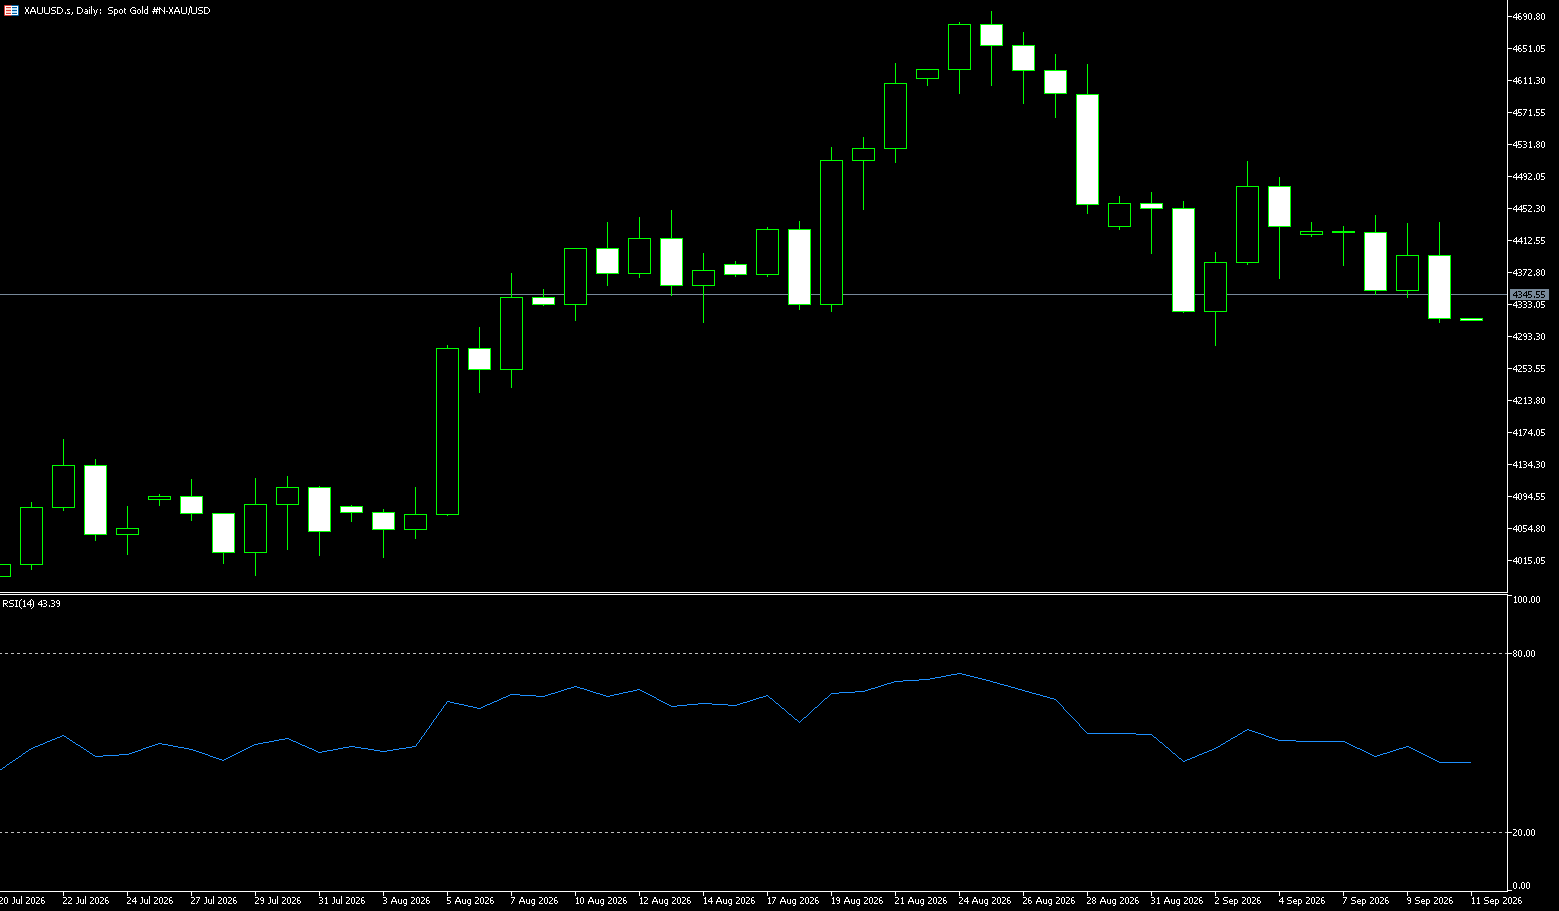
On Tuesday, gold prices climbed back above $4,180 per ounce after hitting a seven-week low in the previous session, as investors awaited fresh US economic data for clues regarding the Federal Reserve's interest rate outlook. Gold had plunged nearly 4% on Monday—reinforcing market expectations of potential Fed rate hikes—as surging crude oil prices fueled concerns over potential supply disruptions in the Middle East. Higher oil prices can exacerbate inflationary pressures, potentially prompting the central bank to keep borrowing costs elevated for longer, thereby weighing on non-yielding assets like gold. According to the CME FedWatch Tool, the market currently assigns a nearly 70% probability of a Fed rate hike in October and a 95% probability for December. Attention now shifts to Wednesday's ADP employment report, PCE inflation data, and comments from Federal Reserve officials for further signals regarding monetary policy.
Overall, gold prices have hit a seven-week low, driven by a combination of rising oil prices, inflation concerns, bets on Fed rate hikes, a strengthening US dollar, and surging Treasury yields. This "perfect storm" has temporarily neutralized gold's safe-haven appeal, shifting the market's primary focus from "geopolitical risk" to "expectations of monetary tightening." Momentum indicators on the 4-hour chart remain neutral-to-bearish, highlighting the fragility of current attempts at a rebound. The 14-period Relative Strength Index (RSI) is hovering below 26, while the MACD indicator is approaching the zero line. Bulls remain capped below the $4,200 round-number mark, with initial resistance found at the horizontal barrier in that same area. A confirmed break above these levels would temporarily alleviate downward pressure and shift market focus toward the $4,232 high (20-day moving average). On the downside, key support levels lie at $4,111 (Monday's low) and $4,100 (round number). A breach of these levels would target the psychological support of $4,000.
Consider going long on gold at $4,176 today; stop-loss at $4,170; targets: $4,220 and $4,230.
AUD/USD
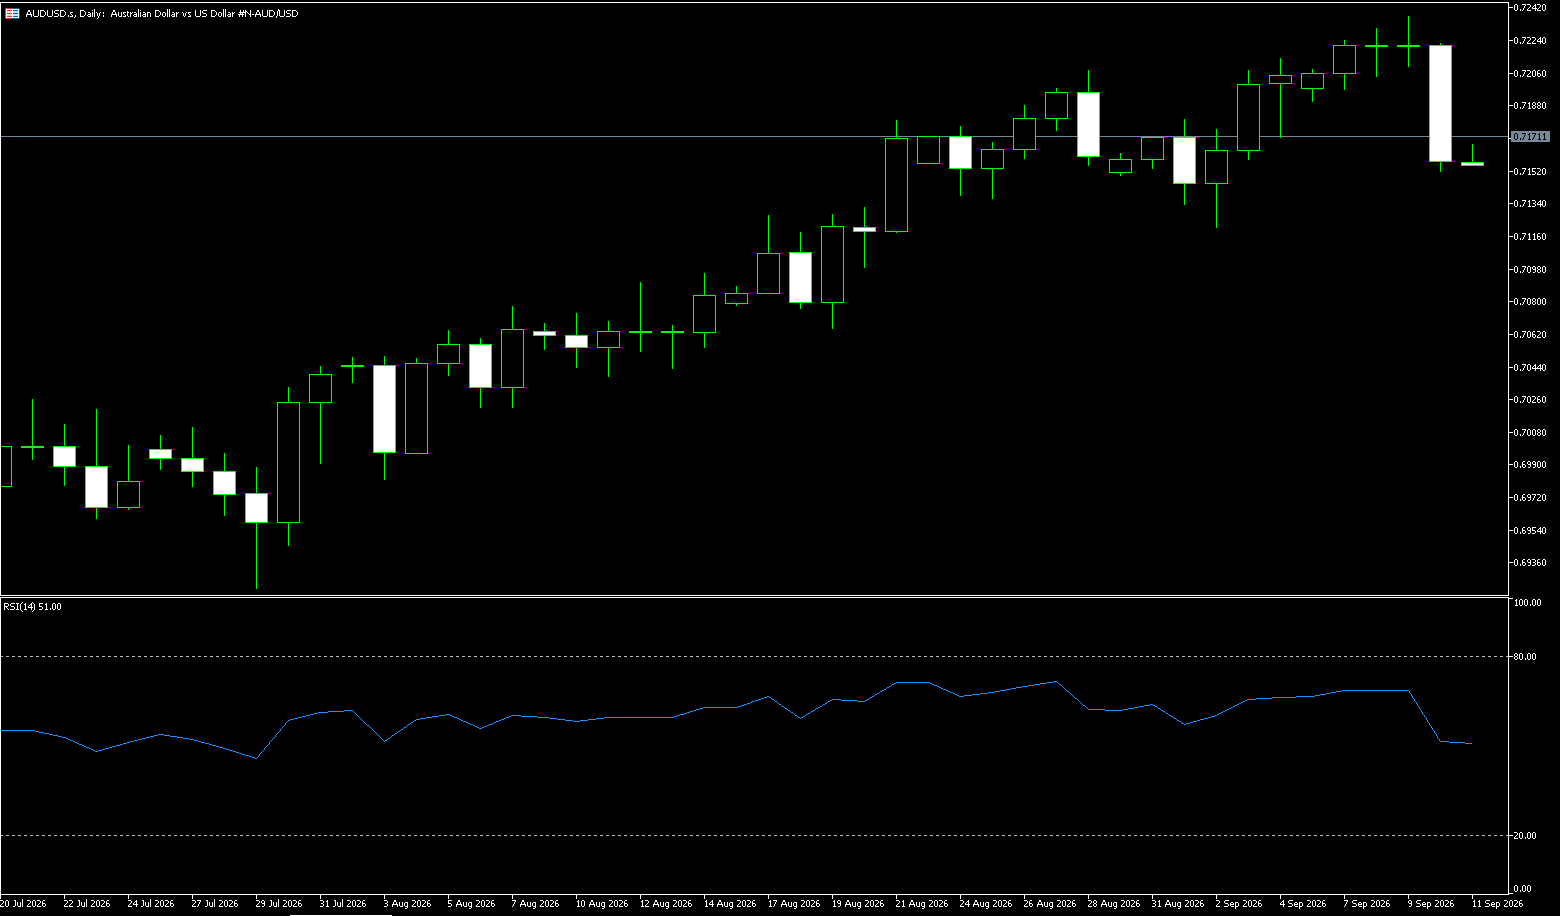
The AUD/USD pair reversed its brief gains and turned lower, falling to a nine-week low below 0.7000 during early European trading on Tuesday as traders digested cautious remarks made by Reserve Bank of Australia (RBA) Governor Michele Bullock at a press conference. Earlier, the RBA raised the cash rate to 4.60%—in line with broad market expectations—while leaving the door open for further hikes if necessary. This marks the fourth rate hike of 2026. Market consensus was nearly unanimous: a survey of 34 economists showed only one expecting rates to remain unchanged, all four major banks predicted a September hike, and money market pricing indicated a very high probability of a hike, estimated between approximately 80% and 95%. A 25-basis-point hike by the RBA today was virtually a foregone conclusion, representing the fourth rate increase of 2026. Sticky core inflation (with the July trimmed mean at 3.6%, exceeding the year-end forecast of 3.3%) and economic resilience have driven a significant shift in expectations over recent weeks. Attention is focused on the tone of the statement and potential voting splits: Commonwealth Bank anticipates a unanimous hawkish stance, while Westpac expects a split decision. The Australian dollar's reaction hinges on the statement's tone; ING expects a hawkish hike to support the currency but notes a near-term risk of it falling below 0.70 against the US dollar. Oil prices remain a key swing factor; if the pass-through from energy costs is viewed as persistent, the market will continue to price in a November rate hike.
Overall, this rate hike reinforces the Reserve Bank of Australia's (RBA) resolve to combat inflation, providing short-term support for the Australian dollar, though the global interest rate environment and geopolitical risks will continue to dictate medium-term exchange rate trends. However, gains in the AUD/USD pair have been capped as the US dollar benefits from safe-haven demand driven by the situation in the Middle East, causing the rate to pull back to just below 0.70. On the daily chart, AUD/USD is trading near 0.7000, maintaining a short-term bearish bias as it remains below the 55-day and 100-day simple moving averages (SMAs), located at 0.7084 and 0.7065, respectively. The price is currently hovering just above the lower Bollinger Band at 0.6979, which serves as immediate support; the Relative Strength Index (RSI) stands at 31.68, nearing oversold territory. To the upside, initial resistance is found at the 100-day SMA (0.7065) and 55-day SMA (0.7084)—which together form a zone of heavy resistance ahead of the 0.7100 level—while further upside is capped at 0.7122 (the 20-day SMA). On the downside, the lower Bollinger Band at 0.6979 provides immediate support, followed by the level at 0.6946 (July 30 low); a break below this would expose deeper support levels, such as the 0.6900 mark.
Consider going long on the AUD at 0.6980 today; stop-loss: 0.6970; targets: 0.7030, 0.7040.
GBP/USD
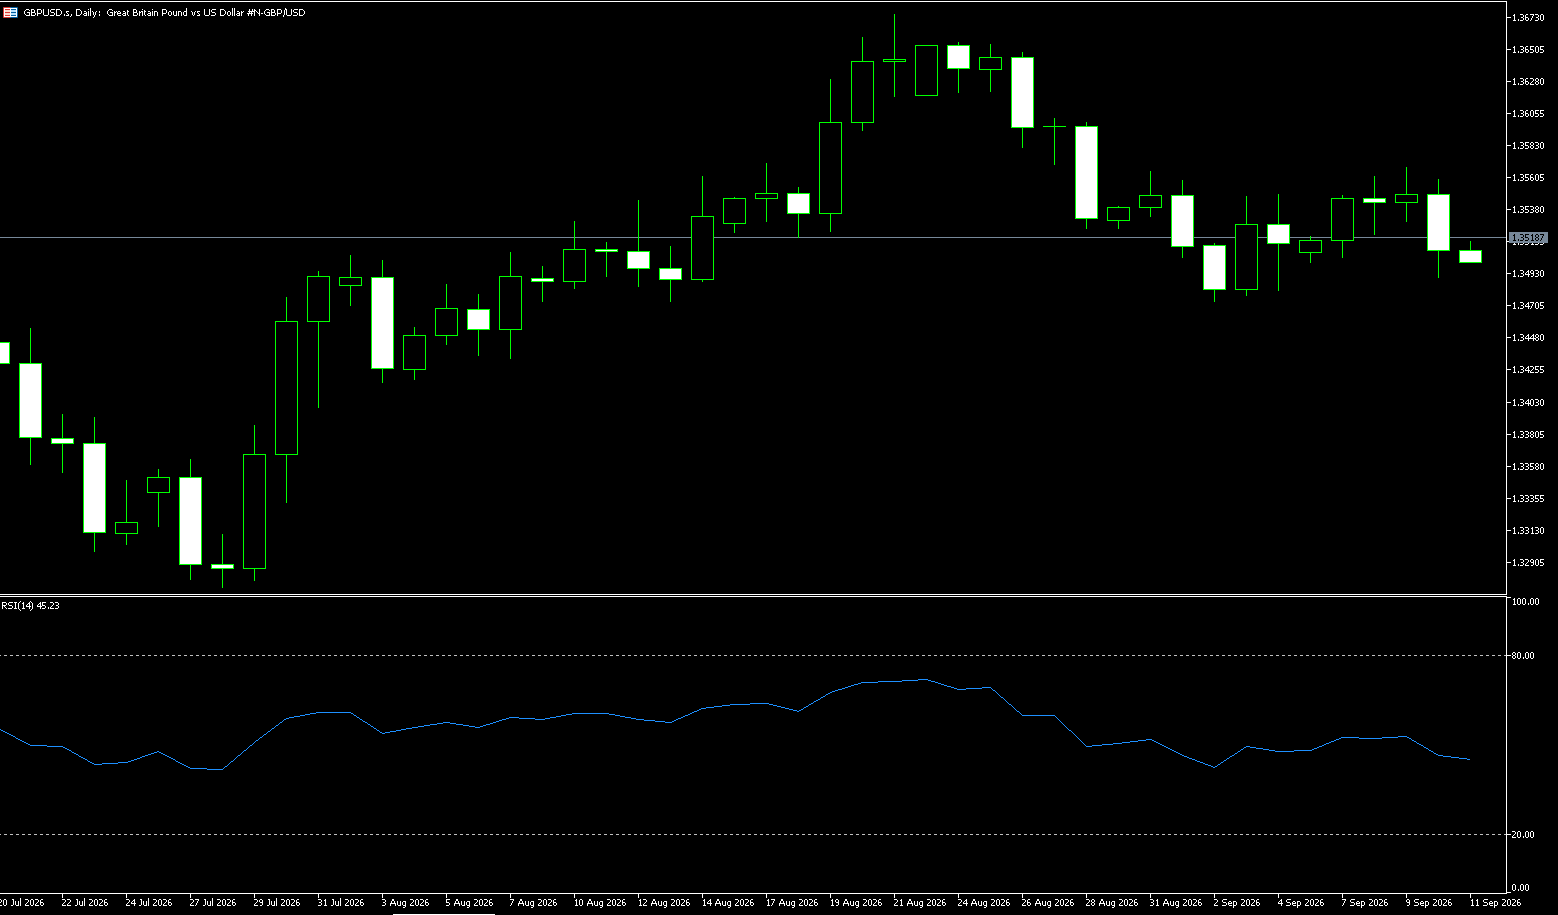
During Tuesday's Asian trading session, the GBP/USD pair fell towards the 1.3230 level. US Treasury yields remain near multi-decade highs above 5%, bolstering the US dollar against the British pound. Risks regarding energy supplies and robust US economic data have heightened inflation concerns, prompting traders to price in further Federal Reserve rate hikes. Additionally, rising long-term US Treasury yields are providing support to the dollar and acting as a headwind for this major currency pair. Currently, the US has rejected Iran's proposal, causing oil prices to surge and pushing US yields higher—a move that is broadly boosting the dollar. On the other hand, hawkish remarks from Bank of England policymakers could provide a short-term lift to the pound. Bank of England Deputy Governor Ramsden stated on Monday that an increase in the Bank Rate might be warranted if upward pressure on the inflation outlook continues to build.
On the daily chart, GBP/USD maintains a bearish short-term bias, as the spot price remains capped by the 9-day Simple Moving Average (SMA) at 1.3293 and the 100-day SMA at 1.3359. The price is trading near the lower half of the recent Bollinger Bands range, while the Relative Strength Index (RSI) sits around 29—hovering just below the oversold zone—suggesting that while downward pressure persists, the sell-off appears excessive rather than impulsive. To the upside, initial resistance lies in the zone between the 9-day SMA (1.3293) and the 14-day SMA (1.3359); only a daily close above this area would alleviate the current bearish tone and pave the way for a further rise towards the 100-day SMA near 1.3416. On the downside, the 1.3200 psychological level serves as the next support; a break below this level would reinforce the current bearish bias and drive the pair lower towards the June 24 low near 1.3140.
Consider going long on GBP at 1.3220 today; stop-loss: 1.3210; targets: 1.3270, 1.3280.
USD/JPY
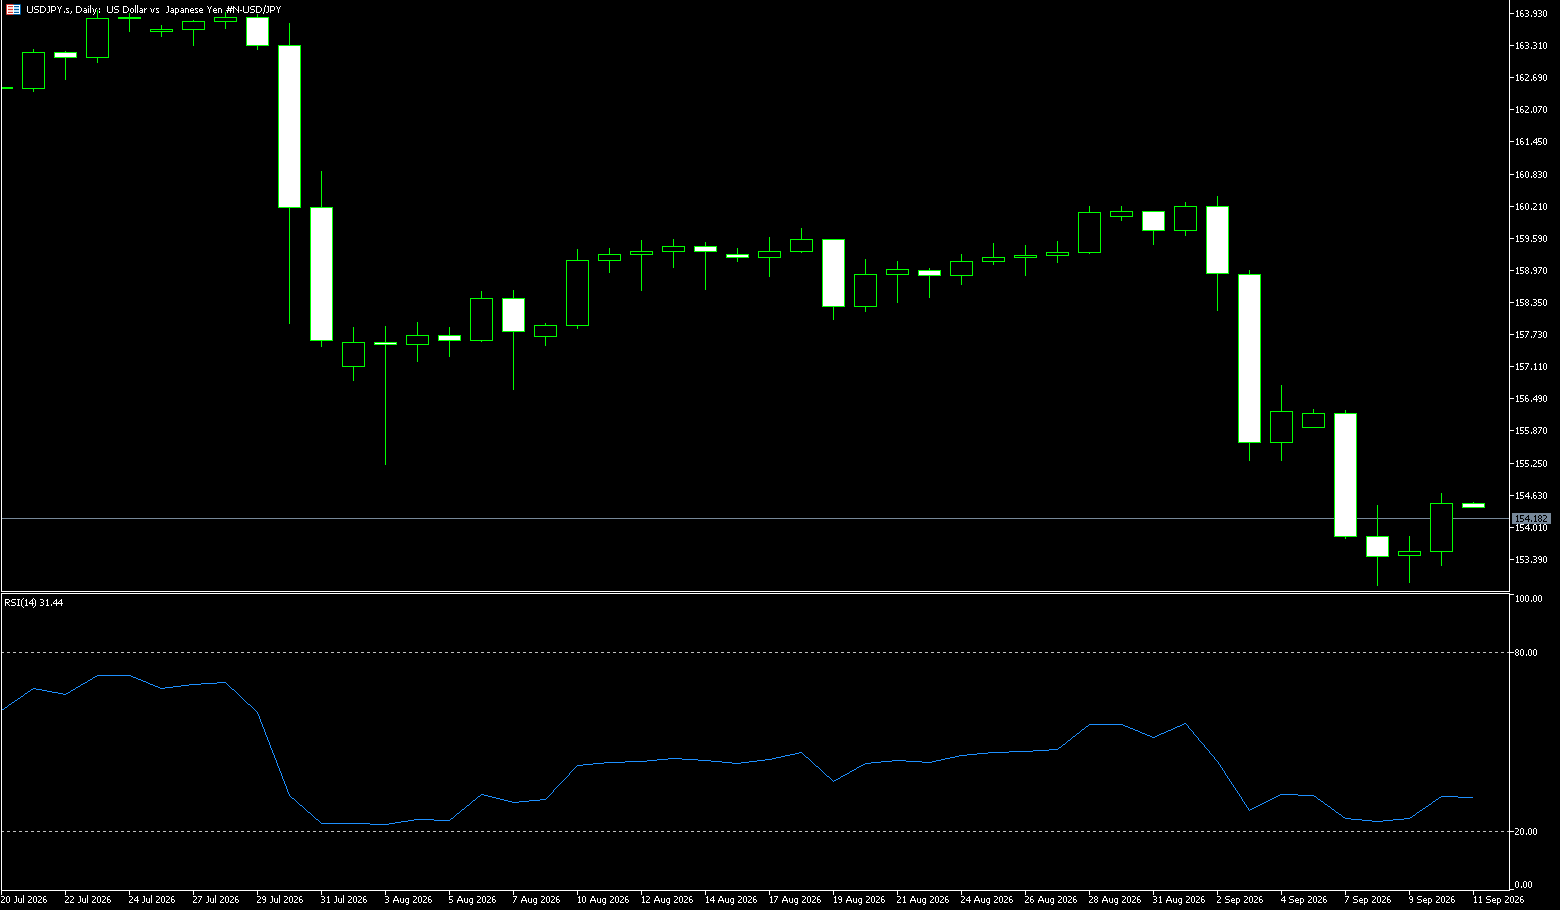
The USD/JPY pair held steady around 157.30 on Tuesday, maintaining recent gains as fresh verbal warnings from Tokyo provided support for the currency. On Monday, Japan's top currency official, Atsushi Mimura, stated that the Prime Minister and Finance Minister—alongside the U.S.—had conveyed a "very clear" message regarding currency depreciation. Last week, Finance Minister Satsuki Katayama indicated during a meeting with Prime Minister Sanae Takaichi that President Trump had expressed concerns about the yen. Katayama also spoke by phone with U.S. Treasury Secretary Scott Bessent on Friday evening, reiterating their view that the yen is undervalued and agreeing to further strengthen cooperation between Japan and the U.S. Regarding monetary policy, a former Bank of Japan official stated on Monday that the central bank might raise its benchmark interest rate for the second consecutive month in October, citing rising inflation risks.
Overall, the verbal warning issued by Mimura has triggered a short-term rebound for the yen, though the underlying factors keeping the yen under pressure in the medium to long term have not fully disappeared. Investors now need to assess whether a new round of foreign exchange intervention will be triggered. Upward momentum for USD/JPY has clearly faded, with the initiative shifting to the yen. Meanwhile, an ominous technical pattern known as a "death cross" is forming and is highly likely to be officially confirmed early next week. This suggests that the previous rapid upward trend in USD/JPY may have reversed. Consequently, attention should be paid to the 157.00 round-number level; a break below this would point toward the 20-day moving average at 156.17. On the upside, immediate resistance lies at the 158.00 round-number level, which serves as the primary hurdle for any attempted rebound. The next levels to watch are the 50-day moving average at 158.40 and the 159.05 area (last Thursday's high); sustained trading above these levels would further reinforce the bullish tone.
Consider shorting the USD at 157.45 today; stop-loss: 157.60; targets: 156.70, 156.60.
EUR/USD
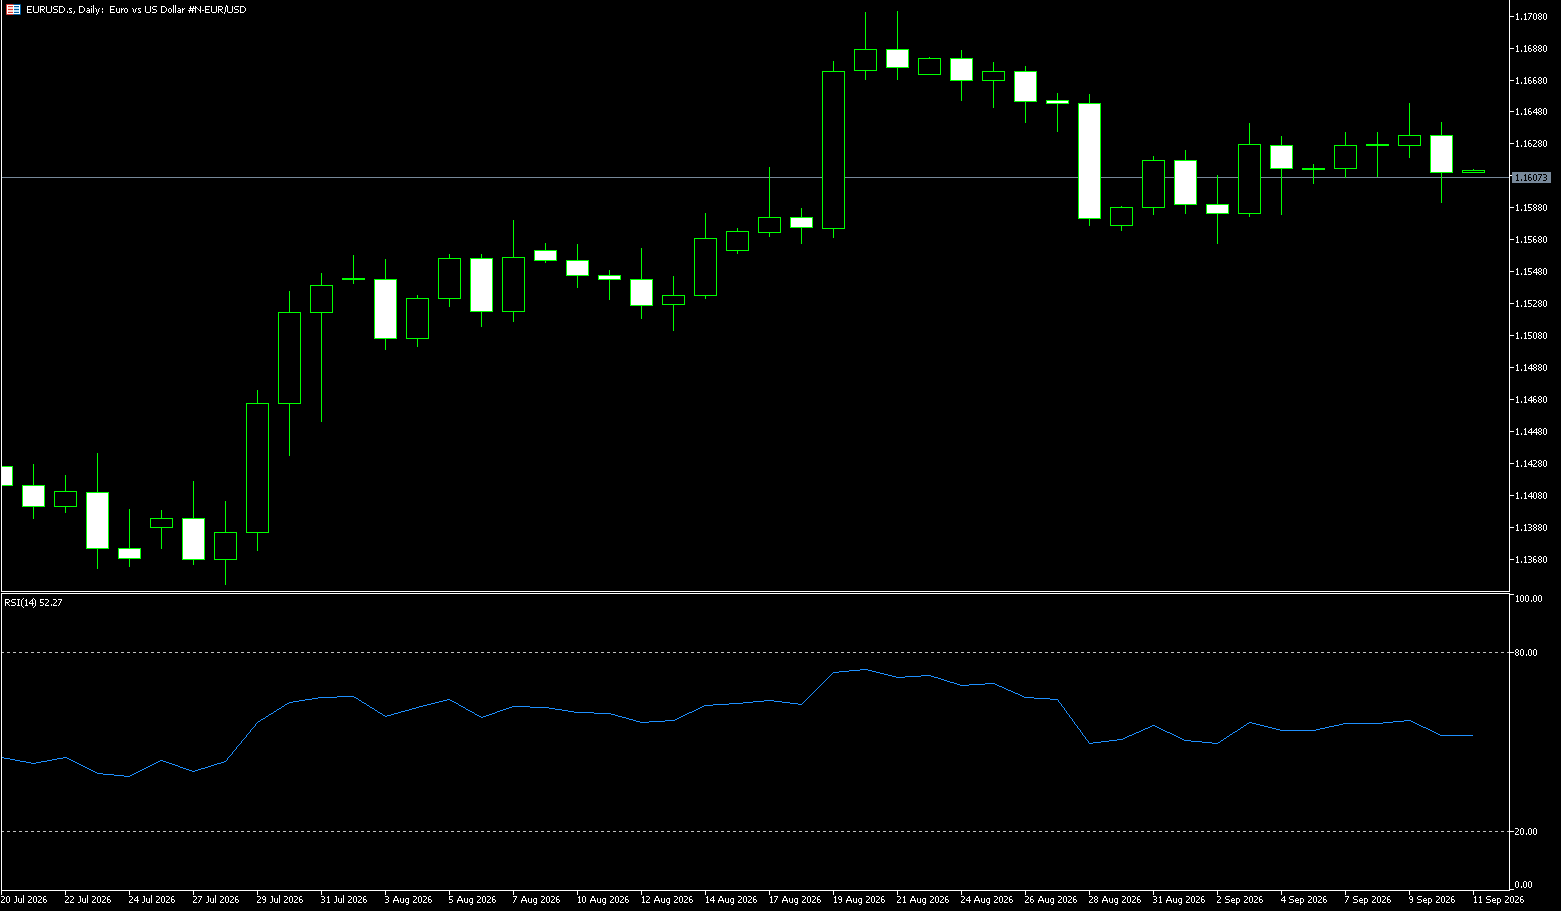
During the Asian session on Tuesday, EUR/USD was seen consolidating near the 1.1330–1.1350 range, trading close to the lowest level since July 28, which was reached the previous day. Traders appear cautious, opting to await further developments regarding the Middle East crisis before placing new directional bets. US President Trump rejected Iran's proposal to end hostilities and immediately reopen the Strait of Hormuz upon the fulfillment of certain conditions. Nevertheless, the broader fundamental backdrop seems to favor USD bulls, suggesting that the path of least resistance for EUR/USD remains to the downside. Meanwhile, ECB President Christine Lagarde told a European Parliament committee on Monday that a moderate policy response remains appropriate, as there is currently no evidence of energy prices feeding through to higher wages. Lagarde's attempt to dampen market bets on a more aggressive rate-hike cycle should keep EUR bulls on the defensive; therefore, caution is warranted until there is confirmation that EUR/USD has bottomed out and is staging a meaningful rebound.
On the daily chart, EUR/USD remains under significant bearish pressure, trading well below the 9-day (1.1417) and 14-day (1.1465) simple moving averages; these levels are capping the upside and reinforcing the short-term negative bias. The 14-day Relative Strength Index (RSI) is hovering near the oversold territory at 25.39, suggesting that while downside momentum is strong, the sell-off is becoming overextended. On the downside, initial support appears near the lower Bollinger Band at 1.1316 and the 1.1300 psychological level; sellers may hesitate to push prices lower without a corrective rebound. On the upside, initial resistance is concentrated around the 9-day simple moving average (1.1417), followed by resistance near the 14-day simple moving average (1.1465); only a recovery above these levels would alleviate the current bearish tone.
Consider going long on the EUR at 1.1330 today; Stop-loss: 1.1320; Targets: 1.1380, 1.1390.
Stock Analysis:
Australia ASX 200 Stock Index
Market Overview:
ASX 200 closes 0.3% higher
The ASX 200 index rose 30 points, or 0.3%, to 8,709 on Tuesday, extending previous gains driven by strong performance in the consumer durables, technology, and manufacturing sectors. Market sentiment was bolstered by assurances from the Reserve Bank of Australia that monetary policy remains effective in addressing economic developments, with the board reaffirming its focus on price stability and full employment. At its September meeting, the central bank raised the cash rate to a 15-year high of 4.6%—marking the fourth hike of the year—in line with expectations. Traders are now awaiting key domestic data releases later this week, including August figures for inflation, trade, and private sector credit, while also preparing for September Purchasing Managers' Index (PMI) data from China, a major trading partner.
According to the latest data, household spending remained flat in August, halting three months of growth. BHP Group rose 0.6% and Rio Tinto gained 0.4%, while South32 climbed 2.9% and WiseTech Global rose 2.8%. However, the "Big Four" banks fell between 0.3% and 0.9%, and energy giants Woodside and Santos Ltd. declined 1.1% and 1.0%, respectively.
Sector Performance:
Top gainers: Information Technology (+4.61%, driven by Codan), Materials (+1.02%, with iron ore and gold stocks strengthening), and Consumer Discretionary (+0.72%).
Top losers: Financials (-0.13%, with banks under pressure as rate hikes dampen long-term credit outlooks); Consumer Staples and Communication Services also closed slightly lower.
Technical Analysis:
ASX 200 Tuesday Close: 8,709.3 points (+29.6 points, +0.34%). Key Event: The RBA raised interest rates by 25 basis points on Tuesday—a move largely priced in by the market beforehand. The index experienced significant intraday volatility but recovered late in the session to close in the green, forming a "stabilization" candlestick pattern following the realization of negative news. Candlestick Pattern: A small bullish candle with a long lower shadow; the price tested support levels mid-session and fluctuated rapidly after the rate decision, with capital flowing back in late to drive a gain. This pattern reflects a tug-of-war between bulls and bears during a bottoming-out phase; the trend remains range-bound following a medium-term pullback, with no clear upward reversal yet. The index held above the 8,700 mark but faced resistance at the initial level of 8,736. Short-term Moving Averages: Prices are hovering near short-term moving averages, which have flattened out, showing no clear bullish alignment. Volatility (AU VIX): Declined, indicating a cooling of panic, though it has not yet entered a zone of strong optimism. Core Logic: The rate hike has materialized, playing out the "buy the rumor, sell the fact" scenario. The market is digesting the negative impact of the hike, but the high-interest-rate environment continues to weigh on heavyweight financial and real estate sectors; the rebound is event-driven rather than a trend reversal.
Wednesday (Sept 30) Technical Outlook: Predominantly range-bound trading, with an initial test of the 8,736 resistance level likely. If the index fails to break through, it may pull back to test support at 8,602; the outlook remains cautious, with a low probability of a significant, one-sided rally. Optimistic Scenario (Low Probability): Bulls gain momentum after the open and firmly establish the price above 8736, opening up room for a rebound with a target of 8817. Prerequisites: Iron ore remains strong, overnight US stocks stabilize, and the AUD/USD exchange rate does not experience a further sharp decline. Base Case Scenario (Highest Probability): Fluctuation within the 8602–8736 range. The positive impact of the interest rate decision has already been priced in, and there is a lack of new, strong drivers; the price rises early but faces resistance at 8736, subsequently pulling back to find support in the 8630–8660 zone. Pessimistic Scenario: A decisive break below 8602 (closing below this level or remaining below it for a sustained hour) triggers a new downward leg, with the next target at 8540. Trigger conditions: A sharp drop in iron ore prices, continued decline in overnight US stocks, or Chinese manufacturing data falling short of expectations. Key Fundamental Data for Wednesday: Chinese Manufacturing PMI (critical, as it directly impacts the Australian raw materials sector); overnight performance of US stocks and iron ore prices.
Trading Strategy (Short-term Perspective)
Bullish Strategy (Go long only upon confirmed breakout; do not enter positions prematurely)
• Entry Condition: Index establishes a firm position above 8736 on high volume
• Long Targets: 8780 → 8817; Stop-loss: Below 8700
• Strategy: Follow the breakout only; avoid chasing highs. Abandon the long position if the price spikes but quickly retreats.
Bearish Strategy (Sell on a pullback after facing resistance)
• Entry Conditions: Price rallies near 8736 but faces resistance and stalls; candlestick pattern shows a reversal signal.
• Short Targets: 8650 → 8602; Stop-loss: Above 8755.
• Strategy: Initiate a light short position if resistance holds; if 8602 is breached, add to the position targeting 8540.
Key Risk Warnings:
1. Iron Ore and China Data Risk: If China's PMI on Wednesday falls significantly below expectations, a sell-off in materials stocks could rapidly drag down the ASX200, breaking directly through the 8602 support level.
2. US Market Correlation Risk: Further overnight declines in US stocks could lead to a lower opening and a gap-down that breaches the stop-loss level, posing a risk of slippage.
3. Exchange Rate Risk: A rapid weakening of the AUD/USD pair could weigh on stocks with significant overseas revenue.
4. Post-Event Sentiment Reversal: The positive impact of an RBA rate hike may be fully priced in, creating a "sell the news" scenario where an initial rally turns into a pullback—potentially a "bull trap."
China Shanghai Composite Index
Market Overview:
Chinese stocks rebound on stimulus expectations
The Shanghai Composite Index rose 0.18% on Tuesday to close at 3830.5 points, while the Shenzhen Component Index gained 0.34% to reach 12902 points. Both indices rebounded from the previous trading session as expectations for policy stimulus improved market sentiment. Issuance of Chinese government bonds is set to accelerate in the fourth quarter; previously, local governments had utilized only 81% of their annual special bond quotas during the first nine months of the year. The State Council has indicated that unused borrowing quotas from prior years could be activated, potentially pushing debt sales beyond the remaining allocation for the year. The prospect of increased debt sales comes as Beijing ramps up fiscal support to bolster an economy facing slowing growth and weak domestic demand. Meanwhile, investors are awaiting the release of official and private PMI surveys on Wednesday to assess the resilience of China's manufacturing sector amidst robust external demand and strength in the technology industry. Notable gainers included Agricultural Bank of China (1.17%), Cambricon Technologies (2.55%), and Suzhou Dongshan Precision (1.74%).
Sector Performance:
Top-performing sectors: Real estate chain (real estate, building materials); AI hardware/semiconductors (computing power, optical modules, advanced packaging); high-dividend defensive stocks (banks, utilities); non-ferrous metals/precious metals.
Worst-performing sectors: Coal, oil & petrochemicals; media/short-drama stocks driven purely by thematic speculation.
Technical Analysis:
The Shanghai Composite Index closed at 3,952.13 points (+0.06%), with a high of 3,970.21 and a low of 3,935.42. Turnover on the Shanghai exchange alone reached 1.008 trillion yuan, while the combined turnover of both exchanges totaled 2.14 trillion yuan—an increase of approximately 104 billion yuan from the previous day. Candlestick pattern: The index opened high, rallied, then pulled back to close with a small bullish candle featuring a short upper shadow (technically a "false bearish" structure). After three consecutive days of gains, it is now fluctuating within a resistance zone, reflecting high-volume turnover during a rebound. The index faced resistance near 3,970 after an early-morning rally, gradually retreated in the afternoon, and recovered slightly toward the close; the pattern shows significant volume without corresponding price gains. The index remains above the 5-day, 10-day, and 20-day moving averages; short-term moving averages are in a bullish alignment, and the medium-term trend remains strong. The price gap at 3,995 acts as a zone of strong resistance; Tuesday's high was close to this level, and selling pressure is beginning to emerge. Sector structure: Media and computer sectors led the gains, while shipping/ports, oil & gas, wind power equipment, and parts of the real estate chain saw profit-taking pullbacks. Individual stock performance was mixed, with decliners outnumbering gainers; heavyweight stocks provided support, while divergence increased among small-cap stocks as capital rotated from previously strong sectors toward AI applications. Technical Outlook for Wednesday (Sept 23): Three Scenarios — **Optimistic Scenario (Breakout on High Volume):** Strong buying support at the open, turnover remains above 2.1 trillion, and the index stabilizes above 3970, challenging the 3995 gap. **Implication:** Capital continues to push upward; however, a rapid surge followed by a pullback is likely after high-volume trading at highs, so chasing prices is not advisable. **Neutral Scenario (Range-bound Fluctuation – Most Likely):** The index oscillates between 3935 and 3970 with slightly shrinking volume. **Implication:** Profit-taking is absorbed at high levels, sectors rotate rapidly, and the index lacks a clear directional trend, resulting in a structural market. **Pessimistic Scenario (Breakdown and Retest):** The index drops below 3935 without a quick recovery, proceeding to test support at 3910. **Implication:** Short-term capital exits en masse, triggering a 60-minute chart correction; a decisive break below the 20-day moving average signals the end of the current short-term rebound phase.
Trading Strategy:
Operational Strategy (Short-term perspective; suitable for Hang Seng Index / HSI Futures traders)
**Bullish Approach**
• If the index stabilizes near 3935 with strong intraday buying support and clear sector leadership, consider "buying the dip" with a small position;
• After establishing a firm foothold above 3970 on high volume, focus only on leading sectors and avoid chasing speculative themes; if the rally stalls near 3995, reduce positions.
**Bearish Approach**
• If the index rallies to the 3970–3995 range but volume fails to keep pace and intraday momentum weakens, reduce positions to lock in profits;
• If the index drops below 3935 and fails to recover within 30 minutes, reduce positions; if it decisively breaks below 3910 (closing below that level), further cut exposure to under 20% to avoid the short-term pullback. Key Risk Warnings:
1. Trading Volume Risk: If the combined turnover of the two exchanges rapidly falls below 1.9 trillion yuan, the market will lack incremental capital; any rebound could easily stall, increasing the probability of a volatile pullback.
2. Pre-Holiday Risk Aversion: With the Mid-Autumn Festival and National Day holidays approaching, some capital is opting to cash out before the break, raising the possibility of intensified selling pressure during the latter half of the week.
3. Sector Rotation Risk: Market performance is currently highly divergent; while indices may fluctuate, individual stocks could suffer significant declines—creating a scenario where indices rise but investors fail to make profits. There is also a high risk of pullbacks for high-flying thematic stocks.
4. External Disturbance Risk: Fluctuations in US stock markets and Treasury yields will impact opening sentiment in the A-share market, making a lower opening likely.
Disclaimer: The information contained herein (1) is proprietary to BCR and/or its content providers; (2) may not be copied or distributed; (3) is not warranted to be accurate, complete or timely; and, (4) does not constitute advice or a recommendation by BCR or its content providers in respect of the investment in financial instruments. Neither BCR or its content providers are responsible for any damages or losses arising from any use of this information. Past performance is no guarantee of future results.
More Coverage





2026 © - All Rights Reserved by BCR Co Pty Ltd
Risk Disclosure:Derivatives are traded over-the-counter on margin, which means they carry a high level of risk and there is a possibility you could lose all of your investment. These products are not suitable for all investors. Please ensure you fully understand the risks and carefully consider your financial situation and trading experience before trading. Seek independent financial advice if necessary before opening an account with BCR.
BCR Co Pty Ltd (Company No. 1975046) is a company incorporated under the laws of the British Virgin Islands, with its registered office at Trident Chambers, Wickham’s Cay 1, Road Town, Tortola, British Virgin Islands, and is licensed and regulated by the British Virgin Islands Financial Services Commission under License No. SIBA/L/19/1122.
Open Bridge Limited (Company No. 16701394) is a company incorporated under the Companies Act 2006 and registered in England and Wales, with its registered address at Kemp House, 160 City Road, London, England, EC1V 2NX. Open Bridge Limited acts solely as a payment processor for BCR Co Pty Ltd and does not provide any financial, trading, or investment services on its behalf. Open Bridge Limited's role is limited to payment processing.


 English
 简体中文
简体中文
 繁體中文
繁體中文
 Bahasa
Melayu
Bahasa
Melayu
 Tiếng
Việt
Tiếng
Việt
 ไทย
ไทย
 日本語
日本語
 한국어
한국어
 ភាសាខ្មែរ
 español