0
US Dollar Index
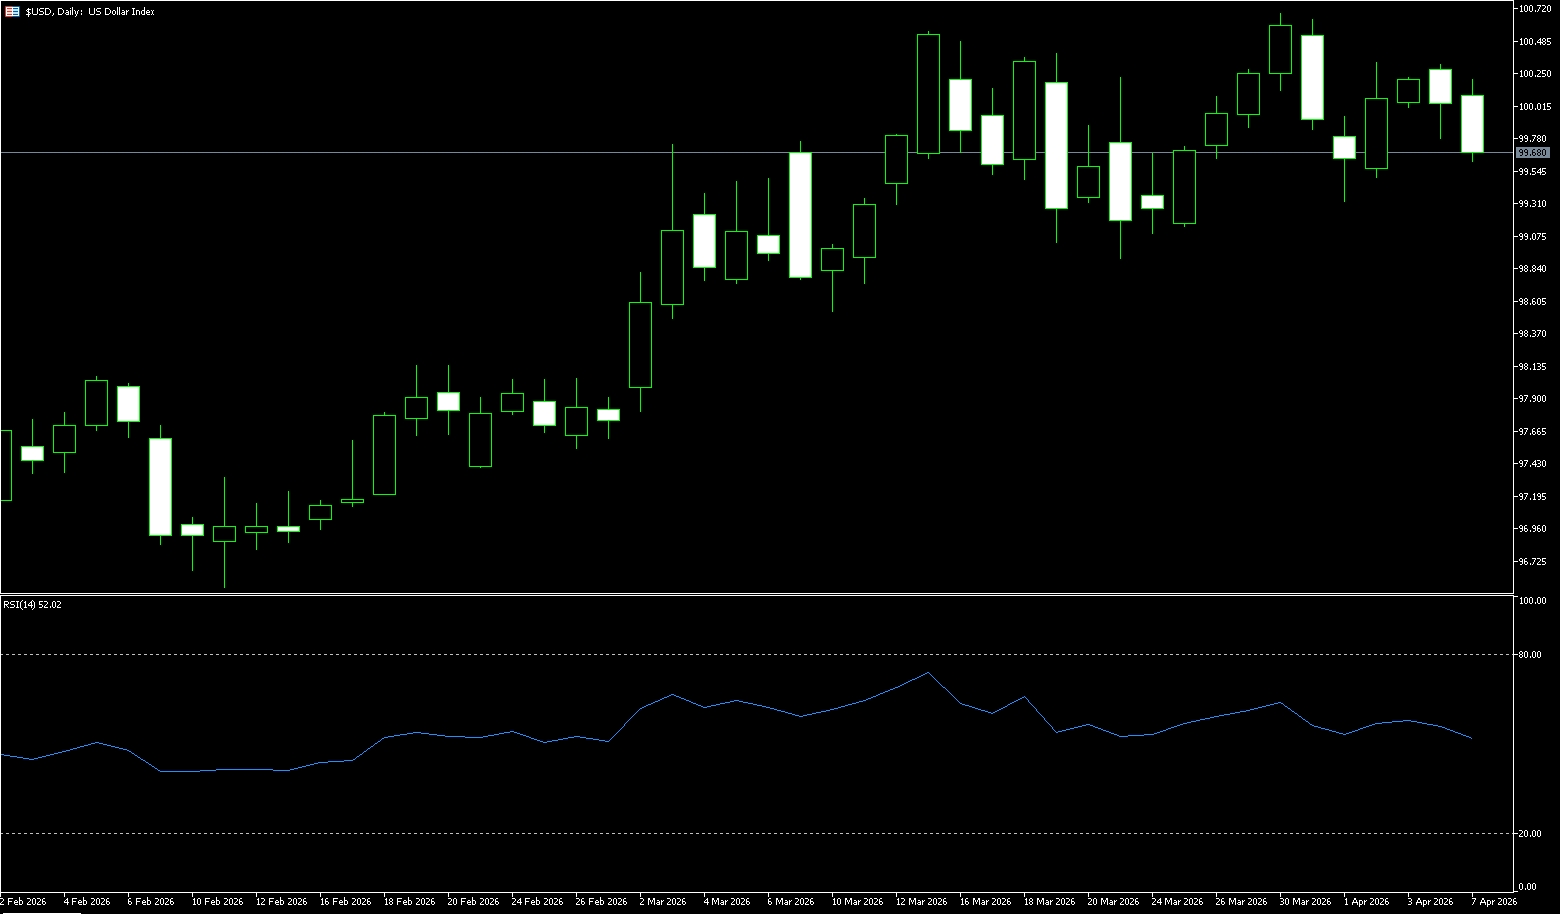
The US dollar index fell back below 100 early in the week as traders weighed escalating tensions with hopes for a ceasefire ahead of Trump's latest deadline for reopening the Strait of Hormuz. Trump threatened on Easter Sunday to strike Iranian power plants and bridges if the strait was not reopened, but media reports indicated negotiators were making a final push, and investors were assessing the possibility of a ceasefire. The dollar index closed at 100, the euro at $1.1542, and the pound at $1.324. The yen fell to 159.71 against the dollar, nearing the 160 level and a 21-month low; strong warnings from Japanese officials were followed by geopolitical turmoil supporting demand for the safe-haven dollar, with the market skeptical of substantive intervention. Speculative short positions in the yen reached $5.7 billion, the highest since July 2024. The potential blockade of the Strait of Hormuz has exacerbated stagflation concerns, with traders now expecting the Federal Reserve to cut interest rates only in the second half of 2027, compared to initial market expectations of two rate cuts in 2026 at the beginning of the year. The Australian dollar rose 0.49% to US$0.692, still hovering near a two-month low.
At the start of the week, the US dollar's performance was quite unusual, exhibiting a clear "positive news but no rise" characteristic. From a supportive perspective, last week's better-than-expected non-farm payroll data, rising US Treasury yields, and safe-haven demand amid geopolitical risks should have collectively supported a stronger dollar. Meanwhile, swap spreads widened slightly at the open on Monday (excluding 2-year swaps), indicating that short-term interest rates and swap rates had more fully priced in expectations of rate cuts, theoretically further strengthening dollar support. However, in reality, the dollar weakened, primarily due to the market's pricing in Trump's "TACO" (Trump Always Chickens Out) strategy. Investors generally believe that the US is unlikely to escalate the conflict with Iran, and that geopolitical risk premiums will gradually decline, significantly weakening the safe-haven demand for the dollar. Even with non-farm payroll data and US Treasury yields providing fundamental support, market bets on a "de-escalation of the US-Iran conflict" still dominated the dollar's performance, causing it to continue weakening despite positive factors. This week's support levels to watch are 9958 (early week low) and 99.37 (30-day moving average). For upside potential, watch 100.30 (Monday's high) and 100.64 (this year's high).
Today, consider shorting the US dollar index at 99.74, with a stop-loss at 99.85 and targets at 99.30 and 99.40.
WTI Crude Oil
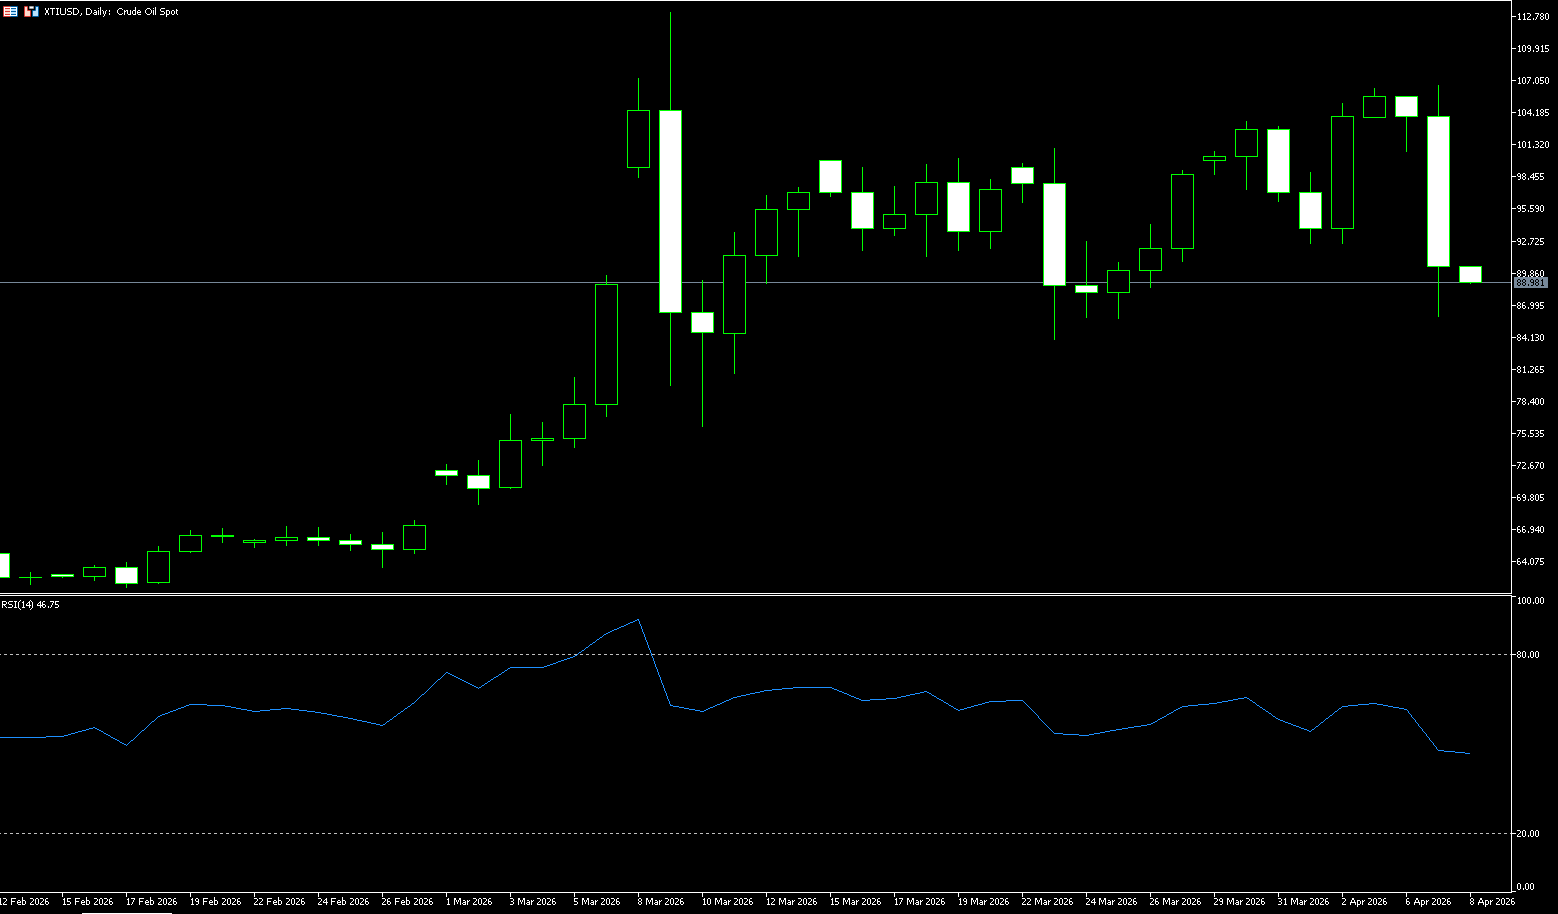
WTI oil prices traded around $101.20 per barrel on Tuesday. Prices rose in volatile trading on Monday, with the market focused on the return from the holiday, the delayed non-farm payroll data from last Friday, and the latest developments in the Iranian situation. Trump stated he could destroy Iranian bridges and power plants in four hours. The strait blockade has disrupted about one-fifth of global oil supply, prompting major consuming countries to seek reserves or reduce consumption. The US and Iran received a framework proposal from Pakistan, but Iran refused to immediately reopen the strait. Trump threatened to send Tehran to "hell" if no agreement was reached by Tuesday. The passage of some ships through the Strait of Hormuz over the weekend has become a focus of market attention. Last Thursday, WTI crude and Brent crude surged 11% and 8% respectively, marking their largest single-day gains since 2020. On the supply side, OPEC+ agreed to a slight increase of 206,000 barrels per day in May, and Saudi Aramco raised its official selling price for Arab Light crude to Asia in May to a record $19.50 per barrel higher than the Oman/Dubai average.
Regardless of the outcome of the US-Iran negotiations, the high oil price trend is unlikely to change in the short term. Nevertheless, potential risks cannot be ignored. There is currently no feasible alternative route through the Strait of Hormuz. If this impact continues for several weeks, oil prices, inflation, and financial market conditions could create multiple transmission effects, significantly increasing the probability of a global economic recession. Even if the conflict only lasts three months, the average price of WTI crude oil could still reach $150 per barrel over the next six months. On the upside, watch the $106.44 (early weekly high) and the $110 (psychological level) area; on the downside, the first target is $100 (psychological level), followed by $98.71 (9-day moving average).
Today, consider going long on crude oil at $101.00, with a stop loss at $100.80 and targets of $103.00 and $103.50.
Spot Gold
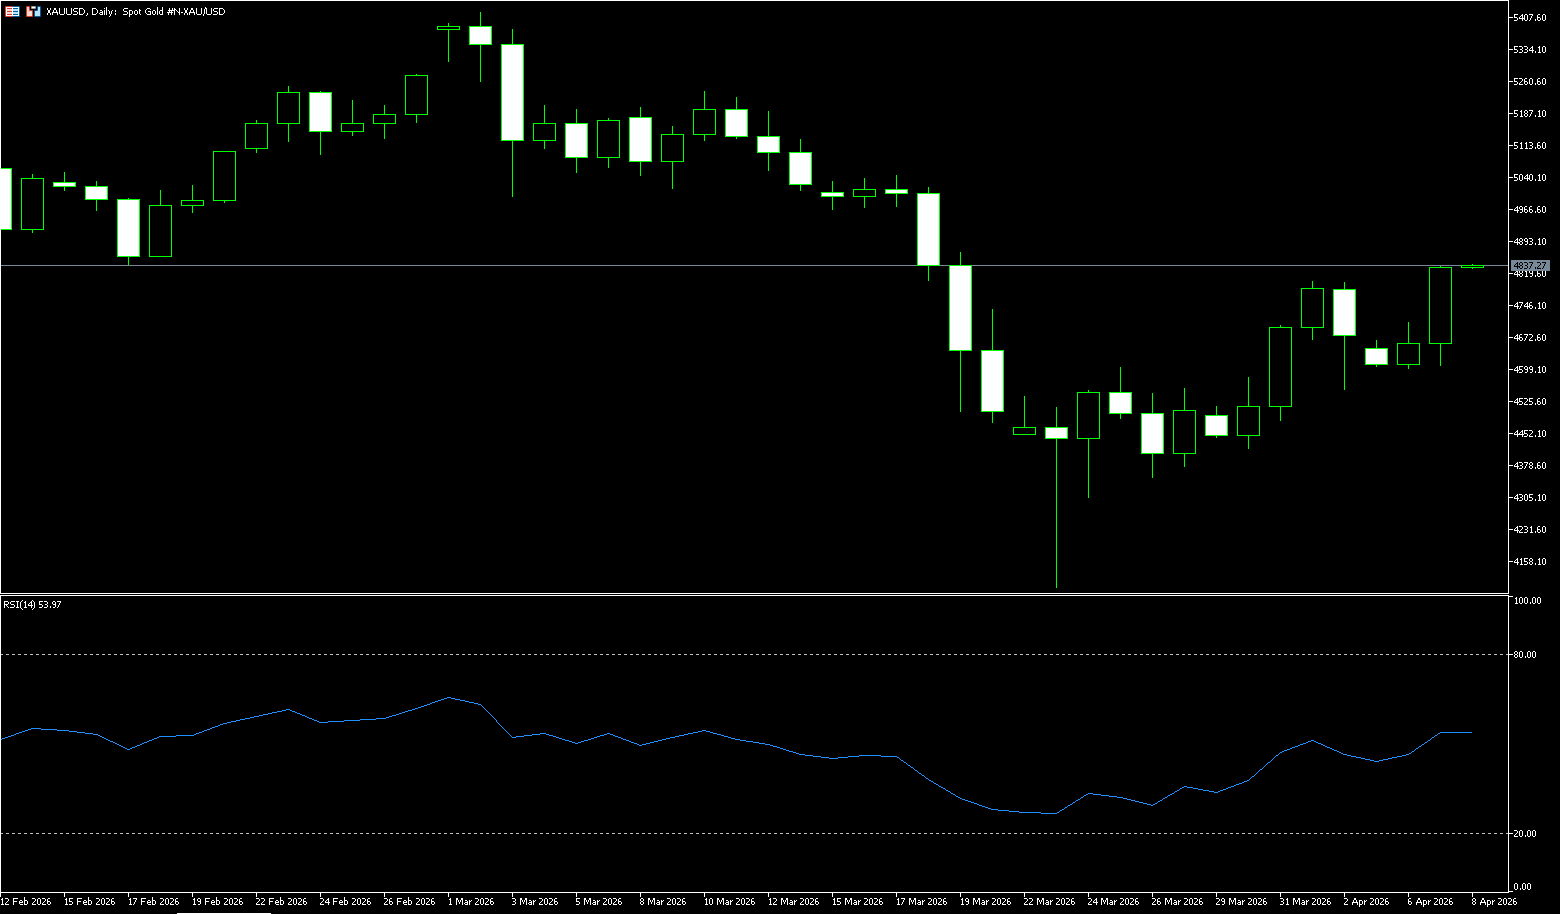
On Tuesday, spot gold traded around $4705 per ounce. Gold prices fell slightly on Monday, despite Trump's renewed threat to make Iran "taste hell" if no agreement was reached by Tuesday. Iran sought a lasting ceasefire and resisted pressure for a temporary ceasefire. Meanwhile, Iran released a ten-point peace roadmap, offering to lift the blockade in exchange for a ceasefire. The escalating conflict between Iran and the Strait of Hormuz, coupled with the blockade pushing up oil prices, and the US March services PMI slowing but the input price index surging to a 13-year high, have suddenly intensified inflationary pressures. Gold prices are currently fluctuating between $4600 and $4700. With Trump's ultimatum looming, expectations for a Fed rate cut have significantly decreased. A fierce battle between safe-haven demand and interest rate pressures makes gold's short-term trend unpredictable. Traders should closely monitor this week's Fed meeting minutes and CPI data, cautiously seizing opportunities for a breakout from the $4600-$4700 range.
The gold market is at a rare equilibrium point between bulls and bears. War and inflation, safe-haven demand and interest rates, growth concerns and policy tightening—these conflicting forces are locking gold prices within a narrow trading range. The ensuing inflationary shocks and interest rate hike expectations will suppress gold in the medium term. Momentum indicators suggest that bearish pressure is easing: the MACD indicator has turned upwards above the signal line, but remains below the zero line; the Relative Strength Index (RSI) is flattening below the 50 neutral level—indicating that although selling momentum has cooled somewhat, the overall bearish tone remains. If gold prices rebound from the 100-day moving average support level of 4660, the upside target will be a key confluence resistance level: the intersection of the medium-term uptrend line and the 20-day moving average at 4730. A sustained hold above 4850 would reverse the current downward trend and allow for a renewed rise towards the 50-day moving average around 4935. Conversely, a break below 4600 would test the 4550-4375 trading range established in late March, followed by the 150-day moving average around 4419.
Consider going long on spot gold today at 4700, with a stop-loss at 4695 and targets at 4750 and 4760.
AUD/USD
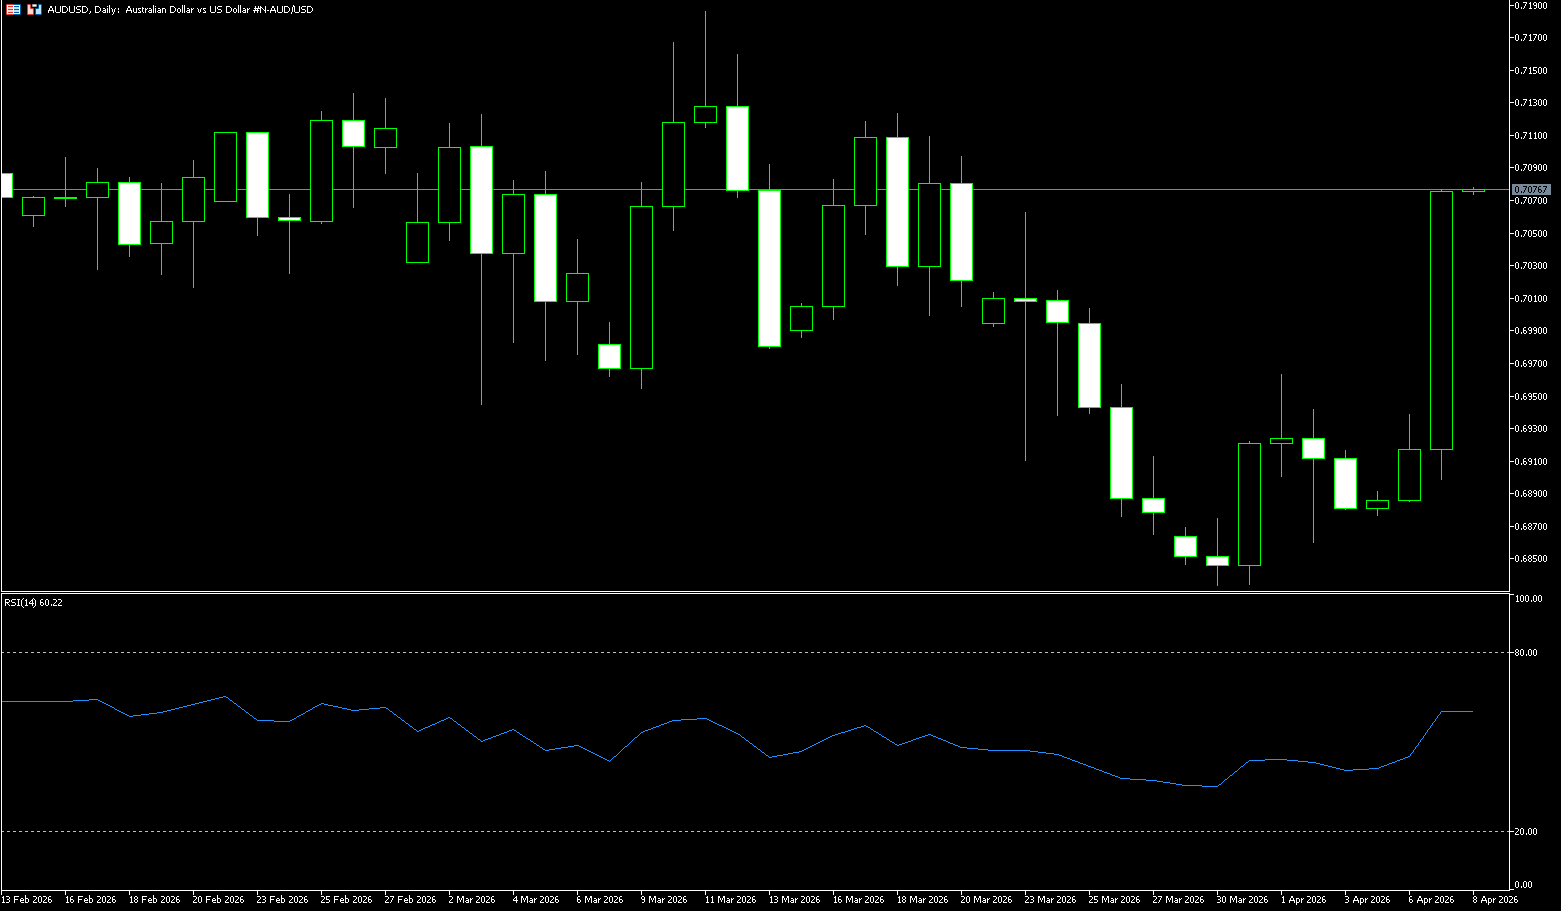
The AUD/USD pair rebounded to 0.6970 instead of falling, but this move lacked momentum. The pair is expected to trade between 0.6890 and 0.7000 in the short term. The overall technical outlook remains bearish. The Australian dollar remains weak around US$0.6950, near a two-month low, as market caution intensifies ahead of US President Trump's deadline regarding the Strait of Hormuz. Washington has set a clear deadline for Iran to reopen shipping in the Gulf or face potential attacks on critical infrastructure. The heightened risk of closures of key oil transport routes has driven energy prices sharply higher and boosted demand for the US dollar as a safe-haven asset. While hopes for a last-minute diplomatic breakthrough helped limit further declines, market sentiment remains fragile, with traders closely watching the 8 p.m. deadline. Meanwhile, domestic data showed a sharp decline in activity, with Australia's S&P Global Purchasing Managers Index slipping into contraction territory for the first time in March.
Despite a sound macroeconomic fundamental for the Australian dollar and a hawkish stance from the Reserve Bank of Australia, sustained gains appear unlikely at this time. It is worth noting that risk appetite is favorable for the Australian dollar, but rising volatility and/or uncertainty tend to support inflows into safe-haven assets, with the US dollar remaining the biggest beneficiary in this area. On the daily chart, the Australian dollar is trading around 0.6960 against the US dollar. The short-term bias is neutral with a slight downward tendency, as the pair has retreated from the recent 0.7150 area while holding above multiple support levels. The price remains above the 100-day and 200-day simple moving averages, maintaining the overall uptrend, but the Relative Strength Index (RSI) is around 43.44, indicating weakening bullish momentum and increasing selling pressure. Immediate support is at 0.6844 (100-day simple moving average), followed by 0.6800 (psychological level). Initial resistance is at 0.7000 (psychological level), followed by horizontal resistance at 0.7025 (50-day simple moving average).
Consider going long on the Australian dollar at 0.6965 today, with a stop loss at 0.6955 and targets at 0.7010 and 0.7025.
GBP/USD
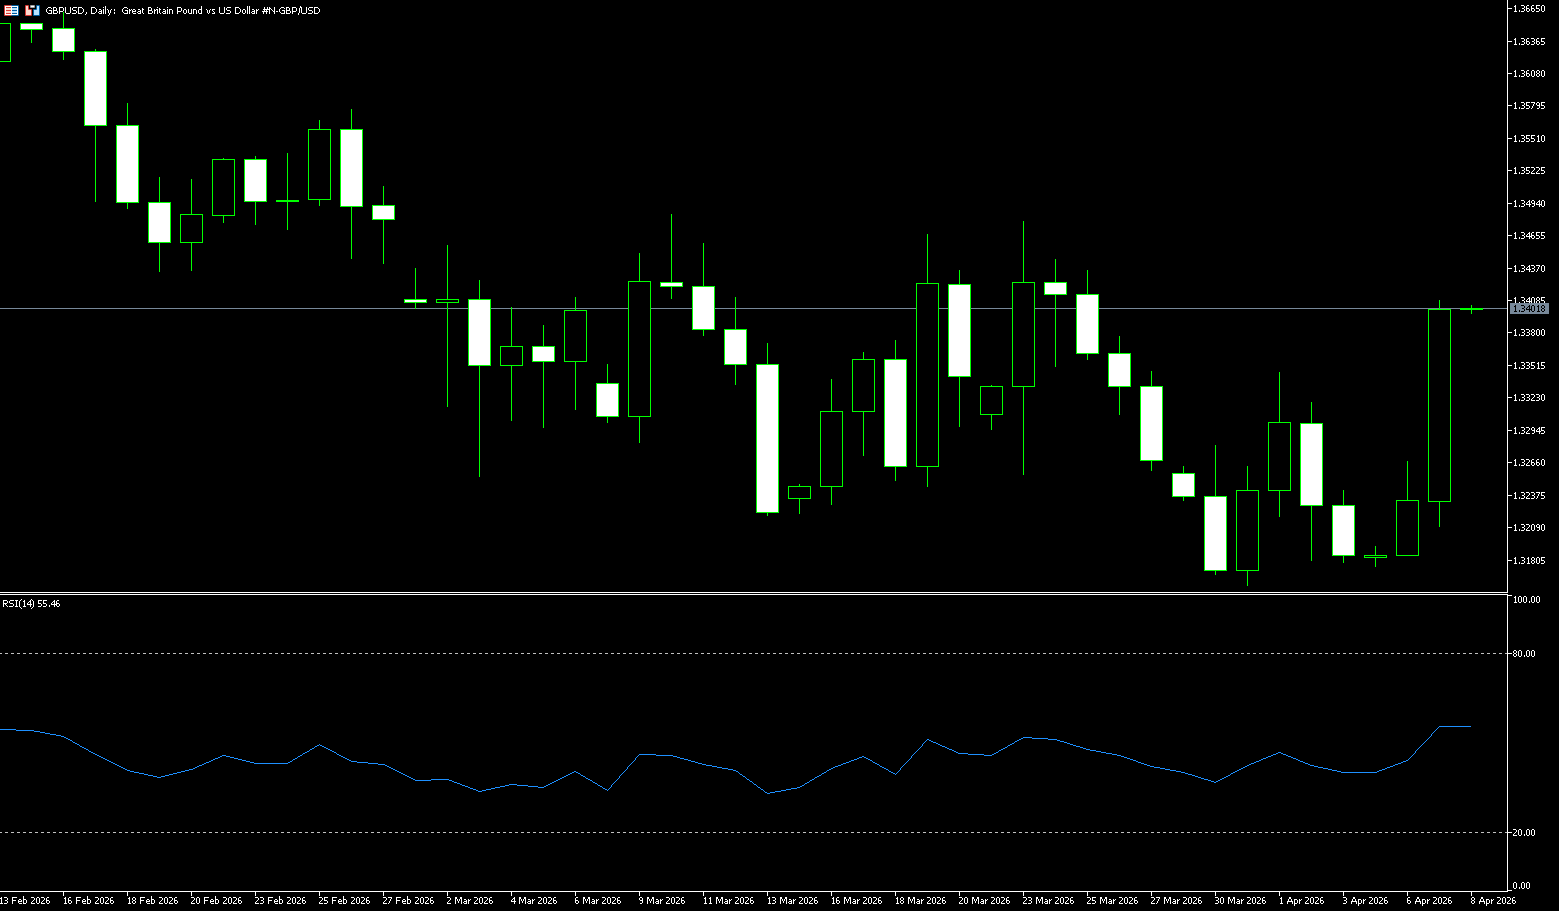
The GBP/USD pair held steady after gaining more than 0.25% the previous day, trading around 1.3290 in early European trading on Tuesday. Technical analysis on the daily chart shows a continued bearish bias, with the pair moving lower within a descending channel. GBP/USD is below the 9-day and 50-day exponential moving averages, limiting upside and making the short-term bias slightly bearish. The price action has gradually declined from the middle of 1.34, failing to regain the 9-day exponential moving average, highlighting persistent selling pressure on rallies. Traders are closely watching President Trump's deadline regarding the Strait of Hormuz. Trump warned that he might take action against Iranian power plants and bridges unless his demands are met by 8 p.m. Eastern Time. Data released Monday by the Institute for Supply Management (ISM) showed that the services purchasing managers' index (PMI) fell to 54.0 in March from 56.1 in February, below the expected 55.0, indicating a slight weakening of momentum in the sector. Bank of England policymakers, including Sarah Bridenstine and Swati Dingela, shifted from supporting interest rate cuts to keeping rates unchanged amid rising energy costs due to the Middle East conflict.
On the daily chart, GBP/USD is trading between 1.3280 and 1.3290. The short-term bias is mildly bullish, as prices have steadily held above the psychological level of 1.3200 and last week's low of 1.3159, a narrow range that supports the intraday trend. The latest 14-day Relative Strength Index (RSI) reading fell back to the lower half of the scale at 42.39 after failing to extend its earlier break above 70, indicating weakening upward momentum but no clear bearish reversal, while the spot price remains above the long-term intraday moving average. Immediate resistance is at 1.3300 (the psychological level). A break above this level would open up space for a further move towards 1.3347 (the 30-day simple moving average), maintaining the short-term bullish bias up to 1.3380 (the March 23 high).
Consider going long on GBP at 1.3286 today, with a stop loss at 1.3275 and targets at 1.3340 and 1.3350.
USD/JPY
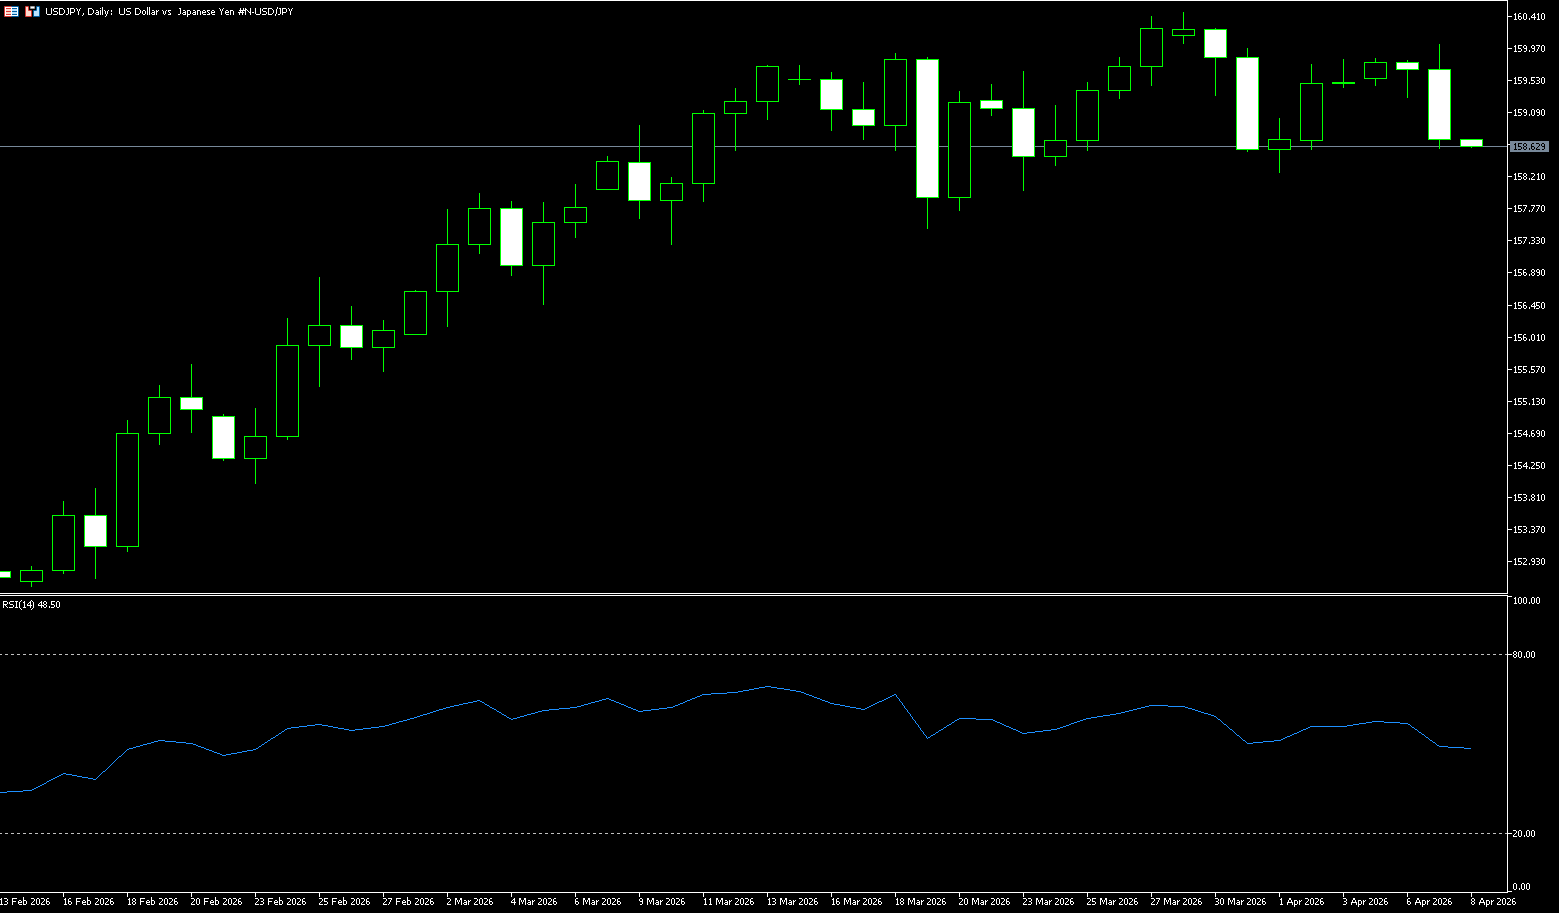
USD/JPY touched a one-week high in Asian trading on Tuesday, but lacked follow-through momentum and hovered below the psychological level of 160.00, with mixed fundamental signals. Data released by Japan's Ministry of Internal Affairs and Communications showed that household spending fell 1.8% year-on-year in February, a further deepening of the 1.0% decline in the previous month and marking the third consecutive month of decline. On a monthly basis, personal spending rose 1.5% for the first time in three months, partially recovering from the 2.5% drop in January, but falling short of market expectations. This, in turn, weakened the yen and contributed to the rise in USD/JPY. Meanwhile, the ongoing war in Iran exacerbated concerns about significant pressure on the Japanese economy in the foreseeable future, given its reliance on oil imports from the Middle East. This further dampened market bets on an immediate interest rate hike by the Bank of Japan, becoming another factor weighing on the yen. However, market speculation that authorities might intervene to curb further currency weakness helped limit deeper declines in the yen.
Amid the recent rebound from the key 200-day simple moving average (153.02), a sustained hold above the psychological level of 160.00 would be seen as a new trigger for bullish traders. The 14-day Relative Strength Index (RSI) hovered around 58.55, remaining in bullish territory and not overbought, indicating continued buying pressure but a reduced urgency to extend the rally.
However, the MACD line is flattening above the zero line, only slightly above its signal line, indicating weakening momentum but still positive. Therefore, as a precaution, we should wait for confirmation of further buying before positioning for further gains, targeting the next major resistance level around 160.50, and then challenging the psychological level of 161.00. Initial support is at 158.50, followed by the stronger demand zone around 157.70, the previous breakout area. A daily close below 157.70 would weaken the bullish structure and expose the consolidation zone at 156.20. As long as USD/JPY remains above 158.50, pullbacks are more likely to be consolidation within a continuing uptrend than a top formation.
Consider shorting USD at 159.70 today, with a stop loss at 159.90 and targets at 158.60 and 158.80.
EUR/USD
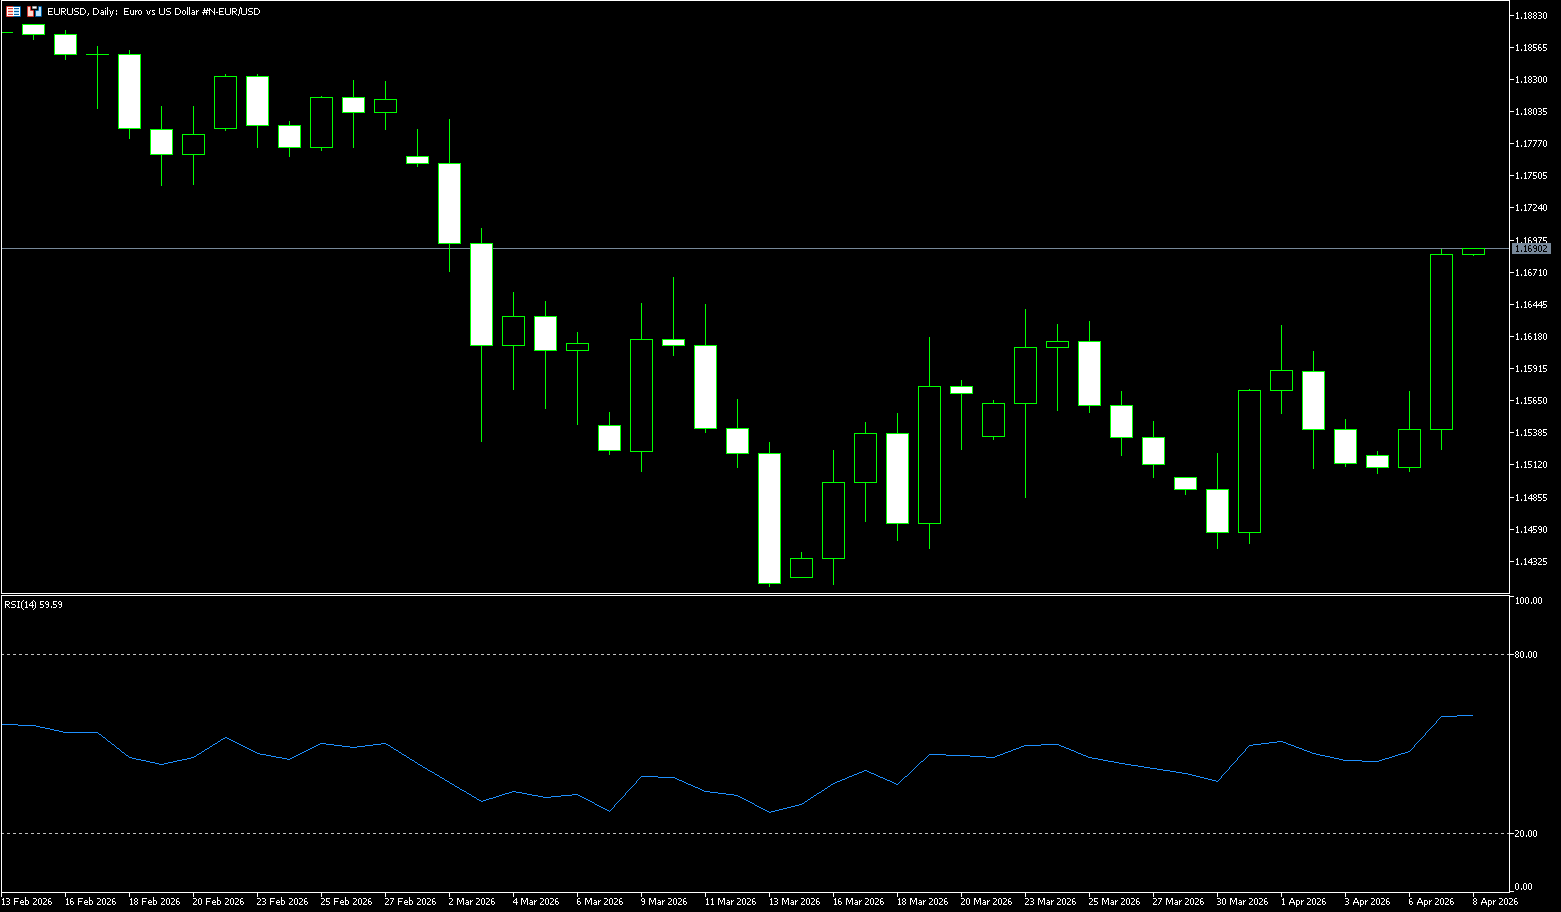
On Tuesday, EUR/USD fluctuated around 1.1600. The major currency pair remained stable as traders focused on US President Trump's deadline regarding the Strait of Hormuz. US President Trump said on Monday that the latest US-Iran ceasefire proposal was "not good enough." He threatened to attack Iranian power plants and bridges on Tuesday if the strategic waterway was not reopened, setting a specific deadline of 8 p.m. Eastern Time (00:00 GMT Wednesday). Traders assessed the escalating tensions with Iran, with all eyes focused on Trump's latest deadline for reopening the Strait of Hormuz. Any sign of escalating tensions could boost safe-haven currencies like the dollar and put downward pressure on the major currency pair. The European Central Bank's hawkish tone could support the euro. With energy-driven inflation surging, the market now expects two to three rate hikes in 2026, a significant shift from previous expectations of maintaining current rates.
On the daily chart, the euro/dollar pair remains slightly bearish, as the spot price remains below the flat 100-day and 200-day simple moving averages around 1.1687/1.1673, while the 20-day simple moving average is declining near the current price of 1.1536, creating a limited upward trend. Momentum indicators have turned slightly positive but remain near the midline, suggesting only a mild upward continuation. The RSI has rebounded from oversold territory but remains below 50, consistent with persistent selling pressure during the rebound. Initial support lies at the psychological level of 1.1500, followed by 1.1443 (last week's low), and then the psychological level of 1.1400. Continued weakness today could lead to deeper downside. On the upside, the first resistance is at the 200-day simple moving average at 1.1673; a break below this level would target 1.1700.
Consider going long on the Euro today at 1.1595, with a stop-loss at 1.1580 and targets at 1.1650 and 1.1670.
Disclaimer: The information contained herein (1) is proprietary to BCR and/or its content providers; (2) may not be copied or distributed; (3) is not warranted to be accurate, complete or timely; and, (4) does not constitute advice or a recommendation by BCR or its content providers in respect of the investment in financial instruments. Neither BCR or its content providers are responsible for any damages or losses arising from any use of this information. Past performance is no guarantee of future results.
More Coverage


Risk Disclosure:Derivatives are traded over-the-counter on margin, which means they carry a high level of risk and there is a possibility you could lose all of your investment. These products are not suitable for all investors. Please ensure you fully understand the risks and carefully consider your financial situation and trading experience before trading. Seek independent financial advice if necessary before opening an account with BCR.
BCR Co Pty Ltd (Company No. 1975046) is a company incorporated under the laws of the British Virgin Islands, with its registered office at Trident Chambers, Wickham’s Cay 1, Road Town, Tortola, British Virgin Islands, and is licensed and regulated by the British Virgin Islands Financial Services Commission under License No. SIBA/L/19/1122.
Open Bridge Limited (Company No. 16701394) is a company incorporated under the Companies Act 2006 and registered in England and Wales, with its registered address at Kemp House, 160 City Road, London, City Road, London, England, EC1V 2NX. This entity acts solely as a payment processor and does not provide any trading or investment services.

 English
 简体中文
简体中文
 繁體中文
繁體中文
 Bahasa
Melayu
Bahasa
Melayu
 Tiếng
Việt
Tiếng
Việt
 ไทย
ไทย
 日本語
日本語
 한국어
한국어
 ភាសាខ្មែរ
 español