


0
US Dollar Index
The US Dollar Index held near the 104.50 area in Wednesday's trading. Better-than-expected data on durable goods orders for February, coupled with hawkish comments from Federal Reserve officials, helped the dollar edge slightly higher. However, momentum indicators remain divergent, suggesting that the upside remains fragile. The US Dollar Index had a mixed performance in Asia on Wednesday, trading above 104.00. Earlier, the dollar found support on strong service sector activity and the possibility that proposed tariffs may be more targeted than expected. The US Dollar Index briefly fell below 104.00 following headlines from US President Trump and Vice President JD Vance. The index re-entered above 104 on Wednesday while the market evaluated two major stories. The first market driver came from US President Trump, who issued a 25% "secondary tariff" on countries that still buy oil from Venezuela. Meanwhile, the market awaited comments from the European group after a US news editor was mistakenly invited to join a Signal chat group with several Trump administration officials, and JD Vance's comments on Europe painted a clear picture of how he would like to see the EU targeted by tariffs to pay for the US military campaign against the Houthi rebels.
The US dollar index is trading cautiously above the 104.00 mark, reflecting a balance between weakening sentiment and residual optimism from Monday's gains. The technical indicator MACD on the daily chart currently sends a slight buy signal at -0.774, supported by the 10-day momentum reading. Meanwhile, the 14-day relative strength index (RSI) is around 45.50, indicating that the currency pair is not oversold, but lacks strong bullish conviction. The combined RSI/stochastics also reflects hesitation, with a reading just above 96. Despite these signs of recovery, the overall outlook remains under pressure. Continue to trend downward. The 30-day moving average is above 105.20, further reinforcing the heavy pressure zone. On the downside, support is at the 104.00 mark, as well as 103.83 (14-day simple moving average), and then 103.20 (this year's low). The upside targets are 105.00 {round mark}, and the 0-day moving average at 105.20 levels.
Consider shorting the US dollar index near 104.64 today, stop loss: 104.78, target: 104.20, 104.10

WTI spot crude oil
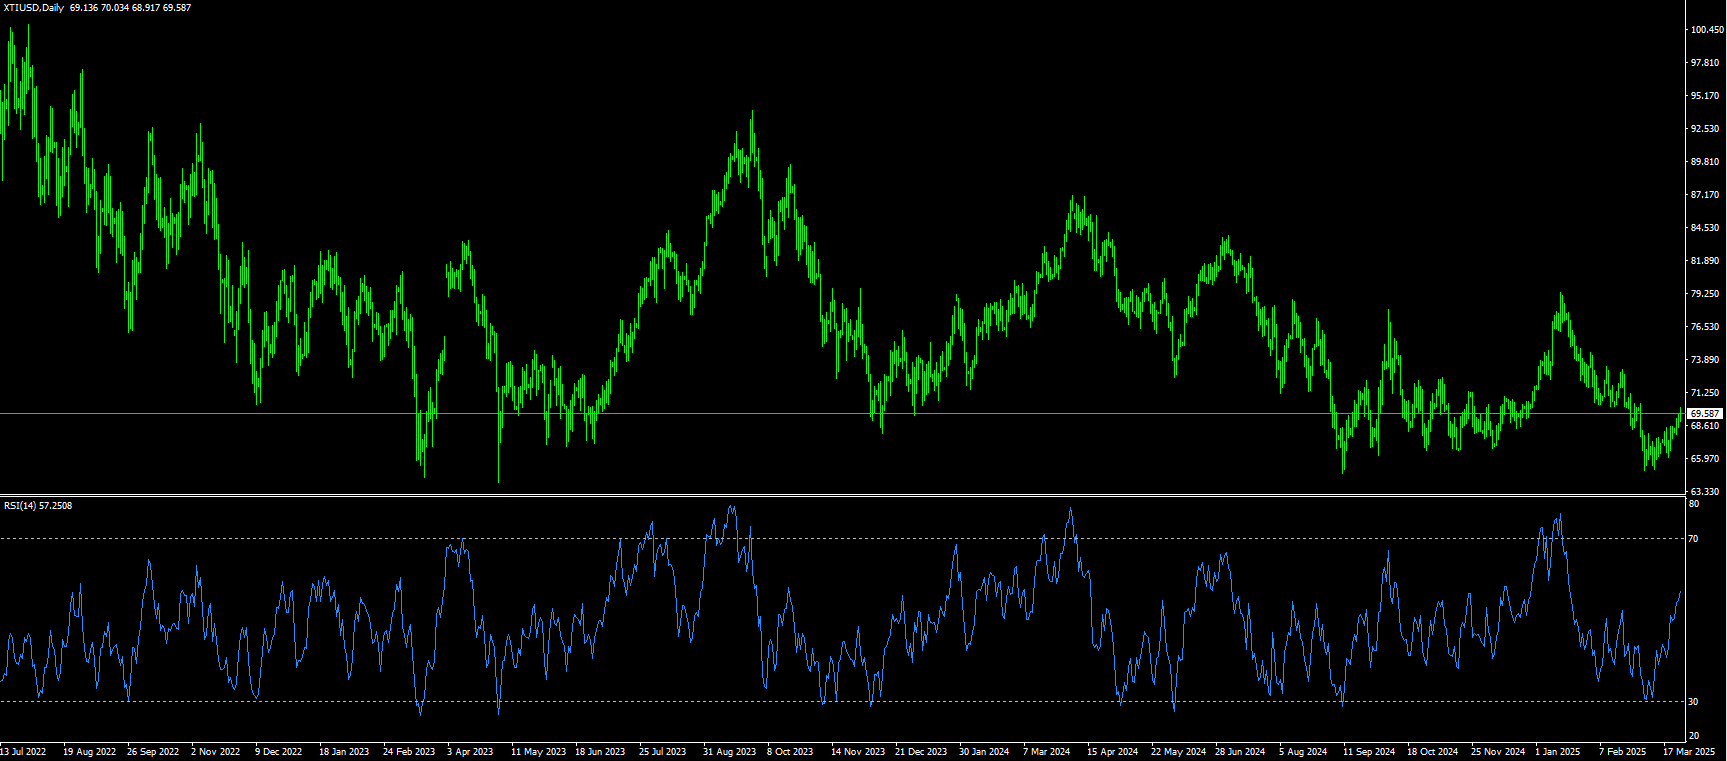
On Wednesday, international oil prices rose, boosted by falling US energy inventories and concerns about tightening global supply. Earlier, US President Trump threatened to impose tariffs on countries that buy Venezuelan crude oil, triggering market concerns about escalating geopolitical risks. WTI crude oil traded at $69.15 in early Asian trading on Wednesday. WTI prices continued their upward trend due to a larger-than-expected drop in crude oil inventories and concerns about tight global supply caused by threats to impose tariffs on countries that buy Venezuelan production. Crude oil inventories fell more than expected last week. US President Trump said late Monday that he would impose a 25% tariff on any country that buys oil or gas from Venezuela. Concerns about tight global supply pushed WTI prices to a three-week high. On the other hand, the United States reached an agreement with Ukraine and Russia to suspend maritime attacks and attacks on energy targets, and Washington also tried to ease certain sanctions on Moscow. The maritime and energy ceasefire between Russia and Ukraine offset concerns about tight global supply, which could drag down WTI prices.
From the daily chart, WTI crude oil is currently on a new high. Before hitting $70.00 (market psychological barrier), it was blocked and quickly fell back to around $69.00. The overall trend rhythm is a high-level repeated shock pattern. The 25-day simple moving average of $68.16 has a certain support effect on oil prices. From the technical indicator of the daily chart, the 14-day relative strength index (RSI) is in the positive zone (latest report 56.15), the rebound in oil prices is still slightly insufficient, resulting in poor short-term upward continuity. It is expected that the trend will fluctuate and consolidate during the day. The downward direction can consider the 25-day simple moving average of $68.16. After that, it will look to $67.07/barrel (last week's low), and the larger support is expected to extend to $65.05 (March 11 low). As for the upside, if oil pushes the price up to $70, if the breakout is expected to have a more obvious bottoming tendency, the extended target will be seen at $72.51, the 200-day moving average.
Today, you can consider going long on crude oil around 69.60, stop loss: 69.45; target: 71.20; 71.50
Spot gold
On Wednesday, gold prices remained stable at the end of the North American session, with spot gold trading around 3,020. Gold prices rose on Tuesday, supported by safe-haven demand. The uncertainty of the tariff plan to be announced by US President Trump next week may stimulate inflation. Investors are worried about the world situation, especially US policies, so they buy gold as an alternative asset because they are worried that the US government may plunge the world into a global recession. Gold prices have risen by more than 16% this year and hit a record high of $3,057.50 on March 20. Considering that the current total volume is still below the peak reached in 2020, there is still room for further increase. Gold-backed ETFs have seen outflows over the past few years. Global gold ETF holdings were essentially flat in the fourth quarter, ending the year close to where they began, even as gold prices rose 27%. Trump's tariff policy will drag on economic growth, spark further trade tensions, and push up inflation.
From the recent trend, gold's uptrend continues, despite a lack of confidence from buyers, which failed to achieve a daily close above this week's current high of $3,036, which could intensify the test of the record high of $3,057.50. A breakout of the latter would pave the way for a test of $3,100. The 14-day relative strength index (RSI), a technical indicator on the daily chart, is bullish, and momentum supports buyers. Therefore, gold prices are expected to rise further. On the other hand, a break below $3,000 would expose the February 24 high of $2,956 and $2,959.80 (20-day SMA), with a move towards $2,945.00 (50.0% Fibonacci retracement of 2,832.50 to 3,057.50). The $2,900 mark follows.
Consider going long on gold before 3,016 today, stop loss: 3,012; target: 3,038.00; 3.042.00

AUD/USD
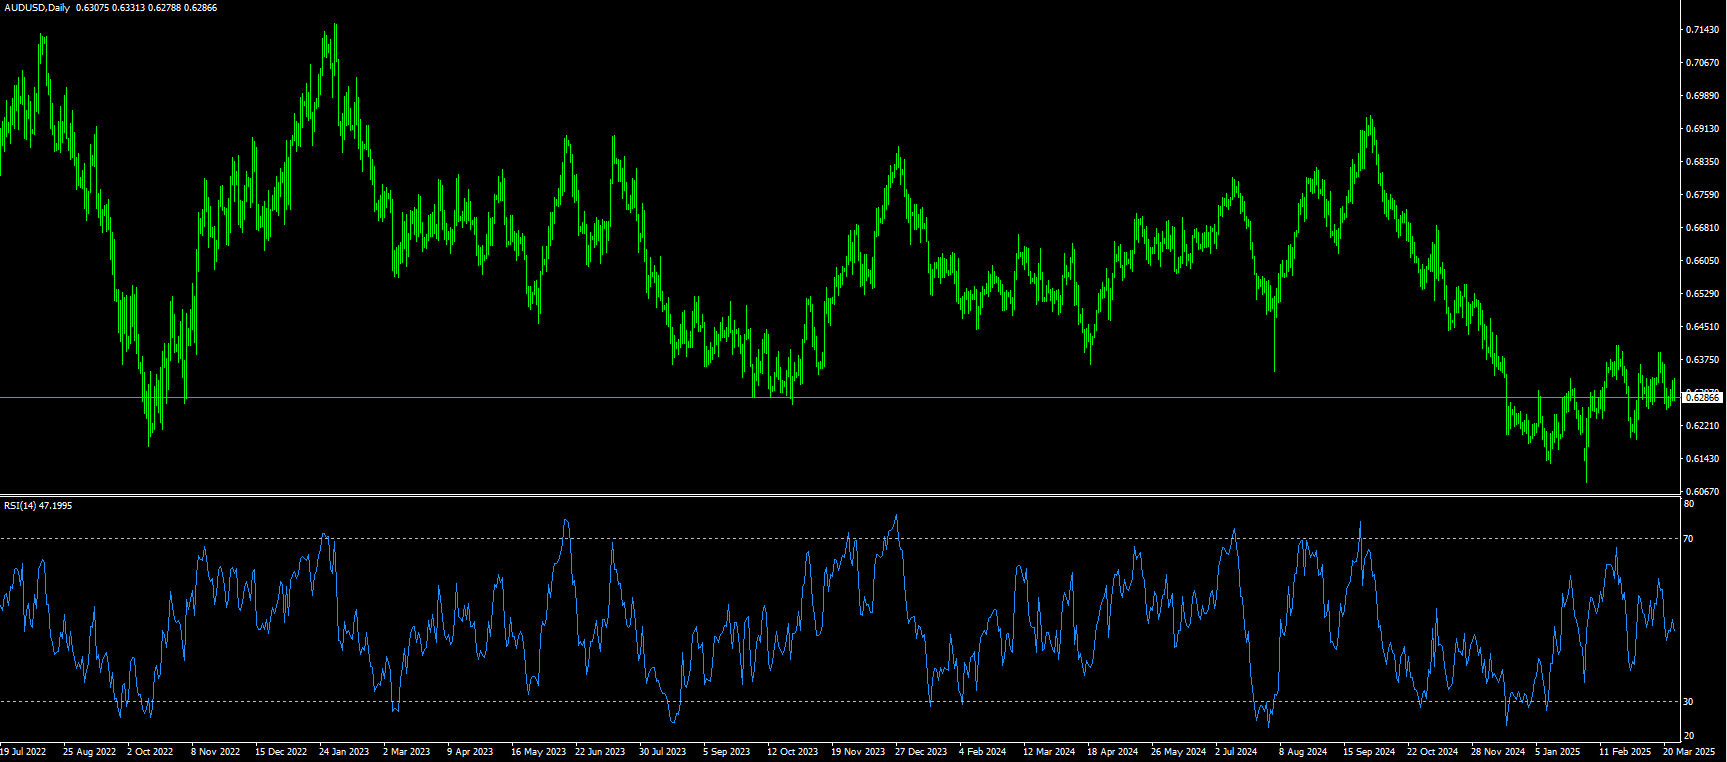
The Australian dollar hovered around recent levels on Wednesday, as sentiment shifted on the latest inflation data. The Australian dollar was flat during the North American session, fluctuating around the 0.6300 area after Australia's monthly consumer price index showed slower price growth than expected. Traders are weighing the dovish monetary policy implications of inflation data against fiscal-driven price pressures from the recent budget. The Australian dollar fell slightly against the U.S. dollar after the release of the monthly consumer price index (CPI) on Wednesday, benefiting from the surge in New York Mercantile Exchange copper futures to a record high, and Australia's position as one of the major copper exporters. Therefore, AUD/USD temporarily stabilized around 0.6300. Australian Finance Minister Jim Chalmers released the 2025/26 budget on Tuesday, outlining two rounds of key economic forecasts and tax cuts totaling about AUD17.1 billion. The tax cuts seem to be aimed at strengthening political support, and the Australian dollar has gained support. In addition, expectations of China's stimulus plan may boost Australia.
On Wednesday, AUD/USD traded around 0.6300, and technical indicators on the daily chart suggest a bearish bias as the pair consolidates within a descending channel. The 14-day relative strength index (RSI) remains around 50, reinforcing the ongoing upward momentum. The 25-day moving average is located at 0.6308, which is aligned with the upper line of the descending channel and is an immediate obstacle. A breakout of this key resistance zone could weaken the bearish bias and the pair could test 0.6352 (110-day moving average), and the monthly high of 0.6391 reached on March 18. On the downside, AUD/USD could hover around 0.6258 (last week's low), followed by the March low of 0.6225.
Consider going long AUD before 0.6288 today, stop loss: 0.6275; target: 0.6340; 0.6350.
GBP/USD
On Wednesday, the British pound depreciated against the US dollar as investors scrutinized the spring budget following lower-than-expected UK inflation data. Meanwhile, mixed US economic data provided support to the US dollar, narrowing its losses against the British pound. GBP/USD traded below 1.2900. GBP tested the lower 1.2900 area during Wednesday's European trading session, hitting a near three-week low of 1.2875, following a weak UK consumer price index report for February. The headline CPI rose 2.8% year-on-year, below expectations of 2.9% and the 3.0% increase in January. During the same period, the core CPI, which strips out volatile items, rose 3.5%, below expectations of 3.6% and the previously reported 3.7%. The monthly headline CPI rose 0.4%, while it fell 0.1% in January and failed to meet expectations of 0.5%. Meanwhile, the US dollar remained stable despite uncertainty over how the tariffs that President Trump may impose on April 2 will affect the outlook for the US economy. The US dollar index, which tracks the value of the greenback against six major currencies, rose slightly to around 104.50.
GBP/USD lost momentum after recording gains in the previous two days and traded around 1.2930 during the Asian session on Wednesday. Technical analysis on the daily chart shows a persistent bullish bias, with the pair consolidating within an ascending channel pattern. The 14-day relative strength index (RSI) is above 60, reinforcing the strong bullish momentum. However, GBP/USD has fallen below the 9-day exponential moving average, suggesting a bearish shift in short-term price momentum. GBP/USD is testing the immediate resistance of the 9-day moving average at the level of 1.2957. A rebound above this level may restore short-term price momentum, followed by the 1.2972 (Friday's high), and the 1.3000 market psychological level. Further gains may strengthen the bullish bias and support the pair to test the 1.3048 (November 6 last year high) level. On the downside, GBP/USD may fluctuate in the 1.2840 area near the lower line of the ascending channel, followed by 1.2800 (round number).
Today, we recommend going long GBP before 1.2872, stop loss: 1.2860, target: 1.2920, 1.2930

USD/JPY
During the American session on Wednesday, USD/JPY rebounded to around 150.50. The pair reversed the decline caused by US President Trump's new tariff threats and hawkish comments from the Bank of Japan, following the rebound in risk sentiment and the US dollar. The market's eyes are on US tariffs, data and Fed speeches. During the Asian session on Wednesday, the yen fell slightly after the release of Japan's service producer price index (PPI), which fell to an annual rate of 3.0% in February. This data, coupled with the generally positive tone in the stock market, weakened the safe-haven yen and pushed the USD/JPY exchange rate back to the psychological level of 150.00 in the last hour. However, any meaningful depreciation of the yen seems difficult to achieve as the market is betting that strong wage growth will support consumption and filter through to the broader inflation trend, which should allow the Bank of Japan to continue to raise interest rates. The narrowing interest rate gap between Japan and the US should provide support to the low-yielding yen, which coupled with weak US dollar price action has limited gains for USD/JPY.
From a technical perspective, this week’s breakout above the 200-hour simple moving average at 149.93 on the 4-hour chart is seen as a key trigger for bullish traders. Moreover, oscillators on the daily chart have just started to gain positive momentum, suggesting that the path of least resistance for USD/JPY is to the upside. However, the overnight failure ahead of the 151.00 mark calls for some caution. Therefore, it would be wise to wait for sustained strength and confirmation above the aforementioned mark before positioning for a continuation of the recent rebound from multi-month lows. The subsequent rise could push the spot price to the monthly high near 151.30, approaching the 152.00 round number mark. On the other hand, the 149.55 area or the overnight low seems to protect the immediate downside risk now, and a break below this area could see USD/JPY slide to the 149.00 round number mark, further testing the 148.75-148.70 support level. The latter coincides with the 100-hour simple moving average on the 4-hour chart, and a break below it could give bearish traders an advantage. Spot prices could accelerate their declines, slipping towards the 148.00 round mark, and further testing the 147.35-147.30 area, eventually falling below the 147.00 mark.
Today, it is recommended to short the US dollar before 150.75, stop loss: 150.90; target: 149.80, 149.60

EUR/USD
EUR/USD accelerated its decline, retesting lows around 1.0740, driven by a stronger dollar and lingering concerns about possible tariffs on EU imports next week. EUR/USD fluctuated around 1.0800 during Wednesday's European trading session and is still trading at a three-week low of 1.0750. Elsewhere, the outlook for major currency pairs remains uncertain as the dollar holds recent gains amid expectations that US President Trump's tariff agenda will have a smaller impact on the US economic outlook. On Monday, Trump said at the White House that all upcoming tariffs will not be imposed as he may grant tariff relief to "many countries." It looks like the leaders of various US trading partners have reached a deal with Trump. Although Trump's trade war is widely expected to lead to a global economic slowdown, a trade war with fewer countries will limit the scope of economic turmoil. Looking ahead, the main trigger for the dollar will be the US personal consumption expenditure price index (PCE) data for February, released on Friday.
From a technical perspective, EUR/USD fell below 1.0750 during Wednesday's American trading session. Currently, the pair has broken below the support of 20-day SMA at 1.0768, as well as 9-day and 14-day SMA at 1.0841 and 1.0851 respectively – all pointing downwards. The 30-day SMA also reinforces the bearish structure. However, the oscillators are sending some mixed signals. The RSI is at 52.50, reflecting neutral momentum, while the ADX is at 29, indicating moderate trend strength. Although the MACD remains above the signal line, it has turned down and is sending a slight sell signal. Meanwhile, the combined RSI/Stochastics confirm the neutral stance. From a horizontal perspective, the initial support is at 1.0700 (round number), followed by 1.0632 {34-day MA}. The overhead resistance is around 1.0800 (round number), and later on the overnight high around 1.0858 area, the bulls may face further challenges.
Today it is recommended to go long on Euro before 1.0725, stop loss: 1.0710, target: 1.0780, 1.0785.

Disclaimer: The information contained herein (1) is proprietary to BCR and/or its content providers; (2) may not be copied or distributed; (3) is not warranted to be accurate, complete or timely; and, (4) does not constitute advice or a recommendation by BCR or its content providers in respect of the investment in financial instruments. Neither BCR or its content providers are responsible for any damages or losses arising from any use of this information. Past performance is no guarantee of future results.
More Coverage


Risk Disclosure:Derivatives are traded over-the-counter on margin, which means they carry a high level of risk and there is a possibility you could lose all of your investment. These products are not suitable for all investors. Please ensure you fully understand the risks and carefully consider your financial situation and trading experience before trading. Seek independent financial advice if necessary before opening an account with BCR.

 English
 简体中文
简体中文
 繁體中文
繁體中文
 Bahasa
Melayu
Bahasa
Melayu
 Tiếng
Việt
Tiếng
Việt
 ไทย
ไทย
 日本語
日本語
 한국어
한국어
 ភាសាខ្មែរ
 español