


0
US Dollar Index
On Monday, the US dollar index continued to weaken during the European trading session, falling to around 100.00. After a sharp pullback last week, the index is currently looking for direction near key technical levels, and traders are focusing on whether important supports can be effectively maintained. The fundamental pressure facing the US dollar index mainly comes from credit rating downgrades. Moody's rating agency downgraded the US credit rating from Aaa to Aa1, consistent with previous downgrades by Fitch Ratings in 2023 and Standard & Poor's in 2011. Both consumer and producer price indices released last week indicated a slowdown in price increases. These data reinforced market expectations for further interest rate cuts by the Federal Reserve in 2025, bringing downward pressure on the US dollar. In addition, weak US retail sales data further reinforced concerns that economic growth will continue to be weak. However, the US dollar has also gained certain support factors. Market expectations for further trade agreements between the United States and relevant countries have provided positive support for the US dollar. US Treasury Secretary Bessette said Trump plans to impose previously threatened tariffs on trading partners that fail to negotiate in "good faith".
From the technical analysis of the daily chart, the US dollar index is currently at a key technical divergence point. After a sharp pullback from last week's high of 101.98, the price is currently in a shock consolidation pattern in the range of 99.17 {May 6 low}--101.05 {40-day simple moving average}. The MACD line (-0.1427) of the technical indicator is above the signal line (-0.3678), but it is still running below the zero axis as a whole. The 14-day relative strength index RSI currently reads 45.68, providing a large possibility for the future market trend. If the RSI can re-stand on the 50 mid-line, it will provide a positive signal for the bulls. The Bollinger Band indicator shows that its width has narrowed compared with the previous period, suggesting that volatility is shrinking; the upper rail of the Bollinger Band 101.50 constitutes a key resistance level in the near future. Prior to this, 100.48{34-day simple moving average}, and 101.00{round mark} are immediate resistance areas. On the other hand, if the US dollar index falls below the psychological level of 100.00, and 99.92{25-day simple moving average}, it may open the door to 99.23 {May 7 low}.
Today, consider shorting the US dollar index around 100.50, stop loss: 100.60, target: 100.05, 100.00

WTI spot crude oil
WTI crude oil traded around $62.00 per barrel on Monday, and although Iran's foreign minister said that Iran's uranium enrichment activities will continue regardless of whether a deal is reached, the uncertainty of tariffs limited the rise in oil prices. In the previous trading day, the two benchmark contracts fell by more than 2% due to the possibility that Iran's crude oil may return to the global market due to the possibility of sanctions relaxation due to the prospect of a nuclear deal. OPEC+ oil production increases and the increased likelihood of an Iran nuclear deal have reignited short trades, and in the near term, strong seasonal tourism demand will be needed in the coming months to offset the expected supply increase as geopolitics cools. The International Energy Agency (IEA) said last Thursday that global supply is expected to increase by 1.6 million barrels per day this year, 380,000 barrels per day more than previously forecast, as OPEC+ members such as Saudi Arabia lift production cuts.
The daily chart shows that the crude oil market is still limited by technical and fundamental resistance. WTI crude oil soared to a weekly high of $63.48 last week, but the 50-day simple moving average of $63.67, coupled with potential supply increases from OPEC+ and Iran, has made the short-term trend biased to the downside. At this stage, the key support for oil prices is around $60.69 {20-day simple moving average} and $60.00 {market psychological barrier}. A break below this level may trigger further selling to around $58.83 {23.6% Fibonacci rebound level from $71.98 to $54.78}. On the contrary, if oil prices stabilize above $62.50 {May 15 high}, it is not ruled out that WTI oil prices will retest last week's high of $63.48 and the 50-day simple moving average level of $63.67.
Today, consider going long on crude oil around 61.80, stop loss: 61.60; target: 63.30; 63.40

Spot gold
Gold prices are still trading in a narrow range, currently slightly higher, close to $3,235, with three major themes in play on Monday. Tensions in the Middle East are high, with Israel launching another major ground offensive. The second major driver is the bond market, where several pension funds and fixed income (bond) investors need to rebalance their positions after Moody's downgraded the US sovereign debt credit rating after the market closed on Friday. Moody's downgraded the US rating from "AAA" to "Aa1", noting that successive US governments have failed to reverse the ballooning deficit and interest costs. The last driver on Monday was a headwind for precious metals. President Trump derailed the Istanbul peace talks last week by saying on Air Force One that no agreement could be reached without his and Russian President Vladimir Putin's participation. The two presidents will discuss the matter on a call on Monday, which could create headwinds for gold prices if there is a breakout.
The 14-day relative strength index (RSI) indicator on the daily chart fell below 50, and gold broke through the lower limit of the upward channel since December, showing the accumulation of bearish momentum. On the downside, 3,200 {round number}, and $3,202 {May 1 low} are immediate support levels. If gold breaks below this level and starts using it as resistance, some support is found around 3,168.70 {50-day simple moving average}. Some follow-up selling could put gold prices at risk of accelerating back to last week's low, around the 3,120 area. It may be seen as the next support level. Looking up, the first resistance area may be at $3,250.00 (early week high), followed by $3,275.50 {10-day simple moving average}, and the psychological market level of 3,300.
Consider going long on gold before 3,226 today, stop loss: 3,222; target: 3,250; 3,260

AUD/USD
AUD/USD started the new week with a sluggish attitude and consolidated above the 0.6450 round number in the European session. Moreover, spot prices have remained stable in a familiar range over the past month or so, with traders yet to make the next directional move before looking for a new catalyst. Meanwhile, China's macro data release on Monday could provide some momentum to the AUD/USD pair and allow traders to take advantage of short-term opportunities. However, the immediate market reaction is more likely to be limited as the focus remains on the key Reserve Bank of Australia policy decision on Tuesday. The easing of the US-China trade war has eased market bets on more aggressive policy easing by the RBA. Nevertheless, the policy outlook will affect the Australian dollar and determine the next directional move of the AUD/USD. The shift in global risk sentiment - as shown by the widespread weakness in the stock market - is seen as limiting the upside of the Australian dollar as the risk of key central bank events approaches.
From a technical perspective, the AUD/USD is trading in a range of 0.6350 {close to the weekly low} to 0.6500 {round mark}, reflecting mixed momentum signals. Technical indicators on the daily chart, the 14-day relative strength index (RSI) remains within the 55.60 range, indicating neutral momentum, while the moving average convergence/divergence (MACD) shows mild selling pressure. However, both the Williams Index (14) and the Commodity Channel Index (20) reflect balanced market conditions, reinforcing the range-bound behavior of the currency pair. Currently, the currency pair is testing the support level of the 20-day simple moving average near 0.6415. Once it falls below 0.6415, and 0.6400 {round-number mark}, further downside levels will be seen at 34-day {0.6347} and 0.6300 {market psychological mark}. On the upside, the immediate resistance level is near 0.6478 {May 13 high}, followed by 0.6500 mark and 0.6515 {six-month high set on December 2, 2024}.
Today, we recommend going long on the Australian dollar before 0.6445, stop loss: 0.6430, target: 0.6485, 0.6500

GBP/USD
GBP/USD rose to around 1.3400 on Monday, the highest level in a week, as investors were optimistic about important UK economic data and a major political breakthrough with the European Union. The market is closely watching Thursday's flash Purchasing Managers' Index (PMI) data, which is expected to shrink less in the manufacturing industry and decline more moderately in the service industry. Inflation is expected to rise to 3.3% in April, the highest level in 14 months, and the core consumer price index (CPI) may reach 3.6%. Retail sales are expected to grow by 0.4%, continuing the four-month growth momentum, although consumer confidence is fragile. Another factor supporting the pound is that the UK and the EU reached a landmark agreement to reset their post-Brexit relationship. The agreement includes cooperation on energy, defense and mutual fishing rights, and lasts until 2038. Meanwhile, the dollar weakened after Moody's unexpectedly downgraded the US government's credit rating, citing concerns about rising debt.
GBP/USD rose to around 1.3400 on Monday, the highest level in a week. The pair remains above the 20-day simple moving average, currently around 1.3310, indicating a bullish short-term trend. The 14-day relative strength index (RSI) of the daily chart is pointing upward at 59.00. If the RSI breaks above 60.00, new bullish momentum will emerge. On the upside, the three-year high of 1.3445 will be a key obstacle for the pair. A breakout will point to the psychological market level of 1.3500. Looking down, the 20-day simple moving average of 1.3310, and 1.3300 {market psychological level} will serve as major support areas. A break below the above support will point to the 1.3247 {30-day simple moving average} level.
Today's recommendation is to go long GBP before 1.3350, stop loss: 1.3340, target: 1.3400, 1.3410

USD/JPY
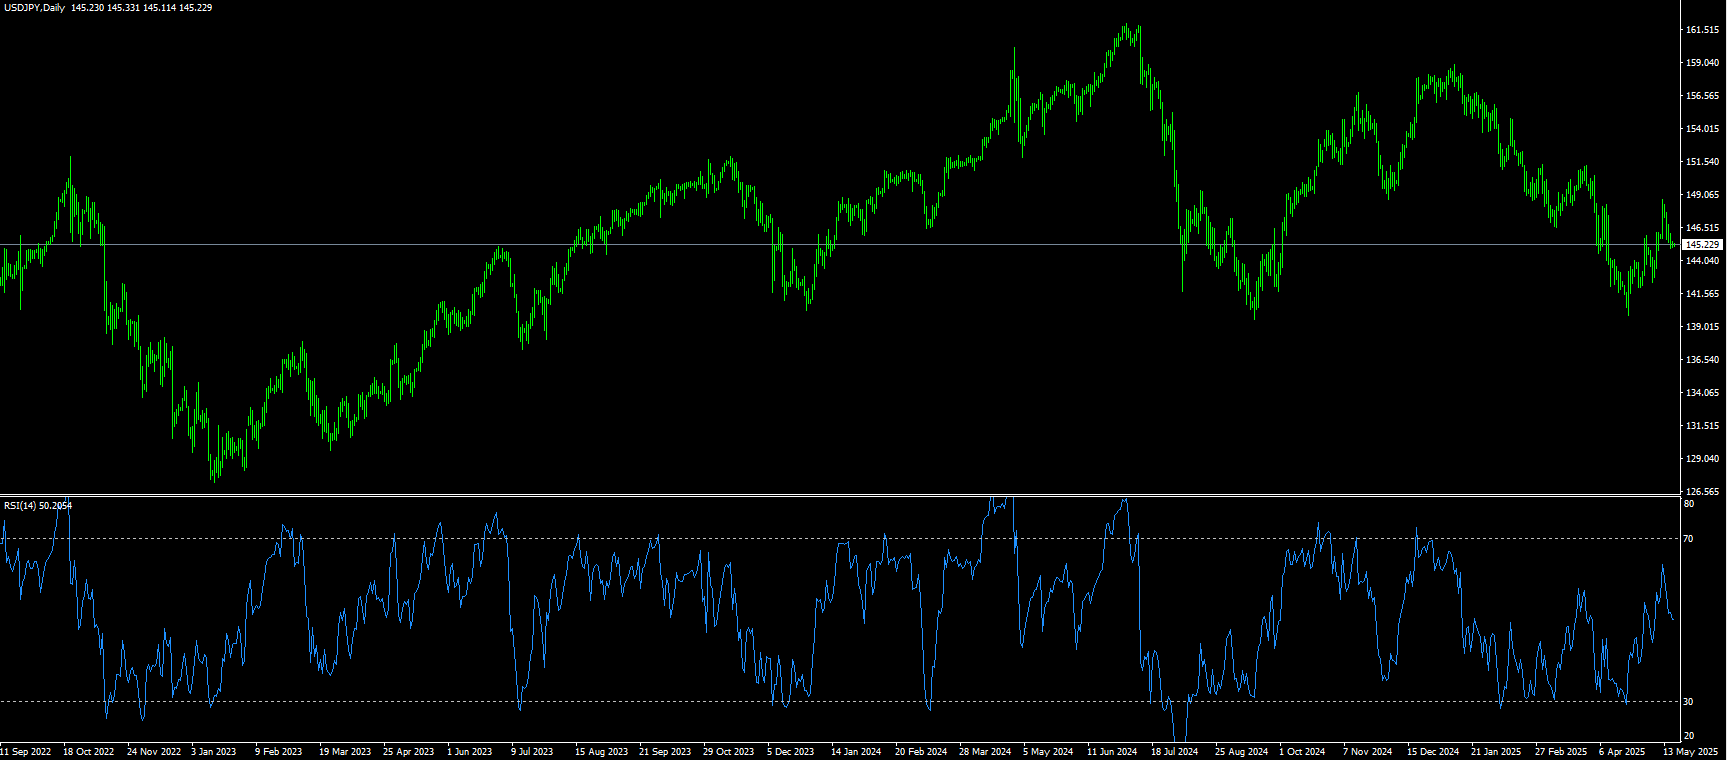
The yen rose to a near one-week high of 144.66 against the dollar on Monday, strengthening for the fifth consecutive trading day as the dollar weakened after Moody's downgraded its credit rating. Last Friday, the agency downgraded the US credit rating from Aaa to Aa1, citing a deteriorating fiscal outlook and "lack of effective policy actions" to deal with the growing deficit. Domestically, the latest data showed that Japan's economy shrank in the first quarter of 2025, with GDP falling more than market expectations, marking the first economic contraction in a year. Investors will now turn their attention to the upcoming Japanese trade data as the impact of the upcoming US tariff measures looms. In recent developments, Prime Minister Shigeru Ishiba reiterated that Japan will not accept any preliminary agreement that does not include automobile provisions and urged the United States to remove its 25% tariff on Japanese cars.
From a technical perspective, the 14-day relative strength index (RSI) on the daily chart has just started to turn negative {48.46}, suggesting that the path of least resistance for USD/JPY remains to the downside. However, it would be wise to wait for confirmation below the 145.00 psychological level before initiating a position for further declines. The pair could slide towards the 144.55 area, representing a breakout point of the 200-hour simple moving average resistance on the 4-hour chart. Next is the 144.27 {50.0% Fibonacci retracement level of the 139.89 to 148.65} area, which, if decisively broken, should pave the way for the continuation of the downward trajectory to the 144.00 {round number}, and 143.45 {May 8 low}, and 143.24 {61.8% Fibonacci retracement} levels. On the other hand, the Asian session highs were around the 145.70 area, which now seems to act as an immediate barrier before the 146.00 round number. Any further gains may be considered as selling opportunities near 146.58 {23.6% Fibonacci retracement}. However, a sustained break above the latter may trigger a short-term covering rally and push the USD/JPY pair above the 147.00 mark.
Today, it is recommended to short the US dollar before 145.00, stop loss: 145.20; target: 144.00, 143.80
EUR/USD
The EUR/USD pair surged to a near one-week high of 1.1288 during the European trading session on Monday. The major currency pair strengthened amid the decline of the US dollar due to the downgrade of the US sovereign credit rating. The US dollar index, which tracks the value of the US dollar against six major currencies, slipped to near 100.00. On Friday, Moody's downgraded the United States' long-term issuer and senior unsecured ratings from Aaa to Aa1. The downgrade was due to the growing fiscal problems, which market experts believe the government cannot solve in the short term. The decline in US credit has led to a sharp rise in Treasury yields, with investors discounting risk premiums. The 10-year US Treasury yield rose 2.3% to nearly 4.54%, while optimism about a potential trade deal between the United States and China is expected to support the US dollar.
EUR/USD surged to a near one-week high of 1.1288 at the beginning of this week. The short-term outlook for the currency pair has turned bullish as it has managed to stay near the 34-day simple moving average, around 1.1226. The 14-day relative strength index (RSI), a technical indicator on the daily chart, rebounded strongly above 53.00 after sliding to nearly 40.00, indicating that bullish momentum is strengthening. Looking up, if there is some follow-up buying, leading to a subsequent break above the 1.1300 {round mark} level, it will negate the negative bias and trigger short-term covering. EUR/USD may break through an intermediate resistance level of 1.1350 and recapture the 1.1400 round mark. A breakout will point to the April 29 high of 1.1425 as the main resistance for the pair. On the other hand, 1.1214 {35-day simple moving average} may provide some support before the 1.1200 round mark. The next level will directly point to the 1.1161 {40-day simple moving average} level.
Today, it is recommended to go long on the euro before 1.1230, stop loss: 1.1218, target: 1.1280, 1.1285.

Disclaimer: The information contained herein (1) is proprietary to BCR and/or its content providers; (2) may not be copied or distributed; (3) is not warranted to be accurate, complete or timely; and, (4) does not constitute advice or a recommendation by BCR or its content providers in respect of the investment in financial instruments. Neither BCR or its content providers are responsible for any damages or losses arising from any use of this information. Past performance is no guarantee of future results.
More Coverage


Risk Disclosure:Derivatives are traded over-the-counter on margin, which means they carry a high level of risk and there is a possibility you could lose all of your investment. These products are not suitable for all investors. Please ensure you fully understand the risks and carefully consider your financial situation and trading experience before trading. Seek independent financial advice if necessary before opening an account with BCR.

 English
 简体中文
简体中文
 繁體中文
繁體中文
 Bahasa
Melayu
Bahasa
Melayu
 Tiếng
Việt
Tiếng
Việt
 ไทย
ไทย
 日本語
日本語
 한국어
한국어
 ភាសាខ្មែរ
 español