


0
US Dollar Index
On Tuesday, the US dollar index fell to 100.03, a nearly two-week low. The US dollar fell broadly this week, hitting more than a week low against safe-haven currencies such as the yen, Swiss franc and euro, under pressure from trade tensions, as the US government's unexpected credit rating downgrade late last Friday. At the same time, concerns about the US economic and fiscal outlook resurfaced, affecting market sentiment. Traders also continued to focus on potential progress in global trade negotiations. Over the weekend, Treasury Secretary Scott Bessant reiterated that President Trump intends to impose tariffs at the rates threatened last month on trading partners that fail to negotiate in "good faith." Adding to fiscal anxiety, Moody's downgraded the US rating from Aaa to Aa1 on Friday, citing rising government debt levels and a widening budget deficit. Concerns were further exacerbated by the approval of President Trump's tax cut proposal, which includes new tax cuts without corresponding spending cuts.
From the technical analysis of the daily chart, the US dollar index is currently at a key technical divergence point. The index is currently consolidating in the 99.20-101.00 range after a sharp retracement from the 110.18 high in early January to the 97.91 low. The intraday volatility is not large, and the 14-day relative strength index (RSI) of the technical indicators is around 46, indicating neutral to soft momentum, while the moving average convergence/divergence (MACD) shows a slight buy signal. Momentum (10) hovers around zero, with a bearish bias. The 20-day simple moving average supports the buying bias, but the 100 and 200-day simple moving averages point to long-term sell signals. Resistance levels are 100.59 {day simple moving average} and 100.95 {Monday high}. Key support levels are 100.00 {market psychological level}, and 99.61 {May 8 low}.
Today, consider shorting the US dollar index around 100.18, stop loss: 100.30, target: 99.70, 99.60

WTI spot crude oil
WTI crude oil traded around $62.00 during the European trading session on Tuesday. WTI prices rose slightly as the negotiations between the United States and Iran on the nuclear program showed signs of breakdown, while Moody's downgraded the US national credit rating. Last Sunday, US envoy Steve Witkoff stressed that any new US-Iran agreement must include an agreement not to enrich uranium, which could lead to the development of nuclear weapons. Iran has stated that its nuclear energy program is entirely for peaceful purposes. The stagnation of US-Iran nuclear negotiations supported WTI prices. On the other hand, Moody's downgraded the US credit rating from "AAA" to "AA1" citing the failure of successive US governments to reverse the ballooning deficit and interest costs. This has raised questions about the health of the economy of the world's largest oil consumer, which may exert some selling pressure on crude oil. In addition, the slowdown in retail sales in China, the world's largest oil importer, may have a downward impact on WTI prices.
From the daily chart, WTI crude oil has been rising slowly along the rising channel since it rebounded from the low of $55.14 in early May, but encountered obvious resistance near the 50-day simple moving average of $63.60 and $64.00 {integer mark}. The current price is trading above the 20-day simple moving average of $60.63, while the 5-day and 10-day moving averages are in a bullish arrangement, indicating that the short-term trend is still upward. However, although the MACD technical indicator maintains a golden cross, the red column momentum has shown signs of top divergence, and the 14-day relative strength index (RSI) indicator has also returned to the positive area above 50, indicating that the upward momentum has begun to increase. If the 50-day simple moving average of $63.60 is effectively broken through and stabilized during the day, the upper target will point to the obvious resistance near the $64.00 {integer mark}. If it falls back below the $61.01 {25-day simple moving average}, and the $61.00 {round mark} support, it may return to $60 {market psychological mark} or even $58.83 {23.6% Fibonacci rebound level from $71.98 to $54.78} level.
Today, consider going long on crude oil around 62.00, stop loss: 61.80; target: 63.50; 63.60

Spot gold
Gold rose 2% to above $3,295 an ounce on Tuesday, boosted by a weaker dollar and geopolitical uncertainties. The dollar fell further after the Federal Reserve issued a cautious tone on the economy and downgraded the U.S. credit rating to Aa1, citing the growing debt burden. A weaker dollar makes gold more attractive to international buyers, boosting demand. Investor sentiment was further shaken after continued uncertainty over U.S. tariff policy and a key vote on President Trump's comprehensive tax cut plan. Trump's statement that Ukraine and Russia will "immediately" begin ceasefire negotiations, which may not require the participation of the United States, also led to safe-haven inflows. The new sanctions imposed by the European Union and the United Kingdom on Russia have exacerbated the tense global background, increasing the appeal of gold.
From the daily chart, the price of gold is trading above the $3,248 {34-day simple moving average}, and finally broke through the 30-day simple moving average {latest at 3272} in the last five trading days. This indicates that the short-term trend is to test the high upward. On the other hand, the 14-day relative strength index (RSI) indicator of the technical indicator rose above 50, showing the accumulation of bullish momentum. Therefore, on the downside, some support was found near the $3,248 {34-day simple moving average}. Some follow-up selling may put the price of gold at risk of accelerating back to the $3,200 {round mark} area. It may be regarded as the next support level. Conversely, for bullish continuation to occur, gold must break above $3,300 {market psychological barrier}, so that buyers can challenge around $3,324 {May 12 high} level. The next level points to the $3,350 barrier.
Consider going long on gold before 3,285 today, Stop Loss: 3,280; Target: 3,320; 3,325

AUD/USD
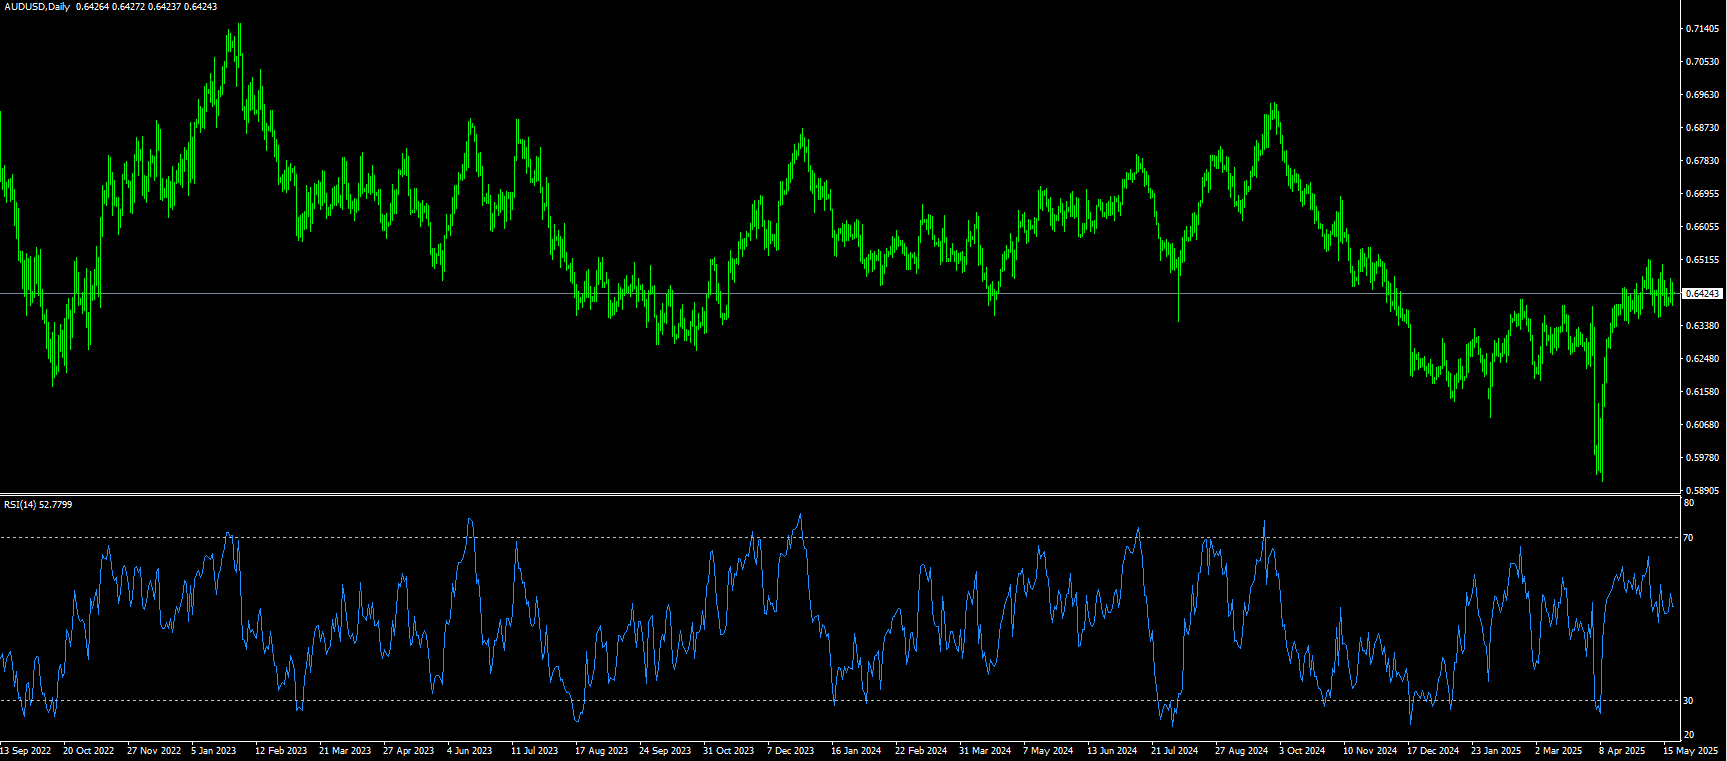
The Australian dollar fell slightly against the US dollar on Tuesday. AUD/USD continued to be under pressure after the People's Bank of China announced a reduction in the loan market rate (LPR). Given the close trade relationship between Australia and China, any changes in the Chinese market may have a significant impact on the Australian dollar. The Australian dollar continued to weaken due to the increasing political turmoil in Australia. The opposition coalition split after the National Party withdrew from the coalition with the Liberal Party. Meanwhile, the ruling Labor Party returned to power with a stronger and broader mandate, taking advantage of the chaos within the opposition. The market's focus now turns to the Reserve Bank of Australia's upcoming interest rate decision later in the day. The central bank is expected to cut interest rates by 25 basis points following last week's stronger-than-expected employment data. In addition, the risk-sensitive Australian dollar was supported by optimism over the 90-day US-China trade truce and hopes for further trade deals with other countries.
AUD/USD traded near 0.6420 on Tuesday, with technical indicators on the daily chart pointing to a bullish bias. While the 14-day relative strength index (RSI) remains above 55, suggesting sustained upward momentum. The pair remains above the 20-day simple moving average of 0.6418, and on the upside, immediate resistance lies at 0.6500 {round number}, and the six-month high of 0.6515 set on December 2, 2024. On the other hand, support initially emerges at the round number of 0.6400, followed by the 34-day simple moving average near 0.6351. A clear break below these levels could weaken the short- to medium-term outlook, potentially triggering a deeper correction towards 0.6300.
Today, we recommend going long on AUD before 0.6405, stop loss: 0.6400, target: 0.6455, 0.6460
GBP/USD
GBP/USD maintained its upward momentum for the second consecutive trading day, hovering just below 1.3400 during the Asian session on Tuesday. The pound strengthened as the dollar retreated after Moody's downgraded the US credit rating from Aaa to Aa1. The downgrade reflects concerns about surging debt servicing costs, growing welfare spending and falling tax revenues. Last week's US economic data added pressure on the dollar, with inflation indicators such as CPI and PPI suggesting easing price pressures. These trends have raised market expectations for further Fed rate cuts in 2025. In addition, weaker-than-expected US retail sales data heightened concerns about prolonged economic weakness. Investors turned their attention to the UK's April CPI report, which is due on Wednesday, for insights on the direction of the Bank of England's policy.
Despite an early bullish push at the start of the new trading week, buying of the pound remained limited. Headlines continue to dominate most of the market action. 1.3400 remains a solid dividing line that buyers are either unable or unwilling to cross, and once GBP/USD breaks above 1.3400, the rally is expected to continue. Momentum supports buyers, while the 14-day relative strength index (RSI) remains bullish, suggesting that they are gaining momentum. Therefore, further gains target the key barrier of 1.3445 {three-year high}. A break of the latter will expose to 1.3500. Conversely, looking down, the 20-day simple moving average of 1.3312, and 1.3300 {market psychological level} will act as major support areas. A break below the above support will target the 1.3250 {last Friday's low} level.
Today, we recommend going long on GBP before 1.3370, stop loss: 1.3358, target: 1.3420, 1.3430

USD/JPY
On Tuesday, the yen generally retreated, helping USD/JPY fall to the 144.00 level before the latest close at 144.55. The unexpected downgrade of the US government's credit rating last Friday appears to have had a mild impact on global risk sentiment. This is evident from the generally positive tone in the stock market, which is seen as a key factor in weakening the safe-haven demand for the yen. However, any significant yen decline seems difficult to achieve as the market increasingly accepts that the Bank of Japan will raise interest rates again in 2025. In contrast, the Federal Reserve is expected to further reduce borrowing costs amid signs of easing inflationary pressures and weak economic growth prospects. This in turn may limit attempts by the dollar to rise and provide support for the low-yielding yen, thereby limiting gains in USD/JPY.
From a technical perspective, USD/JPY’s break below 145.27 {38.2% Fibonacci retracement level from 139.89 to 140.65} this week was recognized, which is favorable for the shorts of the pair. Therefore, any subsequent gains may still be seen as selling opportunities and remain limited until the 146.00 round number mark. However, a sustained strong break above this level may trigger short-term covering and push the spot price to 146.56 {23.6% Fibonacci retracement level} level, and then approach the 147.00 mark. On the other hand, 144.23 {50.0% Fibonacci retracement level} now seems to be restraining the short-term downside. A valid break below will be seen as a new trigger point for short traders and drag USD/JPY below the 144.00 round number mark, approaching the next relevant support level of 143.18 {61.8% Fibonacci retracement level}.
Today, we recommend shorting the dollar before 144.75, stop loss: 145.00; target: 143.50, 143.20

EUR/USD
EUR/USD retreated slightly after testing the high of 1.1288 at the beginning of the week, although the currency pair still ended the day's trading at a higher price overall. However, the euro is still trapped in a short-term consolidation range. Last Friday, Moody's rating agency downgraded the United States' rating, canceling its last AAA rating for national debt, citing the increase in US debt and long-term government deficits that successive presidential administrations have either ignored or failed to manage effectively. Although investors reacted shakily at first, sentiment stabilized quickly and the impact on the US credit rating was largely ignored. This week, Federal Reserve officials actively worked to manage market expectations for potential rate cuts. Fed policymakers have repeatedly reminded investors that US tariffs and trade policies complicate forecasts for the domestic economy, thereby affecting adjustments to the policy rate.
The technical indicators of the daily chart, 14-day relative strength index (RSI) is around 50, indicating neutral momentum, while the moving average convergence/divergence (MACD) still points to selling pressure, highlighting the potential for short-term consolidation. It indicates that the currency pair may maintain its recent gains. Moving averages paint a more supportive long-term outlook. The 10-day simple moving average is currently in line with the bullish sentiment, while the 100-day and 200-day simple moving averages confirm the broader upside bias. Conversely, the 20-day simple moving average remains in the selling zone, which may pose resistance to the currency pair's rebound. Immediate support is around 1.1200 {round number}, and additional support is at 1.1132 {45-day simple moving average} level. On the upside, resistance may appear at 1.1288 {early week high}, followed by the psychological market level of 1.1300. Broader resistance extends to 1.1381 {May 6 high) level, and provides a broader context for potential breakout scenarios.
Today, we recommend going long on Euro before 1.1265, stop loss: 1.1252, target: 1.1320, 1.1330.

Disclaimer: The information contained herein (1) is proprietary to BCR and/or its content providers; (2) may not be copied or distributed; (3) is not warranted to be accurate, complete or timely; and, (4) does not constitute advice or a recommendation by BCR or its content providers in respect of the investment in financial instruments. Neither BCR or its content providers are responsible for any damages or losses arising from any use of this information. Past performance is no guarantee of future results.
More Coverage


Risk Disclosure:Derivatives are traded over-the-counter on margin, which means they carry a high level of risk and there is a possibility you could lose all of your investment. These products are not suitable for all investors. Please ensure you fully understand the risks and carefully consider your financial situation and trading experience before trading. Seek independent financial advice if necessary before opening an account with BCR.

 English
 简体中文
简体中文
 繁體中文
繁體中文
 Bahasa
Melayu
Bahasa
Melayu
 Tiếng
Việt
Tiếng
Việt
 ไทย
ไทย
 日本語
日本語
 한국어
한국어
 ភាសាខ្មែរ
 español