


0
US Dollar Index
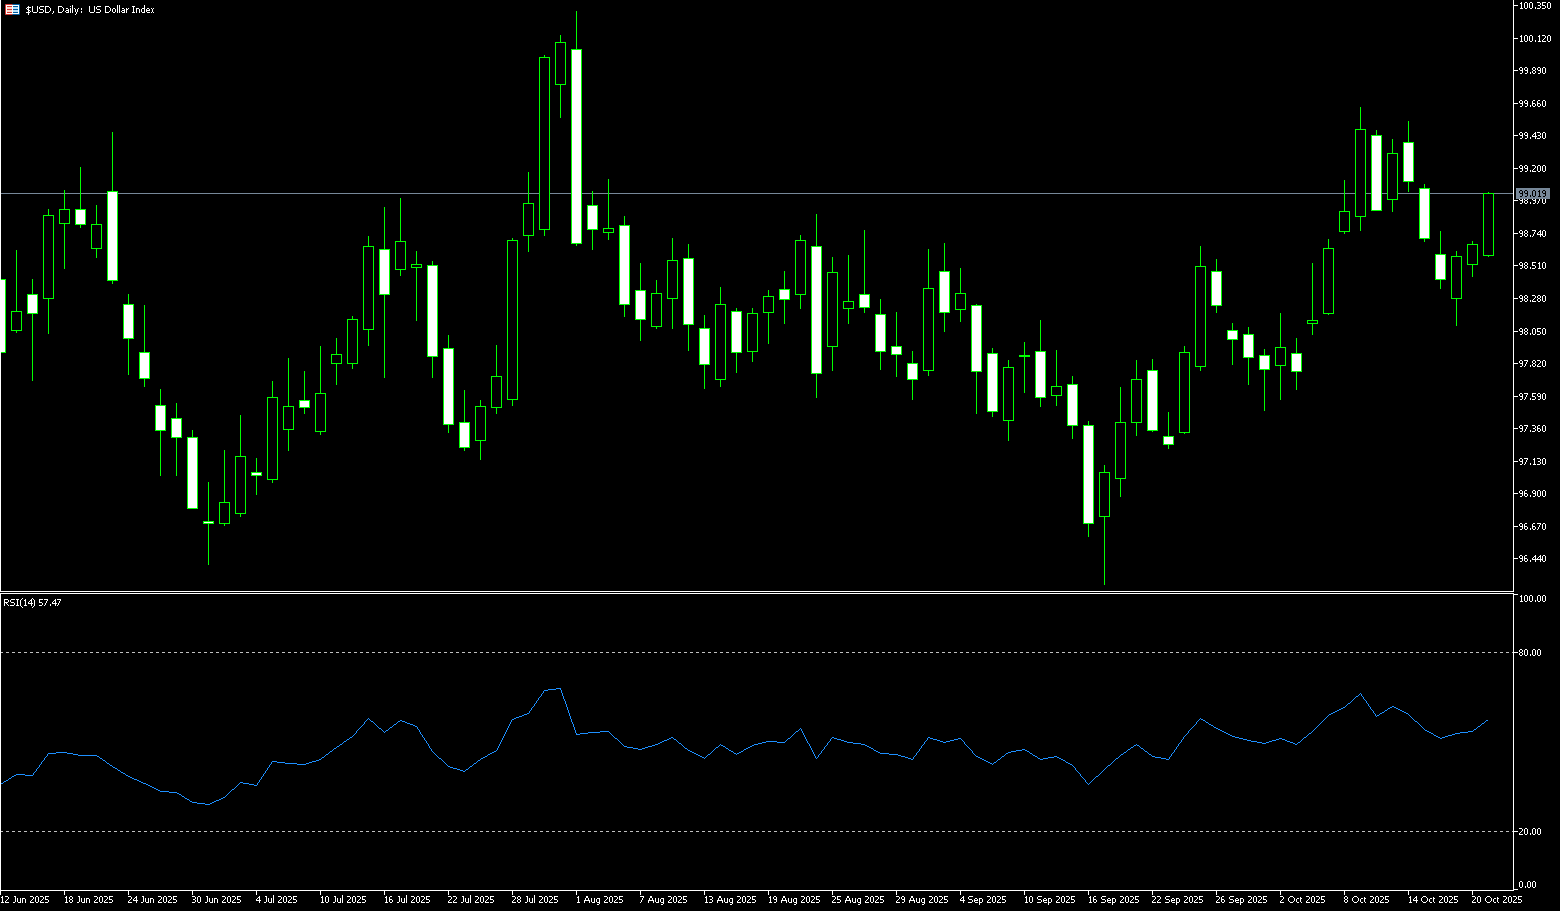
The US dollar index remained around 98.90 on Tuesday, trading sideways so far this week as investors continue to assess the impact of the ongoing government shutdown, trade-related, and monetary policy uncertainties on the US economic outlook. National Economic Council Director Kevin Hassett indicated that the shutdown could end this week, boosting hopes for an end to the economically devastating shutdown. On the trade front, President Trump stated that he expects to reach a fair trade agreement with Chinese President Xi Jinping in South Korea later this month. Meanwhile, investors await Friday's September CPI report, whose release is limited by the shutdown. The Federal Reserve is widely expected to cut interest rates by 25 basis points next week, with further cuts possible in December and next year.
In the early part of this week, the US dollar index's rebound has struggled to break above 99.08 (the October 15 high) and 99.00 (the round-figure mark), with trader activity indicating strong resistance at these levels. The dollar's continued lack of upward momentum, coupled with the intertwined influence of political factors and falling yields, suggests the dollar may face bearish pressure in the short term. If it fails to reclaim this level, market attention will shift to the 25-day simple moving average of 98.20 and the psychologically important 98.00 area. Unless upcoming CPI data or guidance from the Federal Open Market Committee alters the overall market narrative, the US dollar index will have a chance to challenge the 99.08 (October 15 high) and the 99.00 area, potentially heading towards the 99.56 level, a near two-month high.
Consider shorting the US Dollar Index at 99.05 today, with a stop-loss at 99.16 and targets at 98.60 and 98.50.
WTI Spot Crude Oil
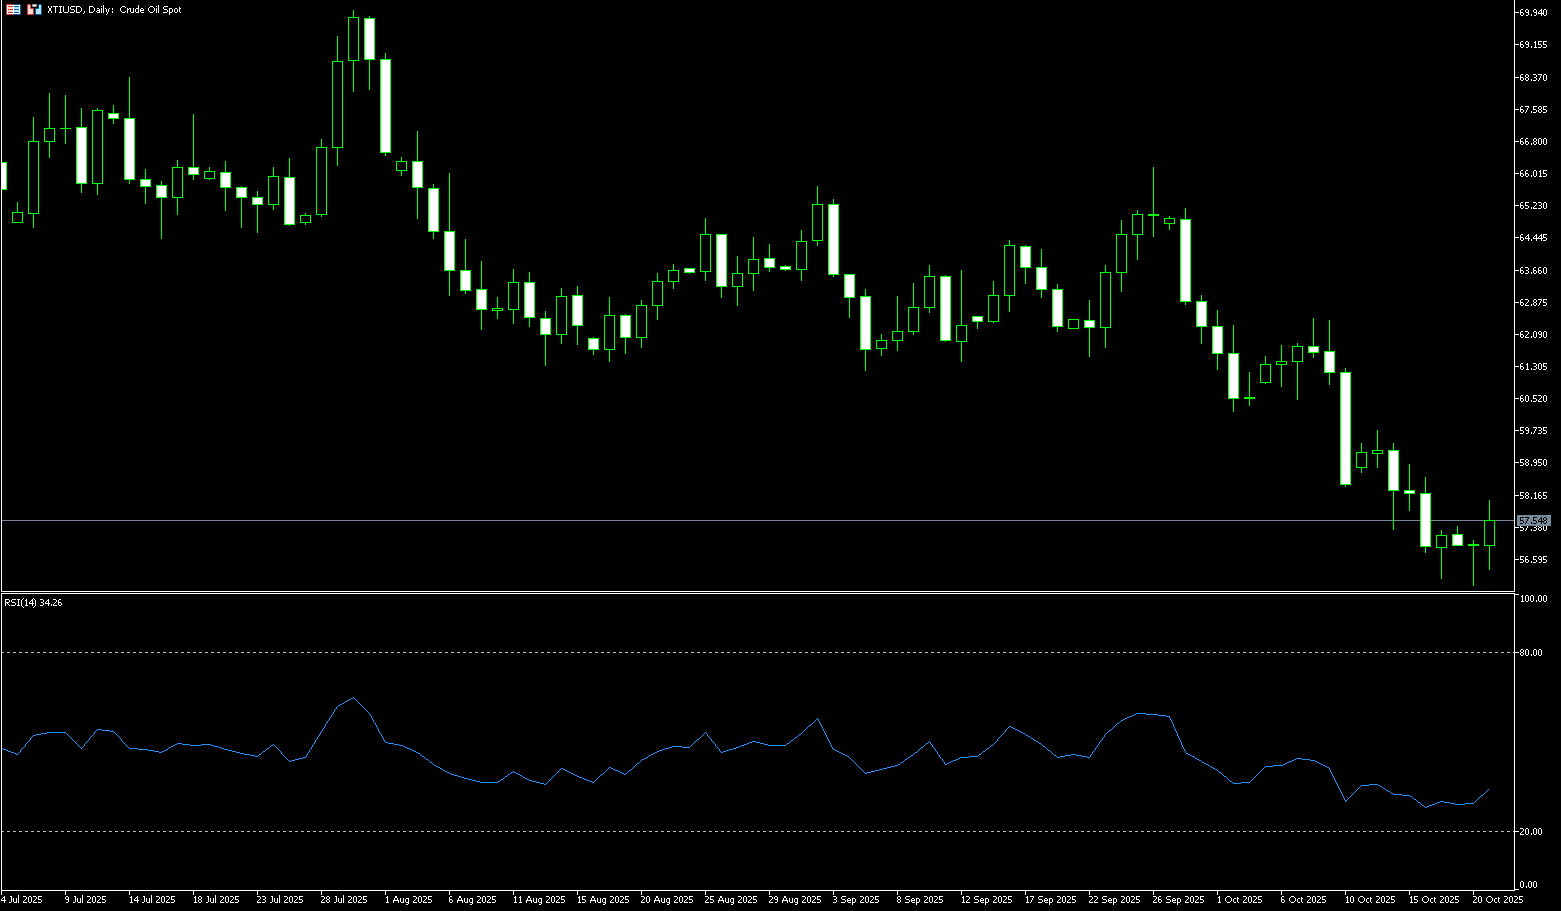
US crude oil is trading around $57.50 per barrel, closing on Monday at its lowest level since early May. Investors are weighing the possibility of a global oversupply, coupled with trade tensions that are exacerbating concerns about an economic slowdown and weakening energy demand. The futures structure of Brent crude, the global benchmark, suggests traders' concerns have shifted from undersupply to oversupply. Oversupply concerns are gripping the market, especially looking ahead to 2026. Floating storage is expected to rise, and inland tanks are also expected to fill up. This represents a truly bearish narrative not seen in a while. Furthermore, the primary trend for oil prices over the next two to four months is a decline to around $50 per barrel. Meanwhile, the potential for a rise in US crude oil inventories is a potential stabilizing factor. Besides the excess offshore crude oil, inventory levels elsewhere in the world are broadly similar to those in the US.
Oil prices have been in a downward trend for over three years. At the start of October, the decline accelerated as oil prices approached $55. In the short term, oil prices could reach a new low until 2025, coinciding with the lower limit of a 160-year historical trendline that consistently defines crude oil's long-term cyclical movements. The daily RSI indicator is approaching oversold levels for the first time since April 2025, suggesting that downward momentum may be fading. On the downside, the current lows of $55.14 (2025 support) and $54.78 (a near four-year low) remain valid. A break below these levels could extend the decline to around $49, a level that coincides with the lower limit of the channel and could form new support. On the upside, if oil prices recover above the resistance levels of $58.00 (round-number mark) and $58.08 (9-day moving average), bullish rallies could extend towards the psychologically important $60 level, respectively.
Consider going long on crude oil at 57.35 today. Stop loss: 57.18, target: 5920, 59.50.
Spot Gold
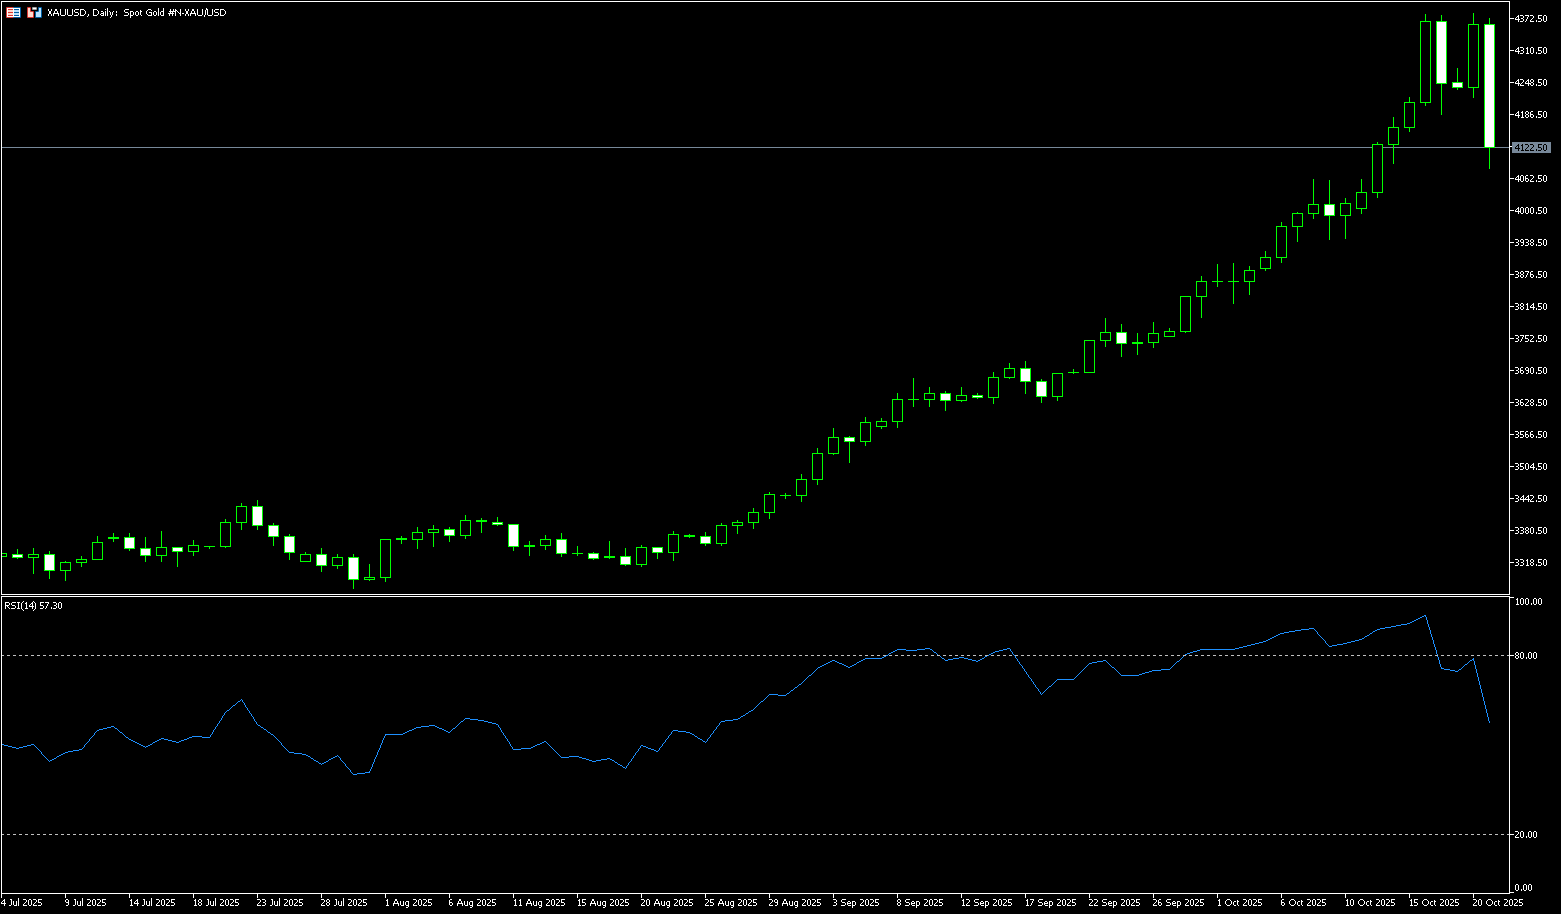
Gold prices plummeted as much as 6.0% on Tuesday to approximately $4,086 per ounce, marking their biggest single-day drop since April 2013. They had previously hit an all-time high of $4,382 on Monday. The price decline was driven by a strengthening dollar, accelerating profit-taking, and a weakening of safe-haven demand amid improving global sentiment. With US-China trade tensions easing, Presidents Trump and Xi Jinping plan to meet next week to resolve the tariff dispute and avoid further escalation. The end of India's seasonal gold buying spree also weighed on physical demand. Despite the pullback, gold remains up 55% year-to-date, supported by expectations of further Federal Reserve easing and continued demand for safe-haven assets.
Gold prices plummeted as much as 6.0% to around $4,086 per ounce on Tuesday, marking their biggest one-day drop since April 2013, after reaching an all-time high of $4,391.60 on Monday. However, a bearish "piercing" pattern formed on Friday, a chart signal suggesting a short-term top may have formed. Despite this, the correction in gold prices remains, offering buyers a better entry point. The first support level lies at $4,100, followed by the previous all-time high-turned-support level at $4,059. If the spot price breaks below this level, the next target would be the 20-day simple moving average at $4,002.60. Conversely, if buyers push gold above $4,200, this would open the way to challenges at $4,250 and $4,300, followed by the all-time high at $4,391.60.
Consider going long on gold at 4,115 today, stop loss: 4,110, target: 4,150, 4.160
AUD/USD
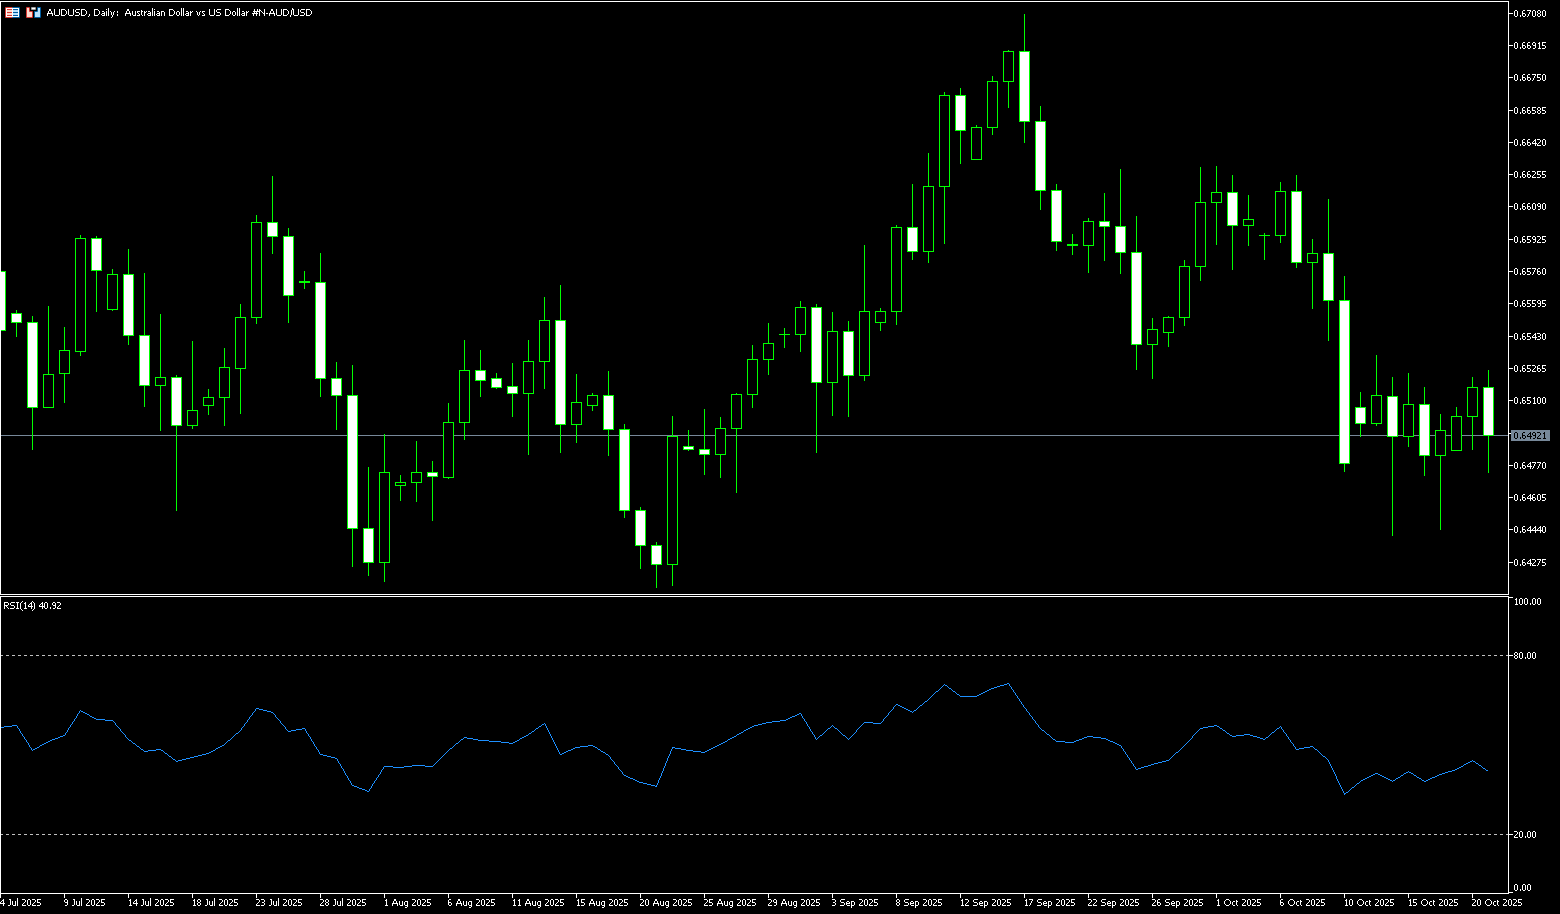
The Australian dollar fell to around $0.6485 on Tuesday, snapping a two-day rally despite optimism about a breakthrough in the US-Australia trade deal. The two countries recently signed a critical minerals partnership, which US President Donald Trump and Australian Prime Minister Anthony Albanese positioned as a key step in reducing US dependence on China. This follows Beijing's tightening of export controls on its own supplies of critical minerals. Albanese said the agreement takes the US-Australia alliance to the "next level," noting that while cooperation has been ongoing since Trump's first term, this latest agreement represents a significant step forward in strengthening the relationship. Funding will support a portfolio of "shovel-ready projects" worth US$8.5 billion (A$13 billion) aimed at expanding Australia's mining and processing capacity. Domestically, investors now await quick Purchasing Managers' Index data and speeches by Reserve Bank of Australia officials later this week.
On Tuesday, AUD/USD was trading around 0.6500. Technical analysis of the daily chart suggests a persistent bearish bias as the pair trades below the 0.6538 (14-day simple moving average). The 14-day RSI remains below 45, reinforcing the bearish outlook. On the downside, AUD/USD could face resistance at the lower Bollinger Band level of 0.6455, a break of which could lead to a four-month low of 0.6414. A further break below this confluence support area would strengthen the bearish bias and push the pair towards a test of the five-month low of 0.6372. On the other hand, AUD/USD is testing the immediate hurdle of 0.6538 (14-day simple moving average), followed by the October 10 high of 0.6572 and the upper boundary of the descending channel around 0.6570. A break above this resistance area would improve short- and medium-term price momentum, pushing the pair towards the psychological level of 0.6600.
Consider a long position on the Australian dollar at 0.6475 today, with a stop-loss of 0.6462 and targets of 0.6520 and 0.6530.
GBP/USD
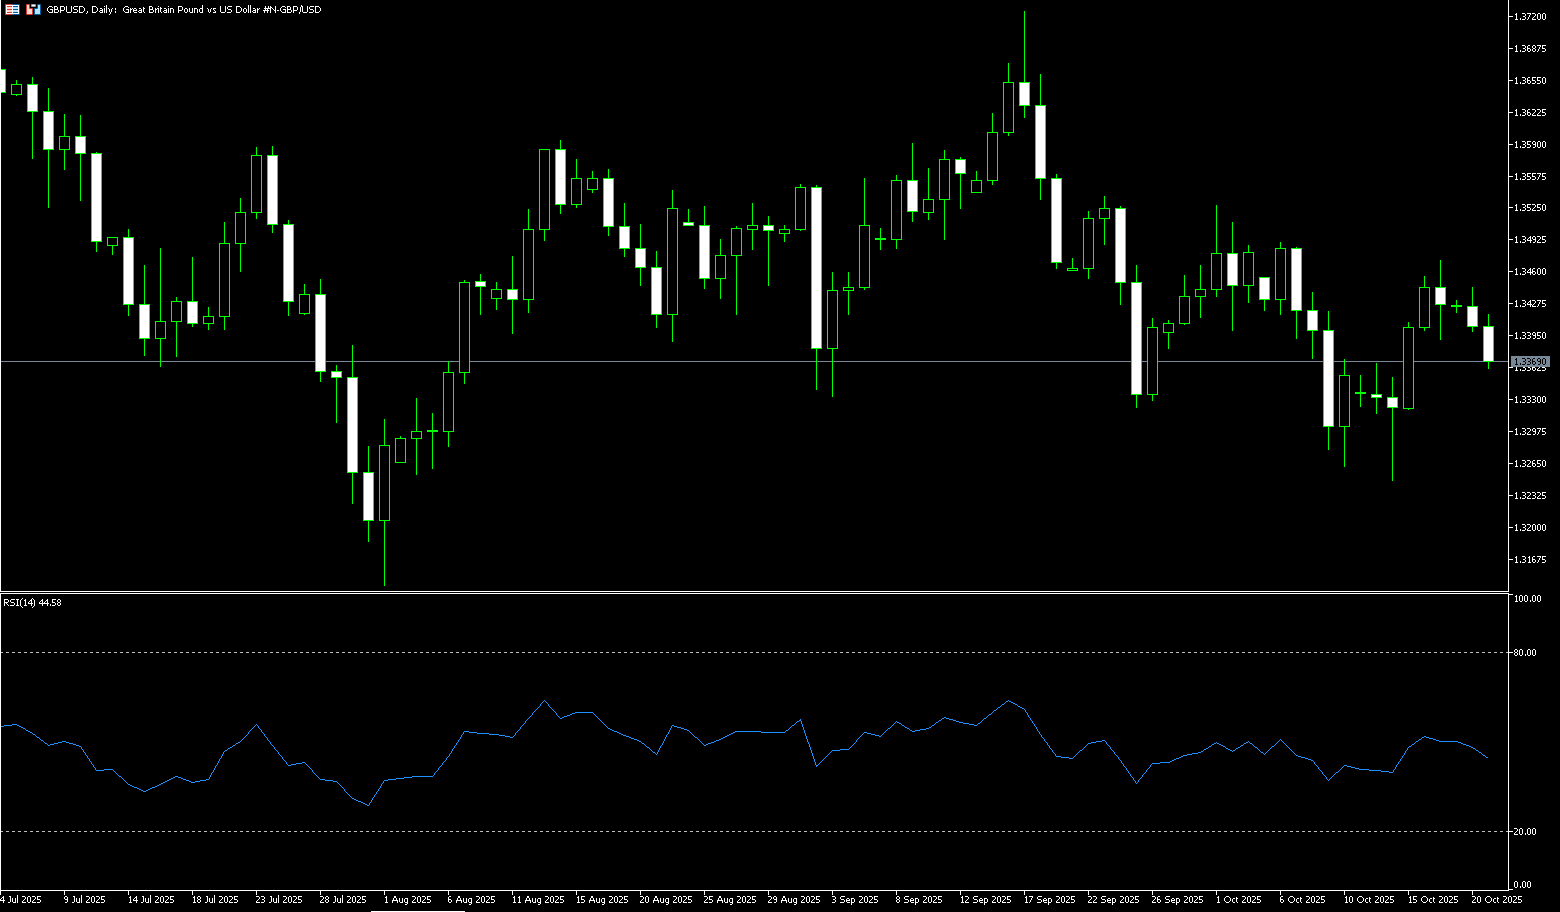
GBP/USD extended its losses to around 1.3380 during Tuesday's Asian trading session. The US dollar strengthened against the British pound as trade tensions between China and the US eased. Traders will closely monitor UK Consumer Price Index (CPI) inflation data for September, due later on Wednesday. The headline CPI is expected to rise 4.0% year-on-year in September, while the core CPI is expected to rise 3.7% year-on-year. Any signs of sustained inflationary pressures could prompt traders to lower their expectations for rate cuts and boost the pound against the US dollar in the short term. Meanwhile, US President Donald Trump stated on Friday that his proposal to impose 100% tariffs on Chinese goods was unsustainable, improving market sentiment as trade tensions eased. Despite this, Trump blamed Beijing for the recent impasse in trade negotiations, which began when Chinese authorities tightened controls on rare earth shipments.
GBP/USD traded in a narrow range below 1.3400 at the start of the week, with little movement. The pair is attempting to re-test its 20-day simple moving average, which is around 1.3408. The 14-day Relative Strength Index (RSI) on the current chart is fluctuating between 40.00 and 50.00, suggesting a sideways trend. Short-term trends remain uncertain. If GBP/USD fails to reclaim 1.3400, 1.3360 (the 23.6% Fibonacci retracement level from 1.3726 to 1.3248) will serve as key support on the downside. A break below this level would target the 1.3300 round-figure mark. On the upside, focus is initially on 1.3458 (the 30-day simple moving average), with the psychological barrier of 1.3500 as key resistance.
Consider a long position on the British pound at 1.3373 today. Stop-loss: 1.3360. Target: 1.3430, 1.3440.
USD/JPY
Following broad strength against the US dollar during the Asian session, the Japanese yen fell for a third consecutive day, retreating to a swing low near 151.80. Sanae Takaichi is almost certain to become Japan's first female prime minister after forming an alliance with the Japan Innovation Party (JIP), known as the "Wishin." This has fueled speculation about additional fiscal stimulus and a potential delay in further rate hikes by the Bank of Japan, which in turn has weighed on the yen. Furthermore, the generally positive tone in the stock market has proven to be another factor weakening demand for the safe-haven yen. Meanwhile, investors appear confident that the Bank of Japan will stick to its policy normalization path amid high inflation and a strong economy. This represents a significant divergence from the Federal Reserve's dovish outlook, which could limit further dollar appreciation and cap the USD/JPY exchange rate. Furthermore, expectations of a narrowing US-Japan interest rate differential could provide some support for the yen, which has a lower yield.
Some dip-buying and a move back above the 151.00 level favor USD/JPY bulls. Furthermore, positive oscillators on the daily chart support further gains towards the 151.90 confluence—including the 61.8% Fibonacci retracement level of the recent decline from the monthly peak and the 200-hour simple moving average. A sustained break above the latter should allow USD/JPY to rise above the 152.00 level and further towards the next relevant hurdle near the 152.25 supply zone, leading to the 153.00 level. On the other hand, the 150.25 (23.6% Fibonacci retracement level) and the 150.00 psychological level offer initial support. A convincing break below the latter could expose the 149.40-149.35 area, or the near two-week low reached on Friday. The USD/JPY exchange rate could extend its decline towards the 149.00 round-figure mark before ultimately falling to the strong horizontal resistance/support levels of 148.45-148.40.
Consider shorting the USD at 152.10 today. Stop-loss: 152.30, target: 151.00-150.80.

EUR/USD
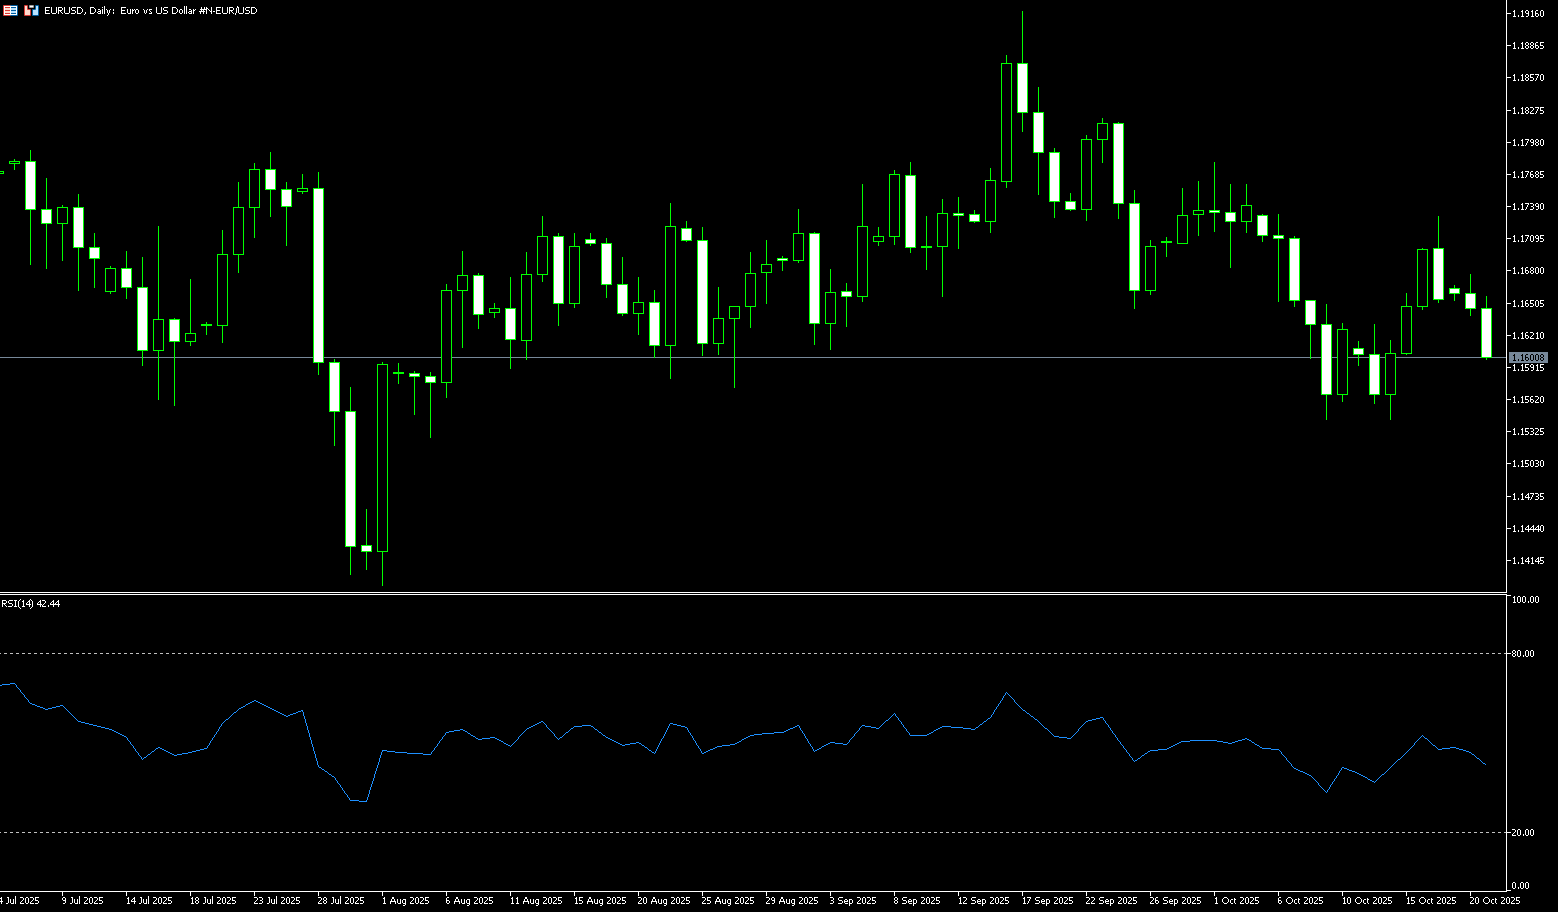
The euro stabilized slightly above $1.1600, near its highest level since October 6th, as investors weighed the impact of S&P Global Ratings' downgrade of France on global risk sentiment. S&P downgraded France's sovereign rating from AA- to A+, citing increased fiscal consolidation risks and continued uncertainty about the government's fiscal position, despite the submission of a draft 2026 budget to parliament. Meanwhile, risk appetite has improved amid easing US-China trade tensions and signs of stabilizing confidence in US regional banks. US Treasury Secretary Scott Bessant and Chinese Vice Premier He Lifeng will meet in Malaysia this week to avert a potential escalation of US tariffs on Chinese goods, which President Trump has called unsustainable. Meanwhile, investors await Friday's delayed release of US inflation data for further insight into the Fed's rate cut path.
The euro is more likely to face downward pressure in the short term. Last week's gains were driven more by passive weakness in the US dollar than inherent strength in the euro. As market focus shifts back to diverging economic growth and monetary policy, the euro's inherent weakness is expected to be the key driver of its future trends. The daily chart shows that the EUR/USD exchange rate is currently trading below the Bollinger Band 1.1668 and above the Bollinger Band 1.1560, indicating a typical neutral to weak structure. Key recent highs are 1.1700 (round number mark) and 1.1777 (Bollinger Band 1). Both highs failed to break through with significant volume, forming cumulative resistance above. The preceding lows are 1.1600 (round number mark) and 1.1567 (130-day simple moving average), which, combined with the Bollinger Band 1.1560, form a dense support area below.
Today, you can consider buying EUR at 1.1590, stop loss: 1.1580, target: 1.1640; 1.1650
Disclaimer: The information contained herein (1) is proprietary to BCR and/or its content providers; (2) may not be copied or distributed; (3) is not warranted to be accurate, complete or timely; and, (4) does not constitute advice or a recommendation by BCR or its content providers in respect of the investment in financial instruments. Neither BCR or its content providers are responsible for any damages or losses arising from any use of this information. Past performance is no guarantee of future results.
More Coverage


Risk Disclosure:Derivatives are traded over-the-counter on margin, which means they carry a high level of risk and there is a possibility you could lose all of your investment. These products are not suitable for all investors. Please ensure you fully understand the risks and carefully consider your financial situation and trading experience before trading. Seek independent financial advice if necessary before opening an account with BCR.

 English
 简体中文
简体中文
 繁體中文
繁體中文
 Bahasa
Melayu
Bahasa
Melayu
 Tiếng
Việt
Tiếng
Việt
 ไทย
ไทย
 日本語
日本語
 한국어
한국어
 ភាសាខ្មែរ
 español