


0
US Dollar Index
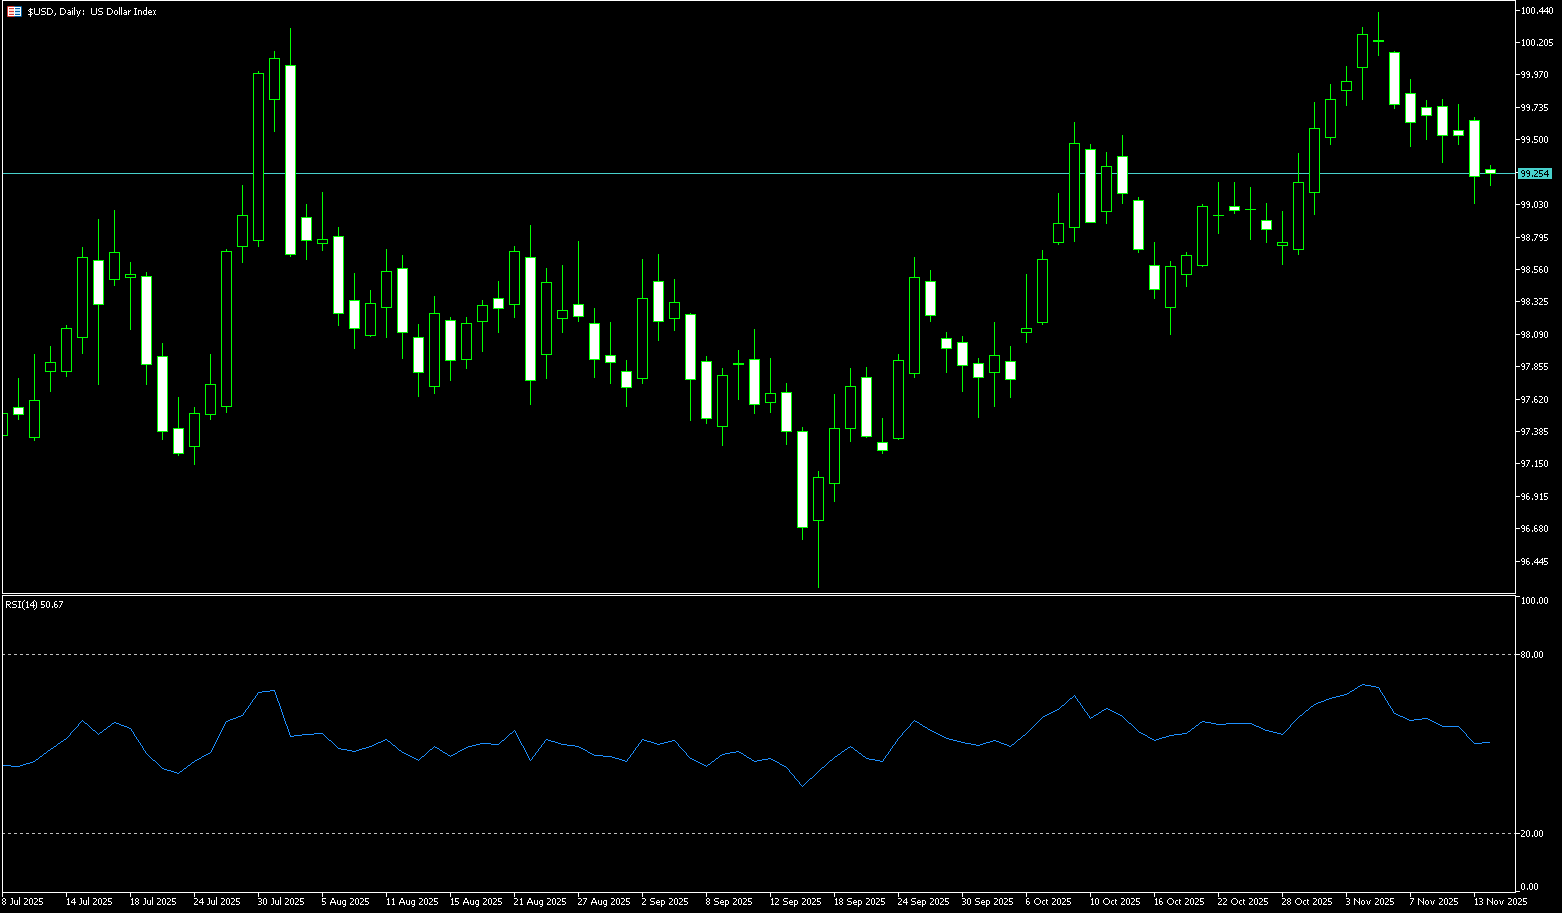
The US dollar index fell across the board mid-week, breaking below the psychological level of 100, as the latest economic data reinforced market expectations of a December rate cut by the Federal Reserve. The US economic data released presented mixed signals, echoing recent dovish comments from Fed officials, causing the market's probability of a December rate cut to surge from 50% a week ago to 83%. The dollar's decline is entirely justified, as data showed signs of stagflation at the end of the third quarter, characterized by both weak demand and sticky price pressures. Currently, the dollar index continues to weaken, breaking below the key technical level of the 200-day moving average at 99.74, with sellers firmly controlling the market. This trend clearly exhibits bearish characteristics, with no signs of investors rushing to buy the dip.
The dollar is currently under pressure, and economic data has failed to provide effective support for the bulls. The market is generally pointing to the possibility of another Fed rate cut. Until the market narrative shifts or buying recovers the psychological level of 100... The path of least resistance for the US dollar index remains downward. Once it breaks below the key technical level of the 200-day moving average at 99.74, sellers will firmly control the market. On the downside, the next support level is the 99.49 pivot point (November 19th low), where support is weak. If sellers continue to exert pressure, the psychological level of 99.00 will become a key support level. If the dollar index can recover the 200-day moving average and the psychological level of 100.00, it may indicate that the current decline is more due to long position liquidation than a large influx of new short positions; however, even so, a break above 100.58 (May 20th high) is needed to attract aggressive buying back into the market.
Today, consider shorting the US Dollar Index around 99.70; Stop loss: 99.80; Target: 99.35; 99.25
WTI Crude Oil
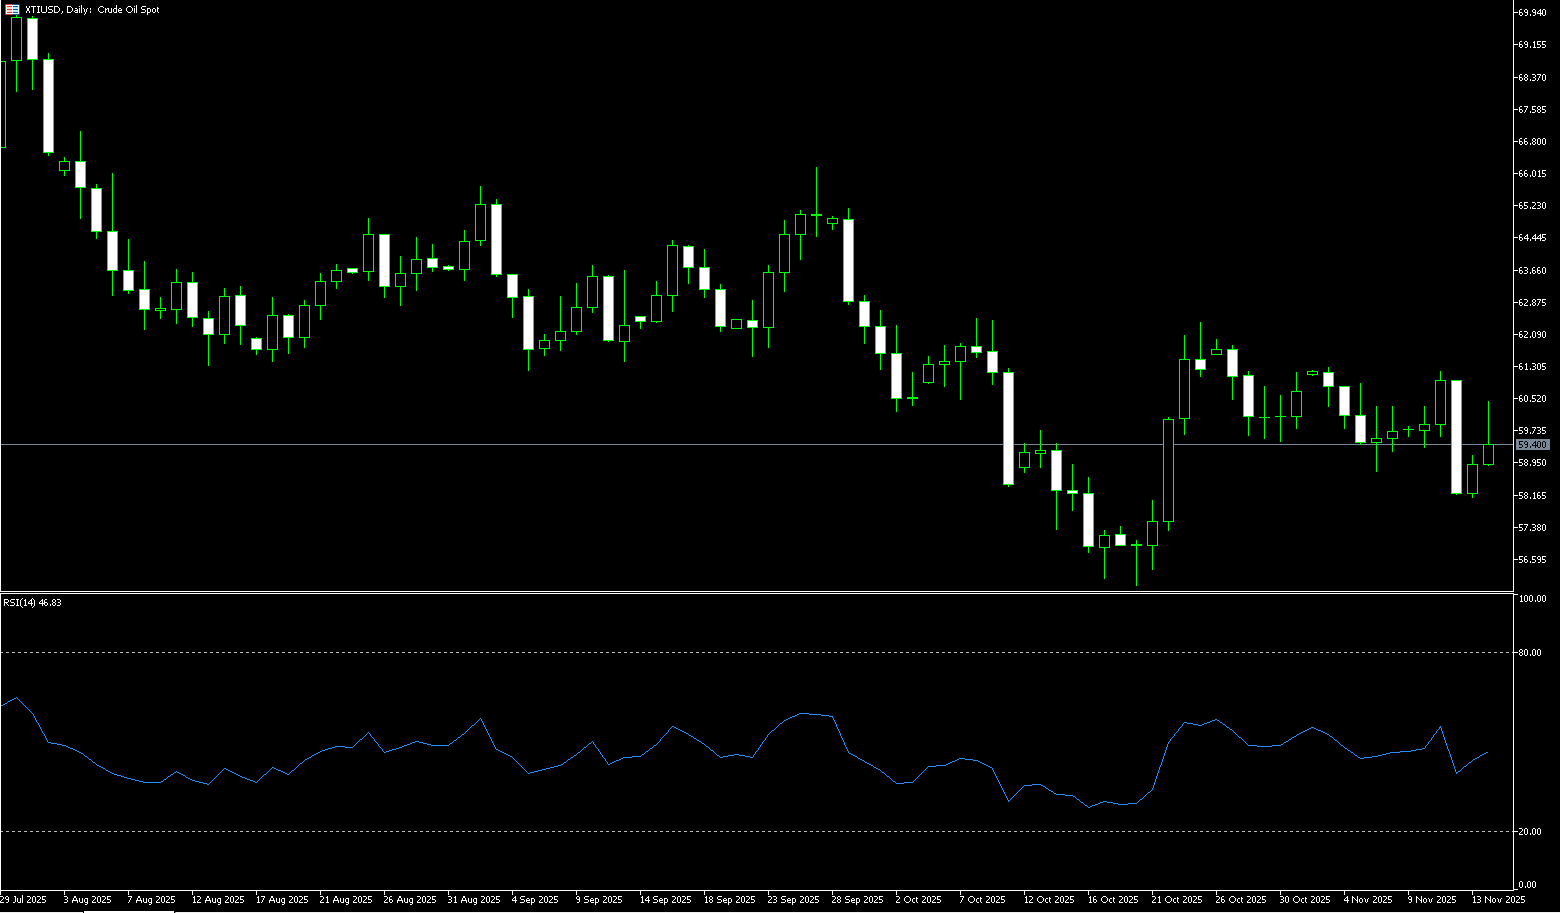
WTI crude oil traded above $58.00 per barrel on Wednesday. Oil prices continued their decline on Tuesday, mainly due to Ukraine's hints that it might accept the framework of a peace agreement proposed by the United States, triggering market concerns about the end of the Russia-Ukraine war and the return of Russian oil supplies to the market. If a peace agreement is reached, the West may lift sanctions on Russian energy trade, which could further exacerbate the supply-demand imbalance in a market already facing oversupply concerns. On the other hand, US President Trump stated that a peace agreement between Ukraine and Russia is "very close to being reached," but European leaders expressed skepticism. Meanwhile, the market predicts that the global crude oil market will experience a supply surplus of at least 2 million barrels per day in 2026, and a clear path to rebalancing is difficult to see in the short term.
From a technical perspective, the WTI crude oil daily chart clearly shows a downward trend. Oil prices are moving along a negative trendline and have stabilized near the 20-day moving average at $59.49, consolidating the stability of the short-term downtrend. Bearish sentiment currently dominates. The most crucial battleground is concentrated in the $57.03 (Tuesday's low) and $57.00 (a psychological level) area. This range has formed significant support since March 2021, becoming the last line of defense for the bulls in the short term. A break below this level could lead to a test of $55.97 (October 22nd low). Although all moving averages are in a bearish alignment, the bulls still possess technical support for a potential counterattack. If the bulls can successfully hold the $57.00-$57.03 support area, WTI crude oil may see a short-term technical rebound, with the first target near the 20-day moving average at $59.49. The $60.00 (psychological level) is a significant resistance level that has transformed from a previous key support level.
Today, consider going long on crude oil around 58.30; Stop loss: 58.13; Target: 59.80; 60.00
Spot Gold
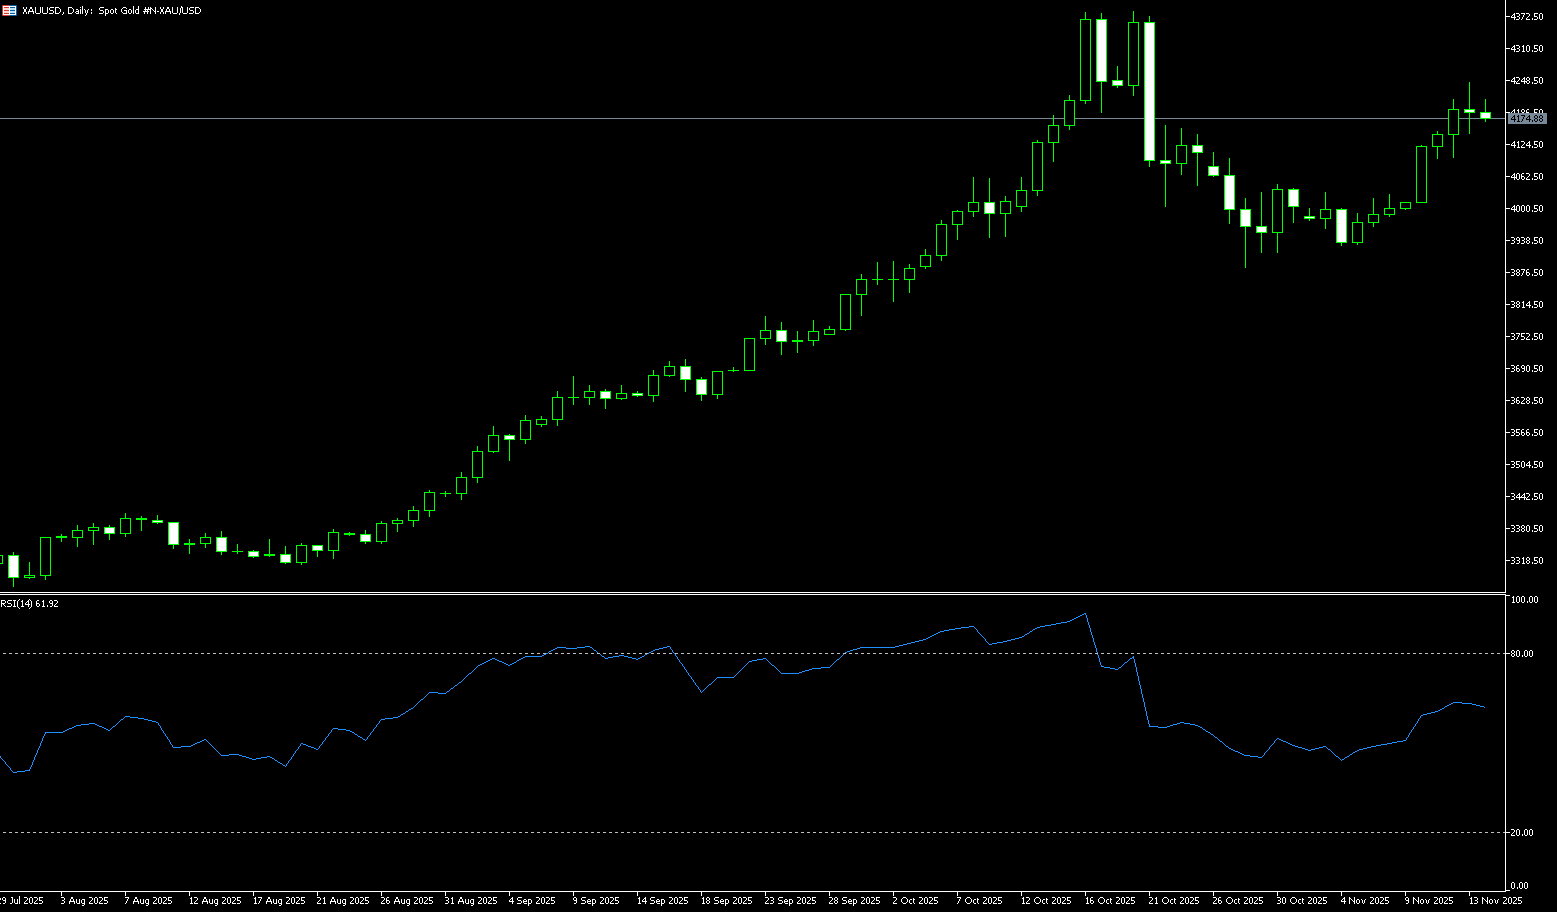
Gold prices traded around $4160/oz on Wednesday, having held steady on Tuesday after hitting their highest level since November 14th. Market expectations for a December rate cut by the Federal Reserve continue to rise, with the probability now at 85%. Recent dovish comments from the Fed have rekindled hopes for a December rate cut, and the latest data has not changed this expectation. A low-interest-rate environment is generally favorable for gold because the opportunity cost of holding non-interest-bearing assets is reduced. Currently, gold prices are generally stable, failing to break through further, and trading is limited due to the upcoming US Thanksgiving holiday. Of course, weaker-than-expected retail sales data, persistent inflationary pressures, and dovish comments from Fed officials are all quietly pushing up the potential for gold prices. Furthermore, investors are asking: in the context of a low-interest-rate environment and increased economic uncertainty, will gold usher in a new bull market?
From a daily chart perspective, spot gold has been oscillating upwards along the rising trendline since near its previous lows. Currently, the price is around $4,160 per ounce, still trading above the support line of the upward channel. The psychological level of $4,000 and the previous low near $3,886 form a key support zone. On the upside, the previous high of $4,200 (a psychological level) and $4,245 (the high of October 13th) constitute two resistance levels in the near term. In terms of indicators, the MACD histogram is shortening, and the divergence is converging towards the signal line, reflecting weakening bearish momentum and a continuation of the corrective rally. The Relative Strength Index (RSI) has rebounded from its previous lows to near the midline, indicating that the balance of power between bulls and bears is gradually shifting, but remains slightly bullish. Overall, these indicators are highly indicative of the future evolution of bullish and bearish forces, and short-term fluctuations are likely to continue within the aforementioned support and resistance zones.
Consider going long on gold around 4,158 today; Stop loss: 4,153; Target: 4,185; 4,190
AUD/USD
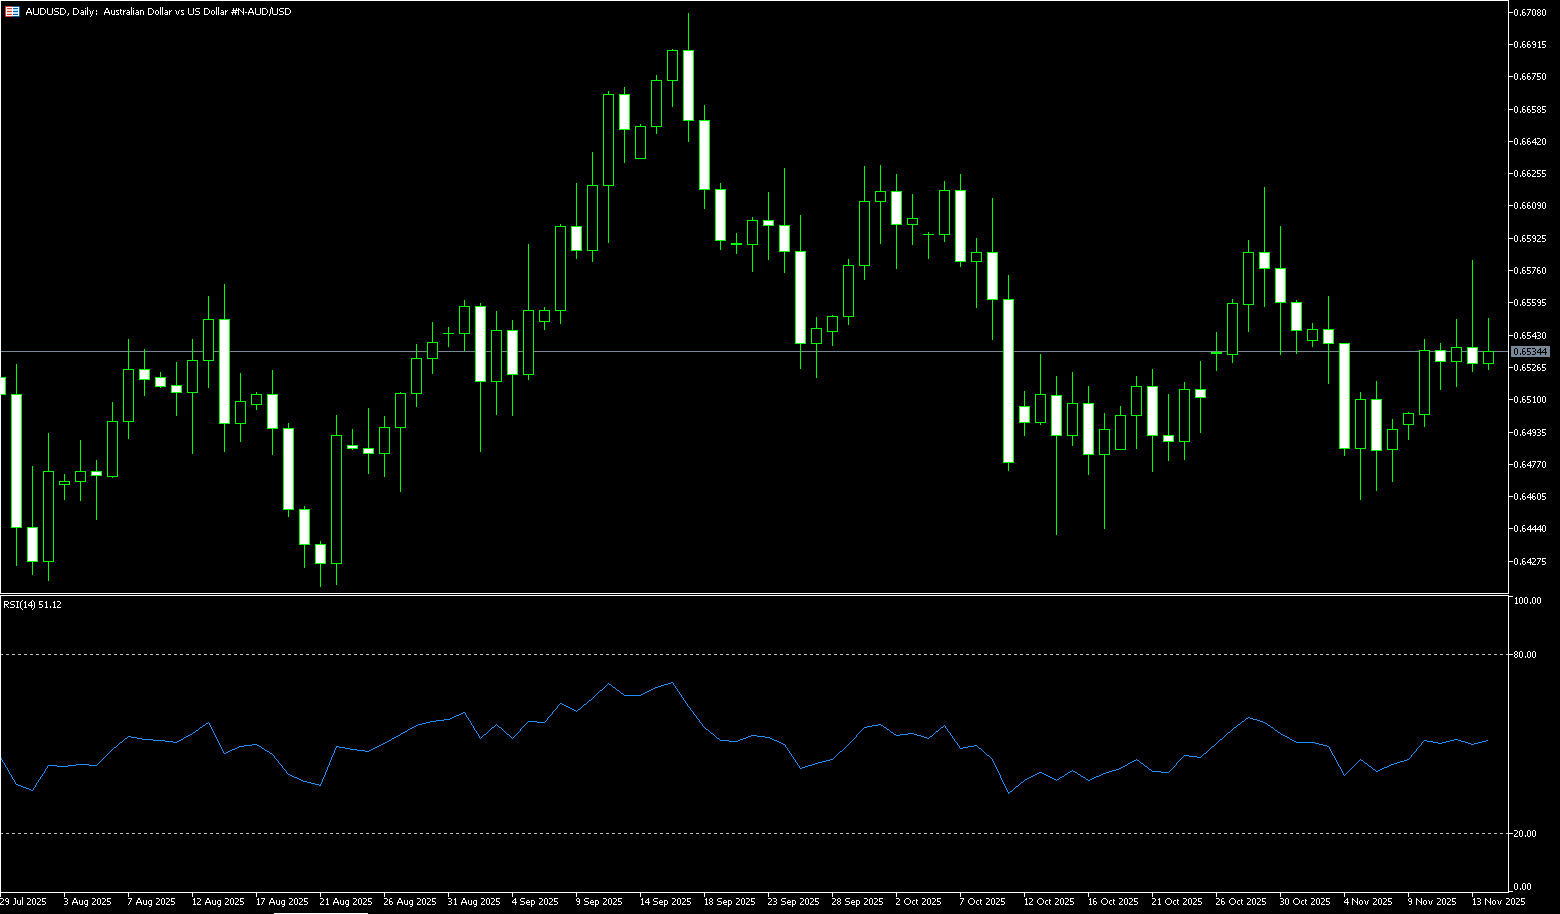
The Australian dollar strengthened around US$0.6500 on Wednesday, hitting a one-week high, after stronger-than-expected inflation data reinforced market bets on a hawkish RBA policy outlook. The first full monthly price release showed that price pressures remain high, with total inflation accelerating to 3.8% in October, the fastest in seven months and higher than expected. Crucially, the RBA's preferred core price pressure gauge—the trimmed mean inflation rate—rose to 3.3%, also exceeding forecasts. Last month's unexpectedly strong quarterly inflation data had already prompted the RBA to keep interest rates unchanged. Last week, Deputy Governor Hunt noted that the labor market was slightly above sustainable levels, with the unemployment rate declining and wage growth remaining high, highlighting ongoing tensions and supporting the central bank's cautious stance. Market pricing now suggests a rate cut is unlikely until May next year, while some analysts believe the rate-cutting cycle is over.
The Australian dollar traded around 0.6500 against the US dollar on Wednesday. Daily chart analysis shows the pair has been trading in a narrow range recently, exhibiting a neutral bias. The pair continues to trade below the 50-day simple moving average at 0.6534, highlighting weak short-term upward momentum. AUD/USD found immediate support at the 200-day simple moving average near 0.6462, followed by the five-month low of 0.6414 reached on August 21. On the upside, the pair is hovering below the 50-day simple moving average near 0.6534. A successful break above this moving average would support a test of 0.6580 (the high of November 13). Further gains would bring the pair closer to the psychological level of 0.6600.
Consider going long on the Australian dollar today around 0.6505; Stop loss: 0.6500; Target: 0.6550; 0.6560
GBP/USD
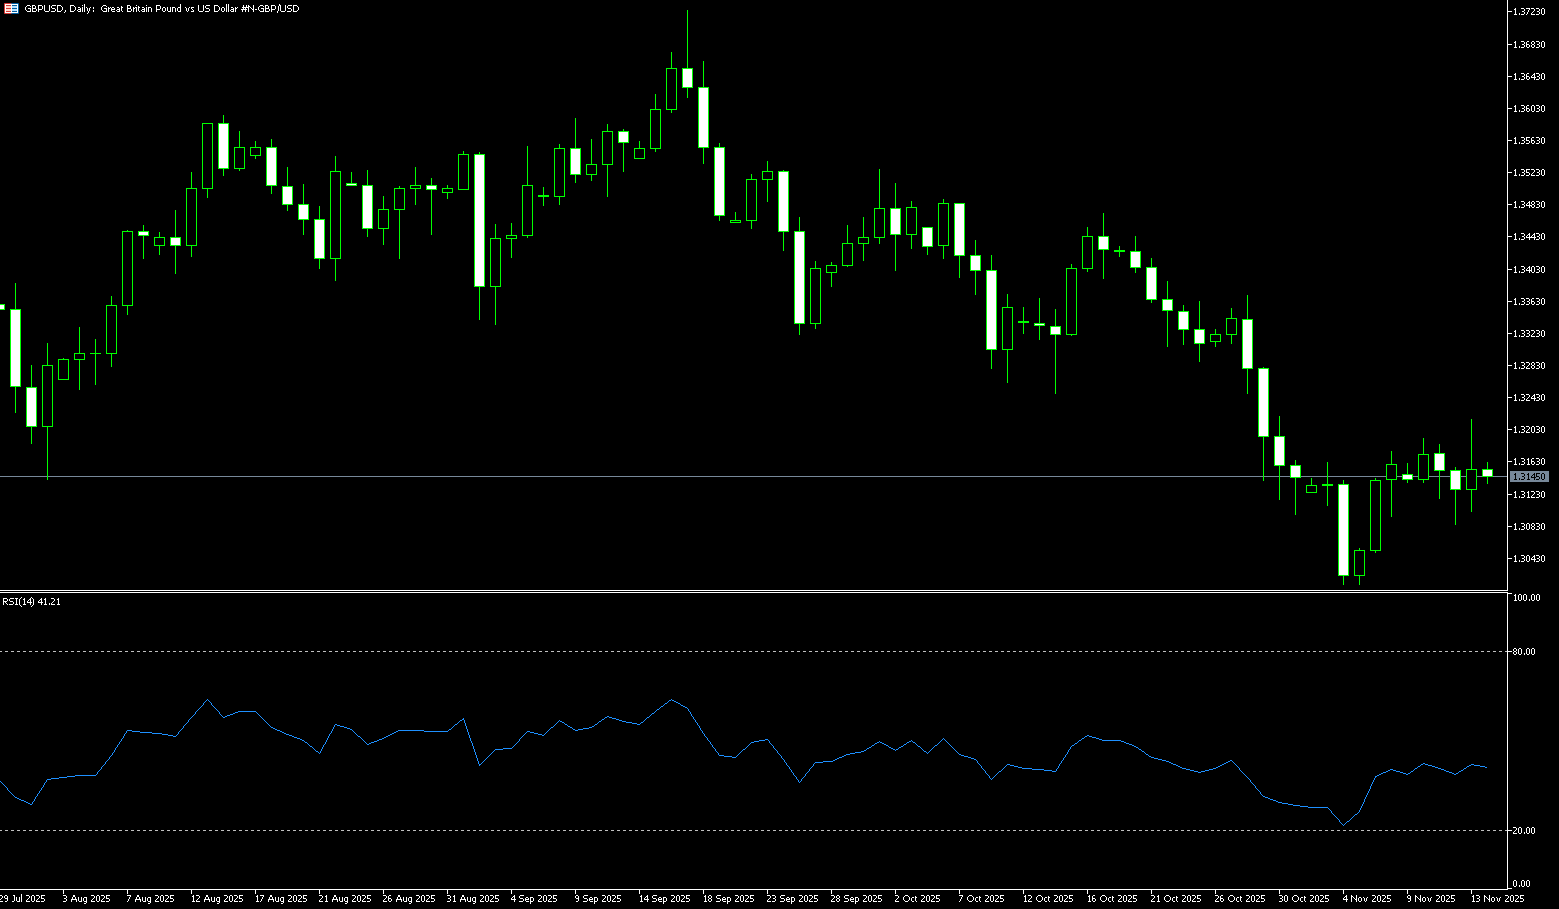
The pound/dollar pair rose for the fifth consecutive day, trading around 1.3230 in Asian trading on Wednesday. UK Chancellor Rachel Reeves is expected to announce tens of billions of pounds in new tax increases, a budget that will test her credibility among bond investors and lawmakers pushing for increased welfare spending. A more responsible fiscal stance could bolster long-term confidence in UK assets, providing modest support for the pound. Just over a year after implementing the largest tax increase since the 1990s—£40 billion ($52.7 billion)—Reeves is now forced to implement additional revenue-generating measures as the UK economic outlook may be downgraded and debt servicing costs rise. Moderate inflation in the UK fell to 3.6% in October, strengthening market expectations for a Bank of England rate cut. The GBP/USD pair also rose due to pressure on the US dollar.
Any further gains are likely to encounter resistance in the "double top" area of 1.3214-1.3215 (the highs of November 13th and 25th). A break above this area could trigger a new wave of profit-taking, pushing GBP/USD towards the 45-day simple moving average level of 1.3269. Some sustained buying should pave the way for continued positive momentum, challenging the technically important 200-day simple moving average support-turned-resistance around 1.3306. On the other hand, the 9-day simple moving average at 1.3133 is likely to continue providing some support for the pair. A clear break above this level would reveal the next relevant support around the 1.3100 level.
Consider going long on GBP/USD around 1.3225 today; Stop loss: 1.3210; Target: 1.3260; 1.3270
USD/JPY
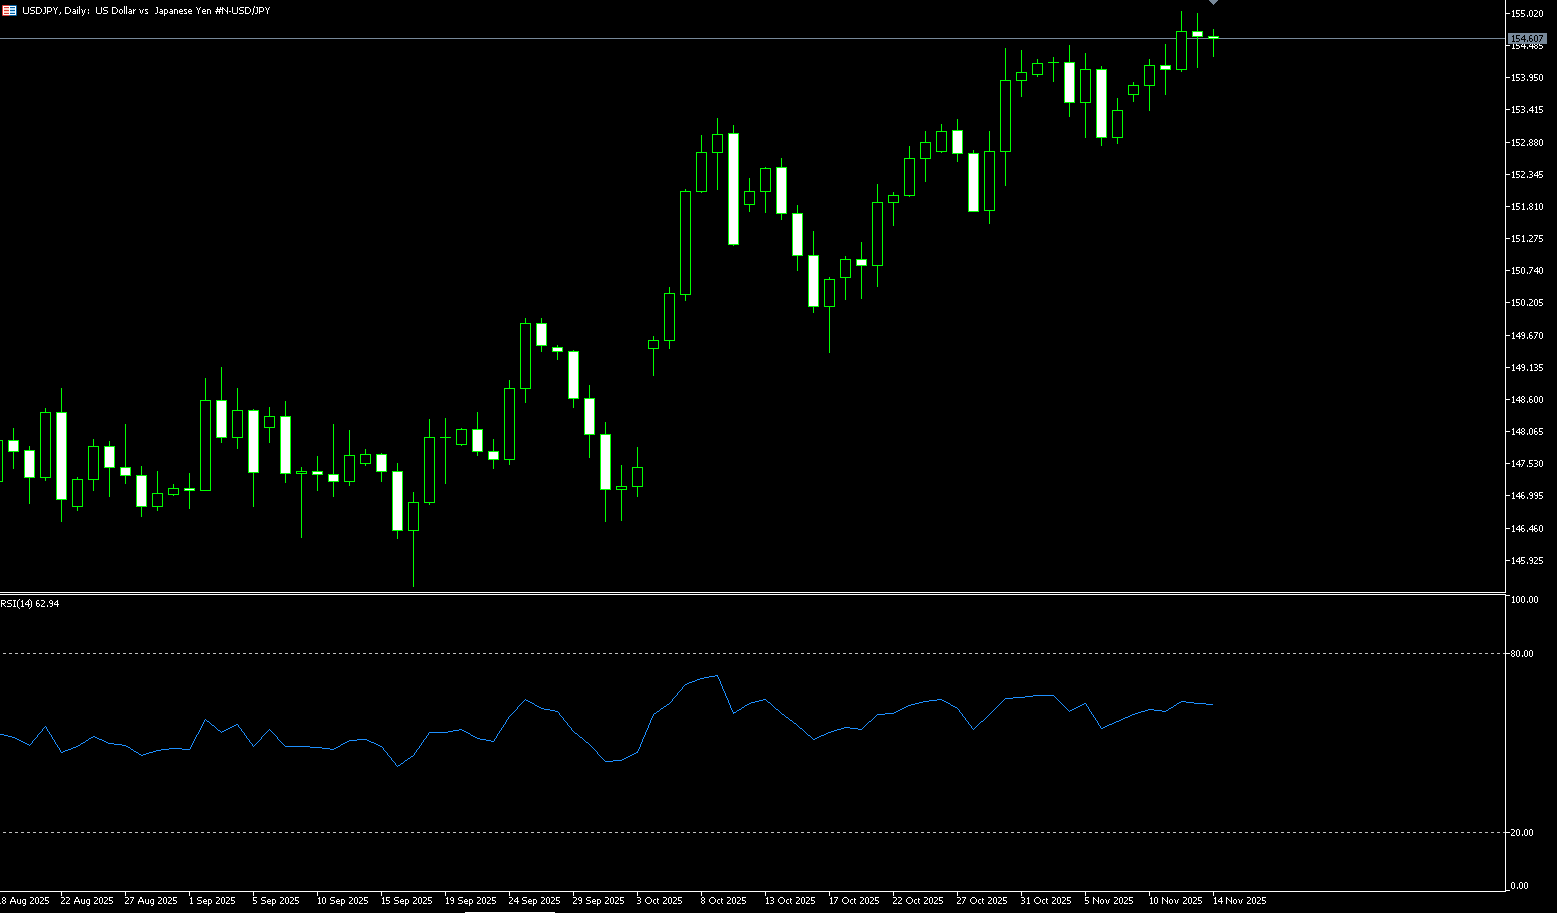
The yen held onto its recent gains on Wednesday, hovering around 156 yen per dollar, near a one-week high, mainly benefiting from a weaker dollar as traders increased their bets on a December rate cut by the Federal Reserve. These expectations grew after the latest U.S. data showed a slowdown in consumer spending and reports that the next Fed chair might be a dovish candidate. The yen was also supported by increasing speculation that Japanese authorities might intervene in the currency market, with Thursday's U.S. Thanksgiving holiday creating a potential opportunity for Tokyo to act. On Sunday, Takuji Aida, an advisor to Prime Minister Sanae Takaichi, said Tokyo was prepared to intervene aggressively to offset the negative economic impact of a weaker yen, echoing recent comments from Bank of Japan Governor Ueda and Fiscal Minister Satsuki Katayama.
The USD/JPY exchange rate currently appears to have found support at the 10-day simple moving average around 155.98 and 155.88 (before the 23.6% Fibonacci retracement level of 149.38 to 157.89). Furthermore, the negative oscillator on the daily chart provides a basis for further declines towards 60. However, it remains in positive territory, suggesting that any further declines are more likely to find good support near the psychological psychological level of 155.00. Following that is 154.64 {38.2% Fibonacci retracement}, a decisive break of which would... This could be seen as a new trigger for bearish traders, paving the way for a deeper decline. On the other hand, any attempt to rise above 156.60 (the 5-day simple moving average) currently appears to face immediate resistance near the psychological level of 157. A sustained strong break above the latter could trigger short-term profit-taking and pave the way for USD/JPY to reclaim 157.89 (the November 20 high), targeting the intermediate resistance level of 157.45-157.50.
Consider shorting the USD near 156.65 today; Stop loss: 156.85; Target: 155.70. 155.50
EUR/USD
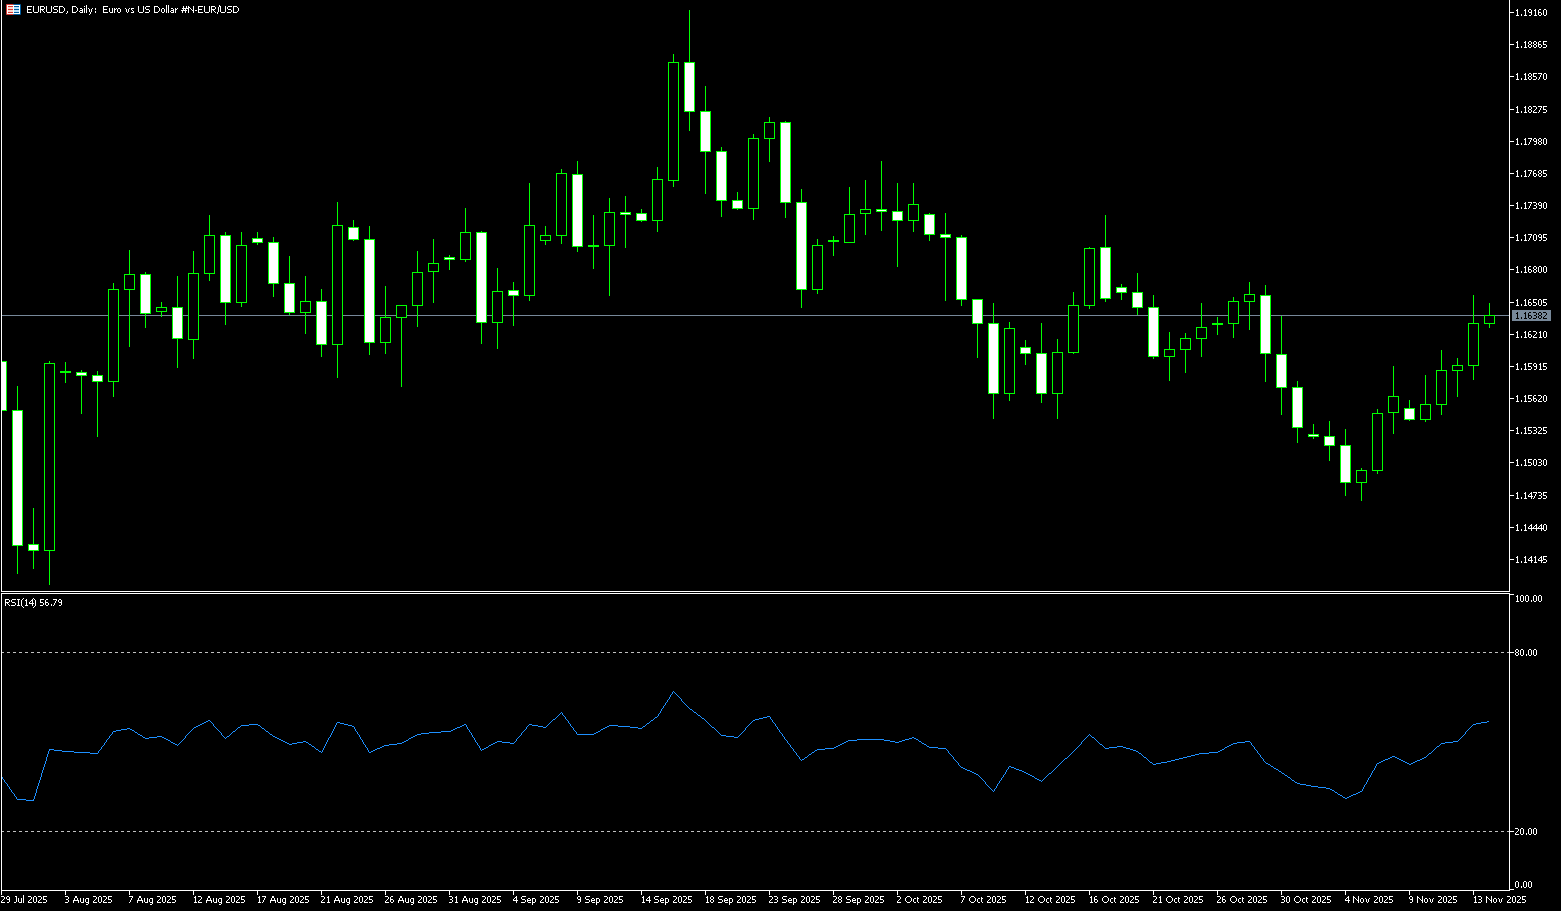
The euro/dollar pair continued its upward trend in Asian trading on Wednesday, trading around 1.1590. Weak US economic data pressured the dollar, fueling market expectations of a December rate cut by the Federal Reserve. Data released by the US Census Bureau on Tuesday showed that US retail sales rose 0.2% month-over-month in September, down from 0.6% in August, indicating more cautious consumer spending. Retail sales in controlled groups fell 0.1%, contrary to expectations of a 0.3% increase and the previous month's 0.6% increase. Furthermore, the Census Service report stated that household sentiment deteriorated sharply, with consumer confidence falling 6.8 points to 88.7 in November from 95.5 in October. Additionally, the euro/dollar pair rose as the euro found support amid cautious sentiment regarding the European Central Bank's policy outlook. Traders expect the central bank to keep interest rates unchanged until 2026. This is due to economic resilience and inflation nearing the target.
The euro/dollar has been slowly declining since its high above 1.1900 in early September. Given the recent lack of meaningful Eurozone drivers, the pair is likely to continue to be guided by the US dollar. Any changes in Fed information, a strengthening of the global risk backdrop, or renewed interest in Eurozone assets could help the euro stage a more convincing rally. The euro/dollar appears to have woken up, staging a meaningful rally in the first half of the week. However, the sustainability and duration of this movement remain to be seen. That said, once the pair breaks above the November 13 high of 1.1656, it may attempt to challenge the 1.1700 (psychological level) and the October 17 high of 1.1728, followed by the October 1 high of 1.1778. On the opposite side, the 1.1560 level, below the 9-day simple moving average, is a potential target. This should reveal a potential decline towards the 1.1500 level.
Consider going long on the Euro today around 1.1580; Stop loss: 1.1570; Target: 1.1640; 1.1650
Disclaimer: The information contained herein (1) is proprietary to BCR and/or its content providers; (2) may not be copied or distributed; (3) is not warranted to be accurate, complete or timely; and, (4) does not constitute advice or a recommendation by BCR or its content providers in respect of the investment in financial instruments. Neither BCR or its content providers are responsible for any damages or losses arising from any use of this information. Past performance is no guarantee of future results.
More Coverage


Risk Disclosure:Derivatives are traded over-the-counter on margin, which means they carry a high level of risk and there is a possibility you could lose all of your investment. These products are not suitable for all investors. Please ensure you fully understand the risks and carefully consider your financial situation and trading experience before trading. Seek independent financial advice if necessary before opening an account with BCR.
BCR Co Pty Ltd (Company No. 1975046) is a company incorporated under the laws of the British Virgin Islands, with its registered office at Trident Chambers, Wickham’s Cay 1, Road Town, Tortola, British Virgin Islands, and is licensed and regulated by the British Virgin Islands Financial Services Commission under License No. SIBA/L/19/1122.
Open Bridge Limited (Company No. 16701394) is a company incorporated under the Companies Act 2006 and registered in England and Wales, with its registered address at Kemp House, 160 City Road, London, City Road, London, England, EC1V 2NX. This entity acts solely as a payment processor and does not provide any trading or investment services.

 English
 简体中文
简体中文
 繁體中文
繁體中文
 Bahasa
Melayu
Bahasa
Melayu
 Tiếng
Việt
Tiếng
Việt
 ไทย
ไทย
 日本語
日本語
 한국어
한국어
 ភាសាខ្មែរ
 español