


0
US Dollar Index
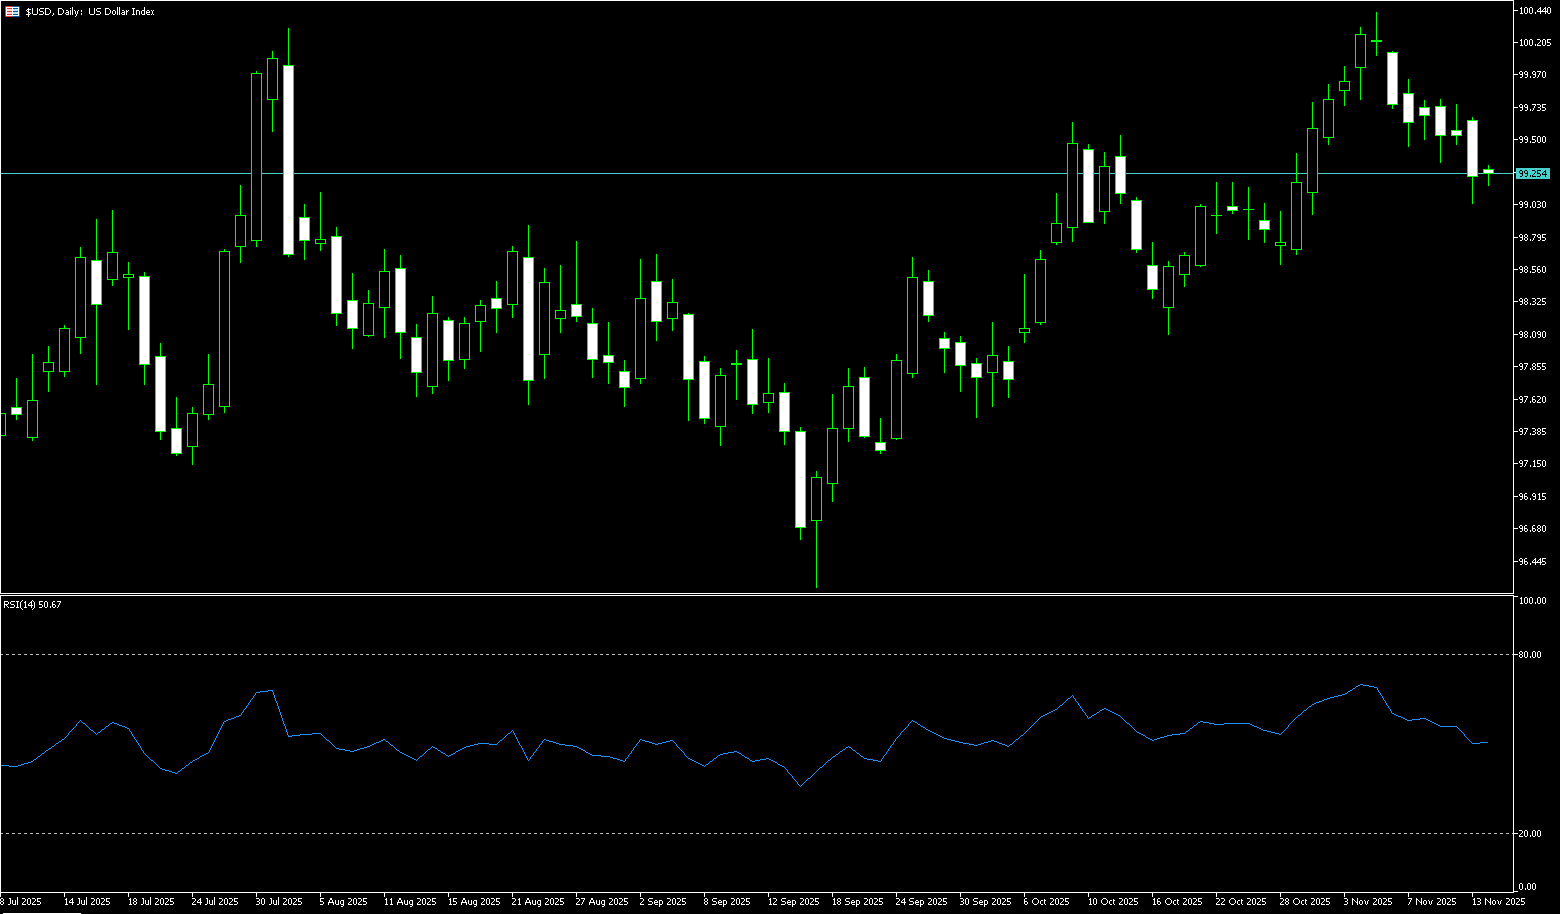
The US dollar index climbed above 100.10 on Wednesday, its highest level in nearly two weeks, as traders reduced their expectations for another Federal Reserve rate cut in December. Market pricing now implies a roughly 34% probability of a 25 basis point cut in the federal funds rate. This change comes after the Bureau of Labor Statistics announced it would not release its regular October jobs report, noting that household survey data could not be collected afterward. The agency stated that the missing data will be reflected in the delayed November report. The lack of household survey data is expected to further obscure the Fed's assessment of labor market conditions. Meanwhile, the minutes of the October FOMC meeting showed policymakers were divided on whether further rate cuts were needed. The dollar rose most significantly against the yen following comments from Japanese Finance Minister Katayama, who stated that the new Japanese government was closely monitoring financial markets. The dollar also strengthened against the Swiss franc and the pound after UK inflation slowed.
The index is currently finding support at the 200-day simple moving average of 99.92 and the 50-day simple moving average of 98.66. After breaking through the 25-day simple moving average at 99.30, prices rose slightly, with this midpoint becoming a battleground for both bulls and bears. The 14-day RSI is currently at 64, in a neutral-to-strong range, not yet overbought, indicating further upside potential. In the MACD indicator, the DIFF and DEA are about to cross downwards, and the MACD histogram is turning green, suggesting weakening short-term momentum and a potential pullback. However, as long as the DIFF doesn't fall below the zero line, the medium-term bullish structure remains intact. The US dollar index is facing resistance near 100.26 (the November 4th high) and the 100.50 level; if it falls back, watch the support levels at 99.92 (the 200-day simple moving average) and 98.66 (the 50-day simple moving average).
Today, consider shorting the US Dollar Index around 100.25; Stop loss: 100.38; Target: 99.85; 99.70
WTI Crude Oil
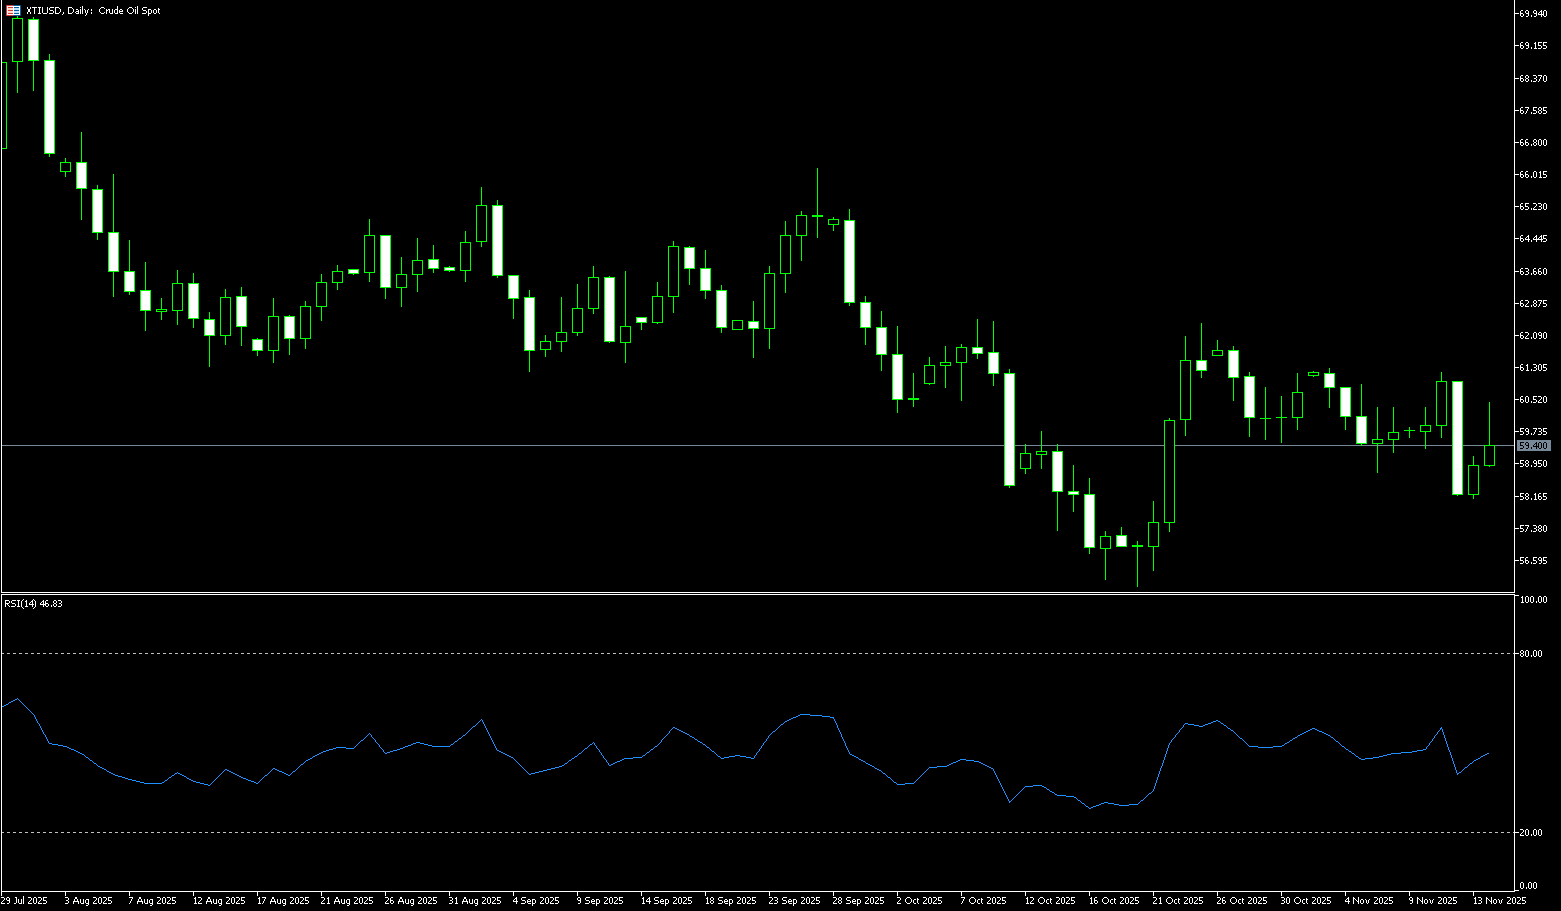
US WTI crude oil fell more than 2% on Wednesday to $59.3 per barrel, after reports that the US was pushing for an end to the Russia-Ukraine war. Ukrainian officials said Kyiv received a “signal” from the US proposing an end to the Russia-Ukraine war, boosting hopes for a diplomatic recovery. Meanwhile, Russia said sanctions against Rosneft and Lukoil had not hurt their production. On the supply side, US crude oil inventories fell more than expected by 3.4 million barrels to 424.2 million barrels in the week ending November 14, while gasoline and distillate inventories rose, the Energy Information Administration said. Crude oil inventories at the Chincha, Oklahoma delivery center fell by 698,000 barrels. On Tuesday, API data showed US crude oil inventories jumped 4.4 million barrels to their highest level in five months. Meanwhile, geopolitical tensions are escalating, with Iran briefly seizing an oil tanker near the Strait of Hormuz, and the US deploying additional troops near Venezuela.
From a daily chart perspective, WTI crude oil has fallen back below the psychological level of $60.00, forming a temporary support level and consolidating in a weak range, with insufficient upward momentum. The moving average system shows that the 9-day (59.68) and 20-day (60.12) simple moving averages are slightly downward sloping, indicating short-term weakness; the 14-day RSI is hovering around 46.82, reflecting cautious market sentiment; and the candlestick pattern shows consecutive upper shadows, indicating that selling pressure has increased as oil prices have rebounded. If oil prices break below the key support level of $60, they may further decline to around $58.12 in the short term. A decisive break below this area would open up further downside potential to $57.31 (the low of October 22nd). Conversely, a break above $61.43 (the 65-day simple moving average) would strengthen the short-term bullish bias and push oil prices to challenge the key resistance level of $62.38 (the high of October 24th) and the $62.18 level where the 85-day moving average is located.
Today, consider going long on WTI crude oil around $59.20; Stop loss: $59.00; Target: $60.80; $61.00
Spot Gold
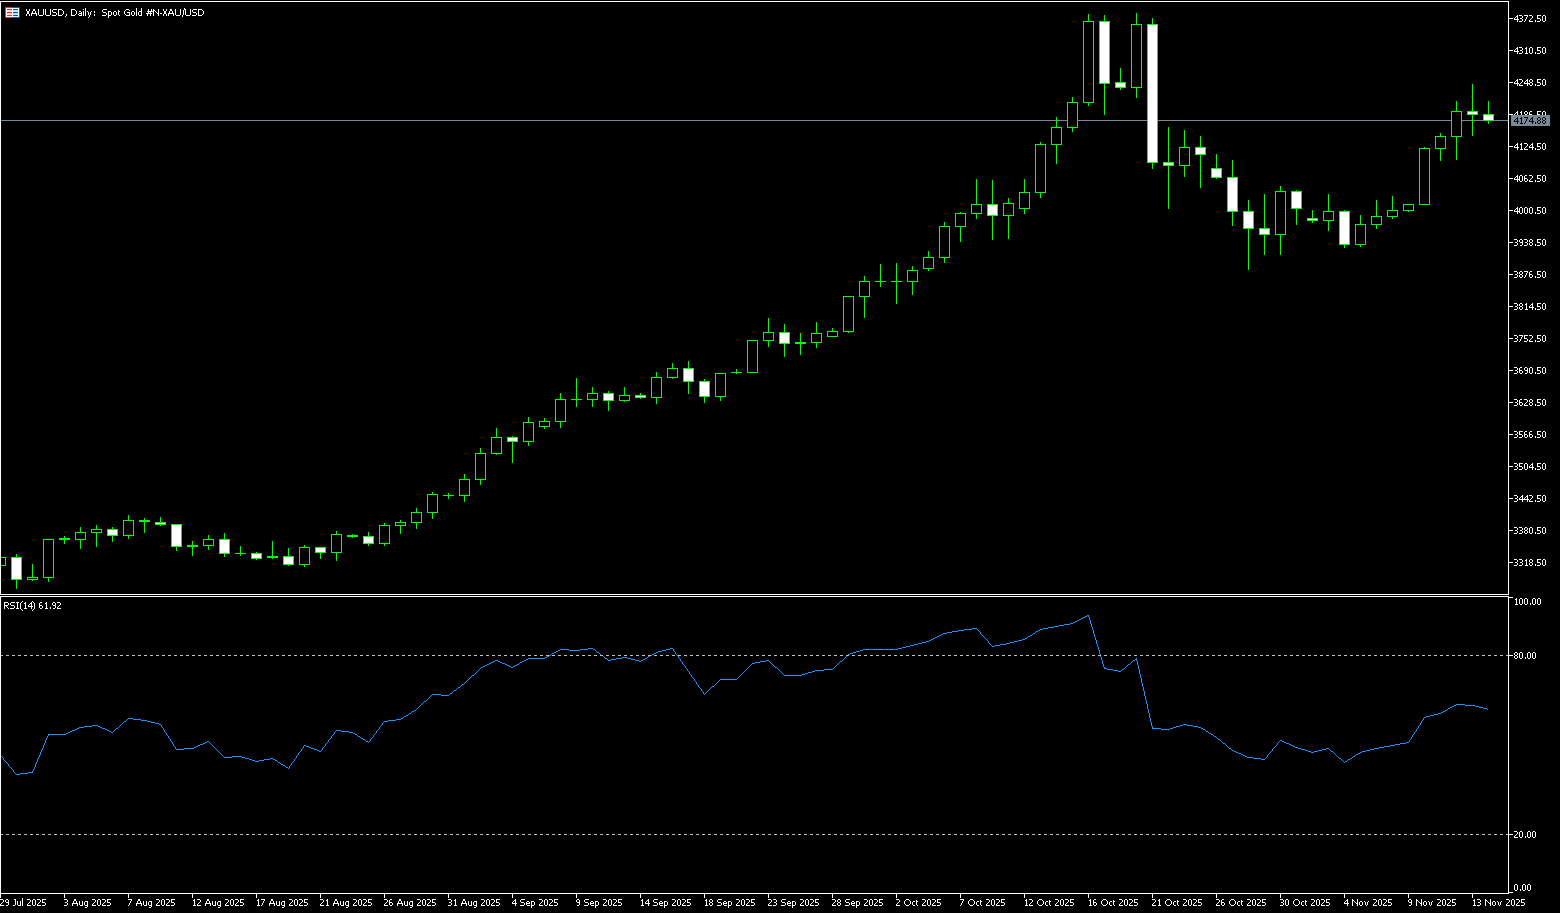
Spot gold rebounded from a one-week low earlier this week and is currently trading around $4,080 per ounce. This rebound was mainly driven by weak US jobs data, which strengthened market expectations that the Federal Reserve might cut interest rates in December. Last week, initial jobless claims in the US rose to a two-month high, indicating a cooling labor market and providing room for the Federal Reserve to consider interest rate cuts. According to the CME Group's FedWatch tool, the market's perception of a December rate cut has risen to nearly 50%, and the data "slightly boosted market hopes for a December rate cut," helping gold prices to recover. Currently, the market remains optimistic, believing that official demand for gold will "continue to rise in the foreseeable future," supporting the bank's forecast of an average gold price of $4,000 per ounce next year. Safe-haven demand triggered a moderate inflow of safe-haven funds, stabilizing gold prices. Traders are awaiting delayed US data releases, including the September non-farm payroll data to be released on Thursday.
This week, although bulls successfully defended the psychological support level of $4,000, with continued bargain hunting, the upward momentum for gold remained weak. On the upside, spot gold faces multiple resistance zones near the $4,100 (psychological level) and $4,132.80 (Wednesday's high). A decisive break above the aforementioned resistance zone would be the first signal of a renewed upward trend; given the short-term bearish tone, the $4,200 area could trigger new selling pressure. On the downside, $4,046 (20-day simple moving average) and $4,000 (psychological level) remain key support levels. A sustained break below these levels could trigger a deeper correction towards $3,964 (50-day simple moving average) and $3,900 (psychological level). A decisive break below this level would indicate a more definitive downtrend and put significant pressure on the overall outlook for gold.
Consider going long on spot gold around $4,073 today; Stop loss: $4,068; Target: $4,120; $4,150
AUD/USD
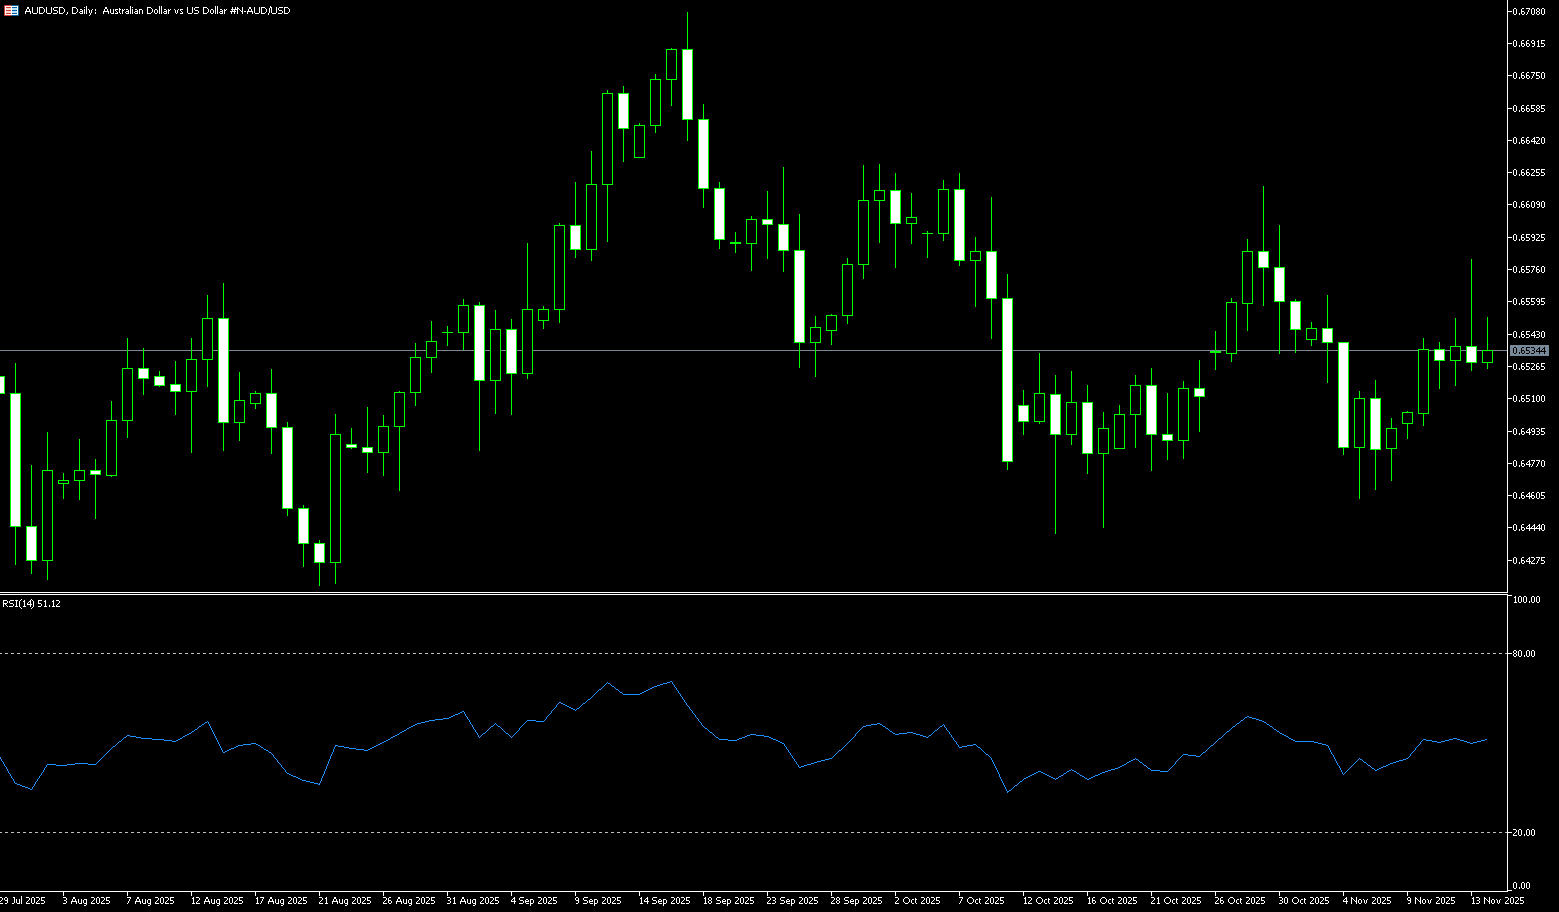
Concerns about overvaluation of artificial intelligence are putting downward pressure on the Australian dollar, causing the AUD/USD pair to remain weak, negatively impacting sentiment towards riskier currencies. Australia's reliance on commodity exports amplifies this impact, making the Australian dollar vulnerable during periods of risk aversion. Australia's seasonally adjusted wage price index rose 0.8% quarter-on-quarter in the third quarter, unchanged from the previous period and in line with expectations. The Reserve Bank of Australia (RBA) released the minutes of its November monetary policy meeting on Tuesday, noting that board members expressed a more balanced policy stance. Strong domestic employment data increased market expectations of a cautious stance from the RBA, potentially providing renewed support for the Australian dollar.
On Wednesday, the AUD/USD pair traded around 0.6480. Daily chart analysis shows the pair consolidating below the 0.6500 level, exhibiting a sideways price pattern. Meanwhile, the exchange rate remains below the 9-day simple moving average of 0.6517, and the 14-day Relative Strength Index (RSI) is around 42.50, highlighting a continued bearish bias on the downside. The AUD/USD pair is likely to find major support near 0.6459 (the 200-day simple moving average), followed by the five-month low of 0.6414 recorded on August 21. On the other hand, AUD/USD may test the major resistance level of the 9-day simple moving average at 0.6517. A break above this level would improve short-term price momentum and bring the pair closer to the 50-day simple moving average at 0.6553 and the November 13 high of 0.6580.
Consider going long on the AUD today near 0.6466; Stop loss: 0.6452; Target: 0.6530; 0.6540
GBP/USD
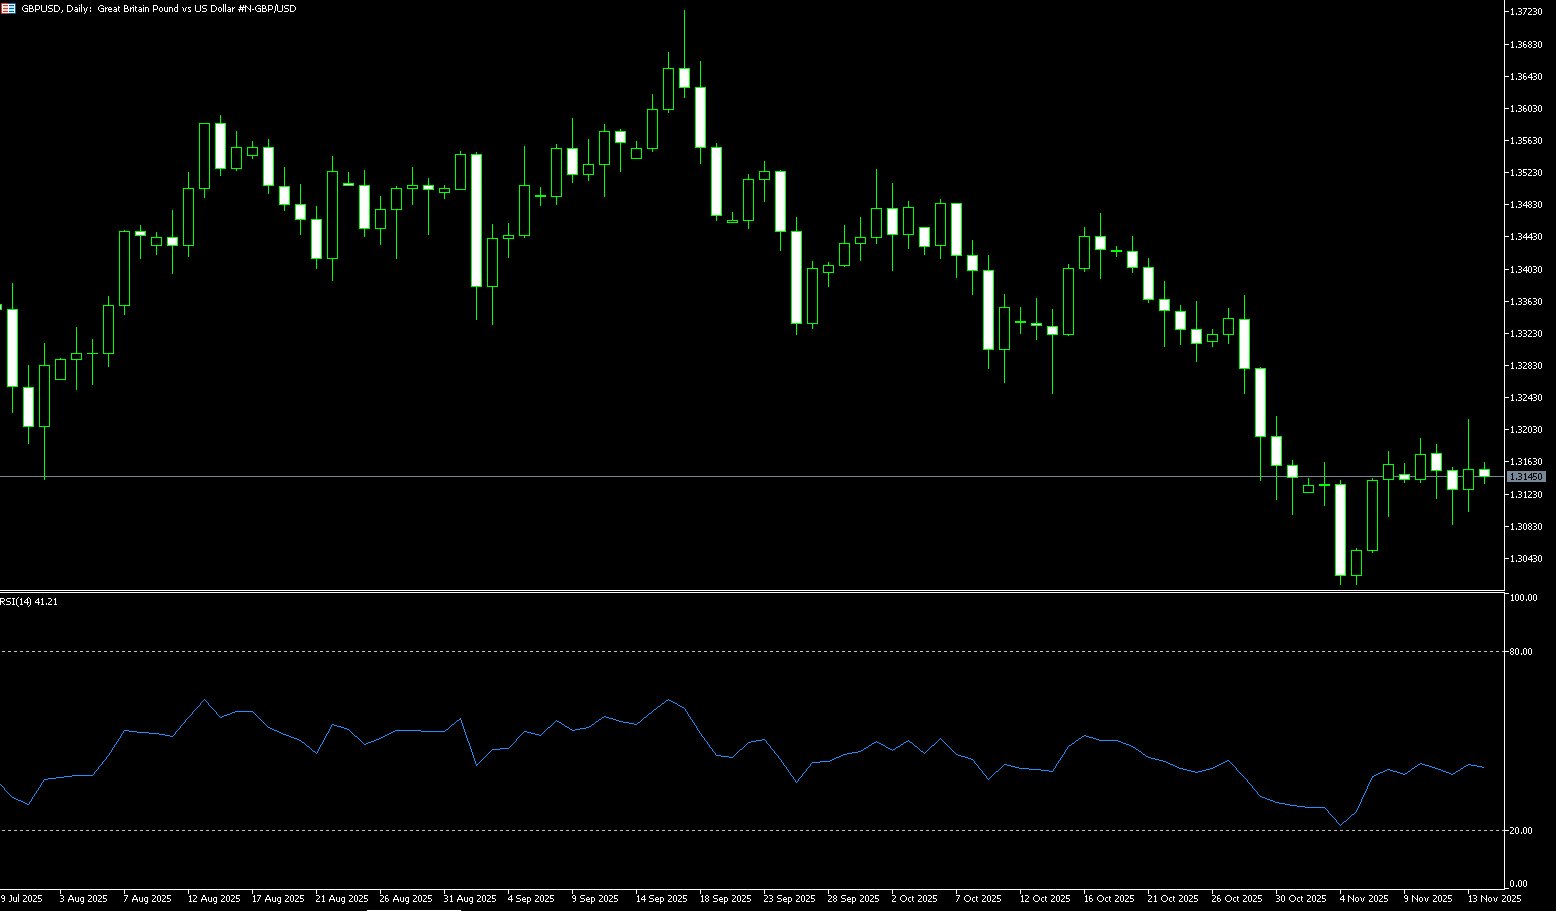
The GBP/USD pair remained weak for the fourth consecutive trading day in Asian trading on Wednesday, trading around 1.3060. A easing of UK price pressures, coupled with a weak labor market and slowing GDP growth, would further strengthen market expectations of a Bank of England rate cut in December, putting additional pressure on the pound. The pound/dollar pair also weakened as the dollar weakened due to a reduced likelihood of a Federal Reserve rate cut in December. Traders are awaiting Thursday's highly anticipated September non-farm payroll data. The CME FedWatch Tool shows the market currently prices a 49% probability of a 25-basis-point rate cut at the Fed's December meeting, down from 67% a week ago. US President Trump said in an Oval Office interview on Tuesday that he "very much wants" to remove Fed Chairman Powell from his post immediately. Trump added that he already has a preferred candidate and noted that some "surprising names" are being considered, although the administration may ultimately choose a more conventional option.
The pound/dollar continues to trade below the 30-day and 50-day simple moving averages (1.3241 and 1.3341), keeping the overall trend defensive. Recent candlesticks show a pause after the sharp drop in October, with the pair holding above the early November lows near 1.3010 and the psychological level of 1.3000. The latest trading session shows tight trading around 1.3050-1.3060, with neither buyers nor sellers showing confidence. The 14-day Relative Strength Index (RSI) has risen from oversold territory but remains below the midpoint, suggesting a mild recovery rather than a change in direction. The Stochastic Oscillator has crossed upwards but remains in the middle of its range, consistent with the current sideways movement. The pair is stabilizing after a sharp drop, with upside targets at the 1.3200 psychological level and the 1.3215 (last week's high) area, and downside targets at 1.3046 (November 6 low), 1.3010 (November 4 low), and the 1.3000 (psychological level) area.
Consider going long on GBP/JPY around 1.3048 today; Stop loss: 1.3035; Target: 1.3100; 1.3110
USD/JPY
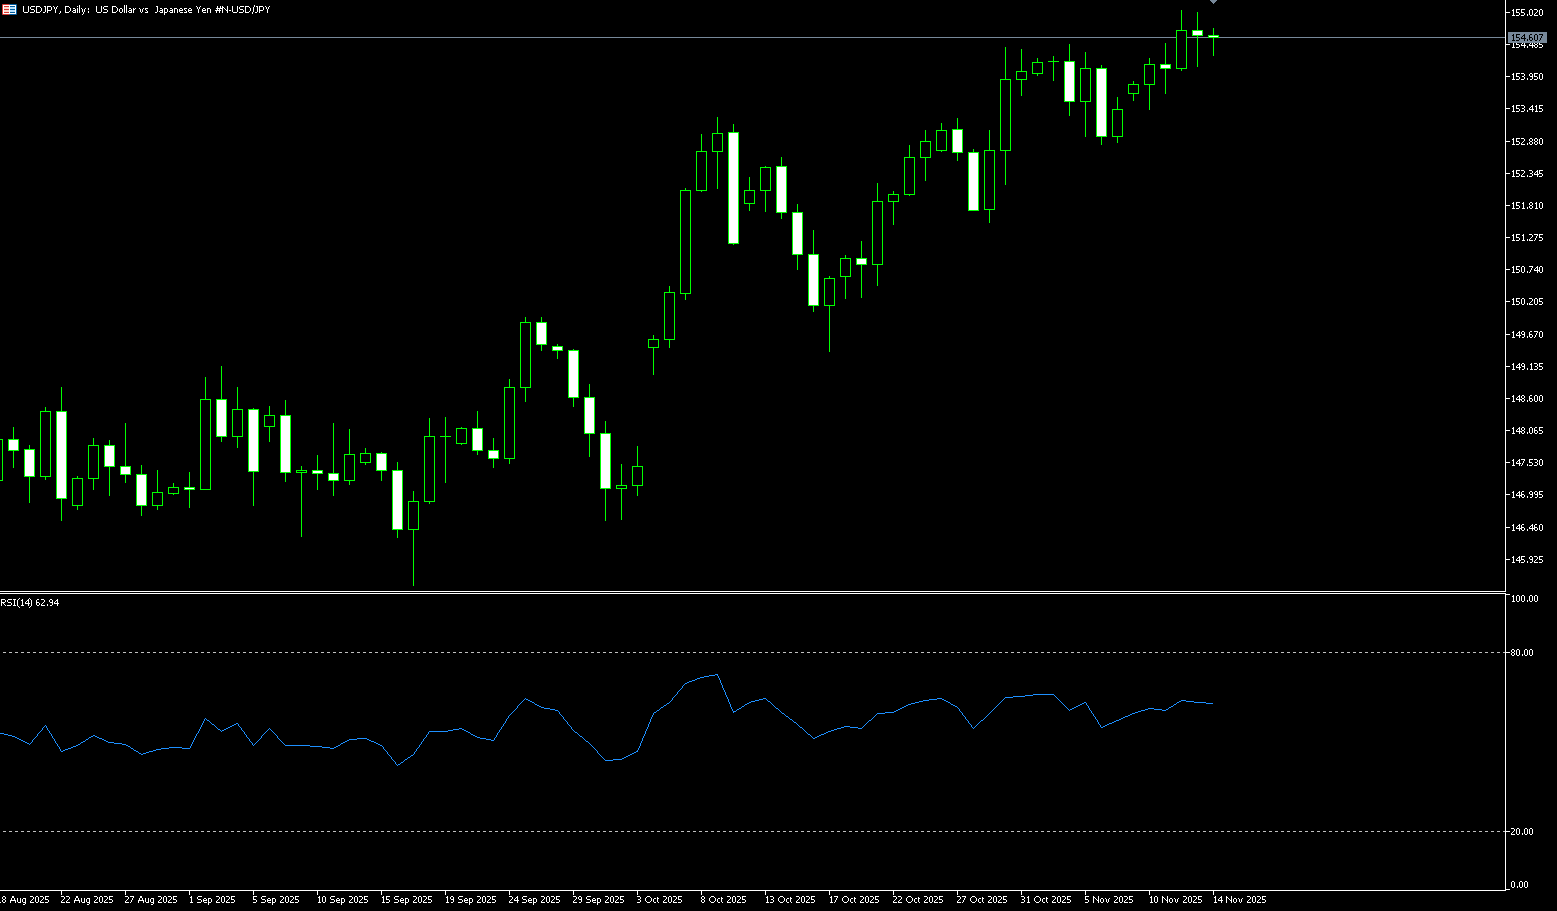
USD/JPY continued its upward trajectory on Wednesday, surging to levels last seen in mid-January. At the time of writing, the exchange rate was around 157.15, up nearly 1.0%, marking its third consecutive day of gains, with a strong dollar and a generally weak yen continuing to provide dual support. Global risk sentiment remains fragile due to concerns about the US economy, keeping dollar bulls on the defensive and supporting the yen's safe-haven status. Furthermore, speculation that Japanese authorities will intervene in the market to curb further depreciation of the yen is another positive factor. Meanwhile, investors remain uncertain about the Bank of Japan's policy tightening path due to Prime Minister Sanae Takashi's expansionary fiscal policy stance and her preference for low interest rates. This is a key factor in the yen's recent relative underperformance and may limit its further gains. Traders may also choose to await the release of the FOMC meeting minutes for clues about the path of interest rate cuts, which will have a significant impact on the US dollar and provide new momentum for the USD/JPY pair.
This week, USD/JPY closed above the psychological level of 155.00 for the second consecutive week, and positive oscillators indicate that the path of least resistance for the pair remains upward. The exchange rate surged to 157.15, a level last seen in mid-January, making further strong momentum and a return to the 158.00 level a clear possibility. Momentum could extend further to the next relevant hurdle near the 158.50-158.60 area, a break above which would see the spot price climb to the psychological level of 160.00. On the other hand, a corrective pullback is likely to find considerable support near the 156.00 level, with any further weakness more likely to attract new buyers near the 155.50-155.45 resistance level. The latter should serve as a key turning point; below this level, USD/JPY may continue its decline towards the 155.00 level.
Today, consider shorting the US dollar near 157.35; Stop loss: 157.55; Target: 156.40; 156.30
EUR/USD
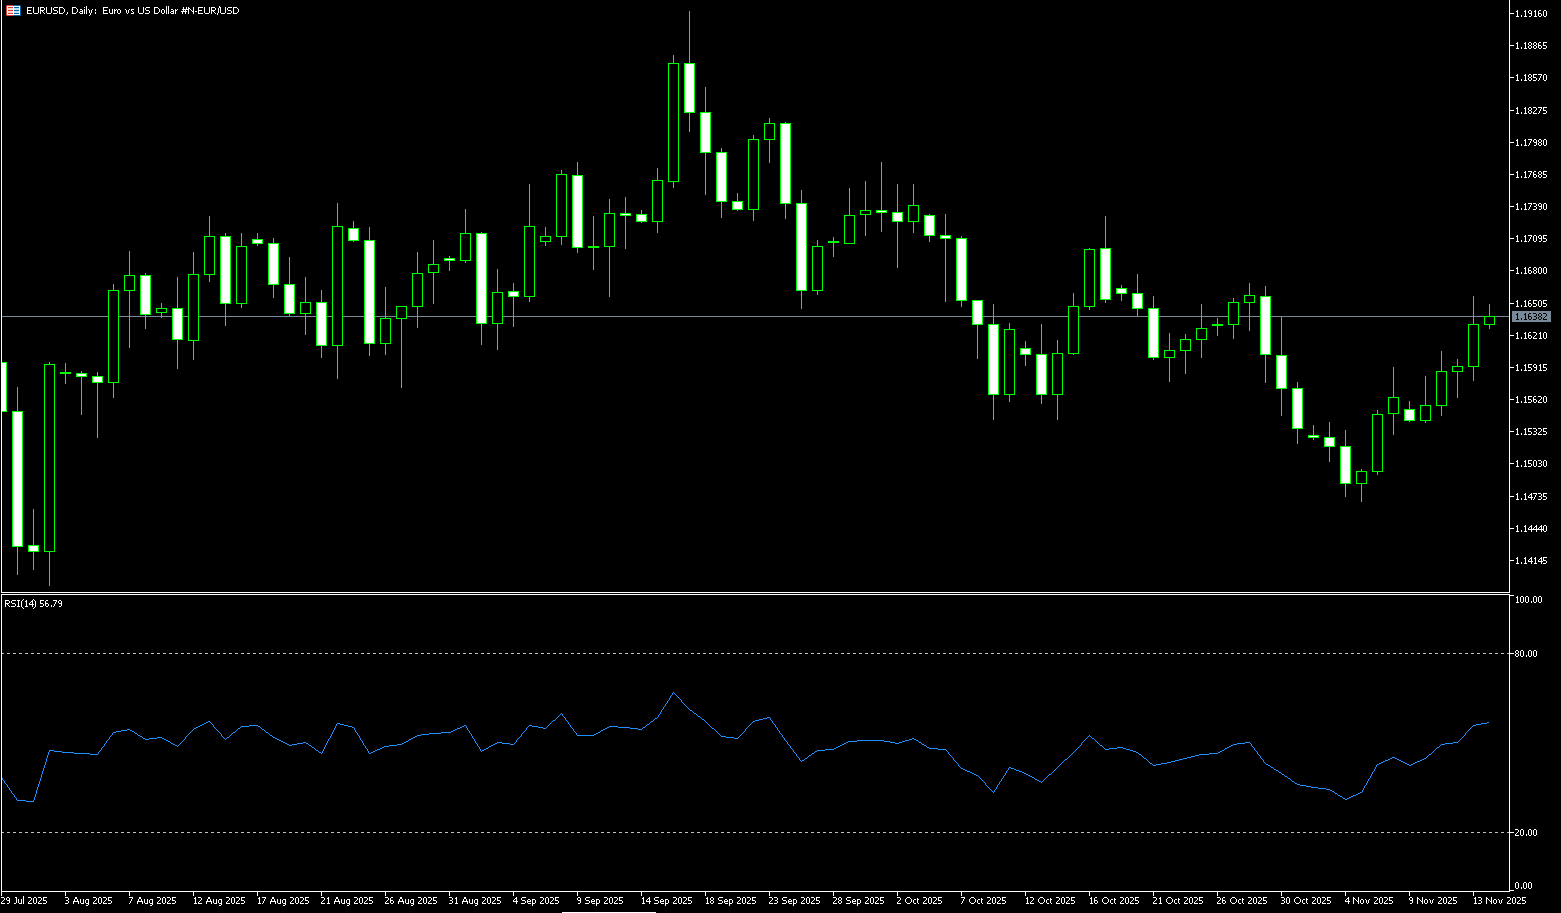
The euro/dollar pair fell more than 0.50% on Wednesday, as the Federal Reserve hinted at a possible skipping of rate cuts at its December meeting, based on the minutes of the October meeting. The pair traded at 1.1524, having touched a daily low near 1.1517. The pair may further lose ground as bets on a Fed rate cut decline and the dollar strengthens. The highly anticipated September non-farm payroll data is scheduled for release on Thursday. ADP reported that employers cut an average of 2,500 jobs per week in the four weeks ending November 1. Richmond Federal Reserve President Thomas Barkin, commenting on the economic outlook on Tuesday, noted that the labor market appears more balanced, adding that inflation does not appear to be rising, but it is unclear whether it will return to the Fed's 2% target. He emphasized that reaching a broad policy consensus remains difficult without clearer data. Due to cautious sentiment regarding the near-term outlook for the European Central Bank's monetary policy, the euro attempted to remain stable against the dollar. The ECB is expected to keep interest rates unchanged, benefiting from stable economic performance and inflation near its target.
The euro fell below the 1.1600 level against the dollar. Although it formed a "double top" resistance at 1.1665 (October 29th) and 1.1655 (November 13th), the recent strong rebound in the euro, coupled with the long bullish candlestick following the US non-farm payrolls data on August 1st, has created a "double bottom" bullish pattern. Currently, the exchange rate remains in a stalemate, with bulls and bears each holding their ground. At this stage, further upward momentum for the euro/dollar should encounter significant resistance at the current monthly high of 1.1600. Above this area, the pair may attempt to move towards the weekly high of 1.1668 (October 28th) and 1.1700 (psychological level), followed by the October high of 1.1778 (October 1st). A recovery in downside bias should open the door at 1.1517 (Wednesday's low) and the 1.1500 psychological level, with further downside targeting the 1.1468 level, the low for this month.
Consider going long on the Euro today near 1.1526; Stop loss: 1.1512; Target: 1.1580; 1.1690
Disclaimer: The information contained herein (1) is proprietary to BCR and/or its content providers; (2) may not be copied or distributed; (3) is not warranted to be accurate, complete or timely; and, (4) does not constitute advice or a recommendation by BCR or its content providers in respect of the investment in financial instruments. Neither BCR or its content providers are responsible for any damages or losses arising from any use of this information. Past performance is no guarantee of future results.
More Coverage


Risk Disclosure:Derivatives are traded over-the-counter on margin, which means they carry a high level of risk and there is a possibility you could lose all of your investment. These products are not suitable for all investors. Please ensure you fully understand the risks and carefully consider your financial situation and trading experience before trading. Seek independent financial advice if necessary before opening an account with BCR.
BCR Co Pty Ltd (Company No. 1975046) is a company incorporated under the laws of the British Virgin Islands, with its registered office at Trident Chambers, Wickham’s Cay 1, Road Town, Tortola, British Virgin Islands, and is licensed and regulated by the British Virgin Islands Financial Services Commission under License No. SIBA/L/19/1122.
Open Bridge Limited (Company No. 16701394) is a company incorporated under the Companies Act 2006 and registered in England and Wales, with its registered address at Kemp House, 160 City Road, London, City Road, London, England, EC1V 2NX. This entity acts solely as a payment processor and does not provide any trading or investment services.

 English
 简体中文
简体中文
 繁體中文
繁體中文
 Bahasa
Melayu
Bahasa
Melayu
 Tiếng
Việt
Tiếng
Việt
 ไทย
ไทย
 日本語
日本語
 한국어
한국어
 ភាសាខ្មែរ
 español