


0
US Dollar Index
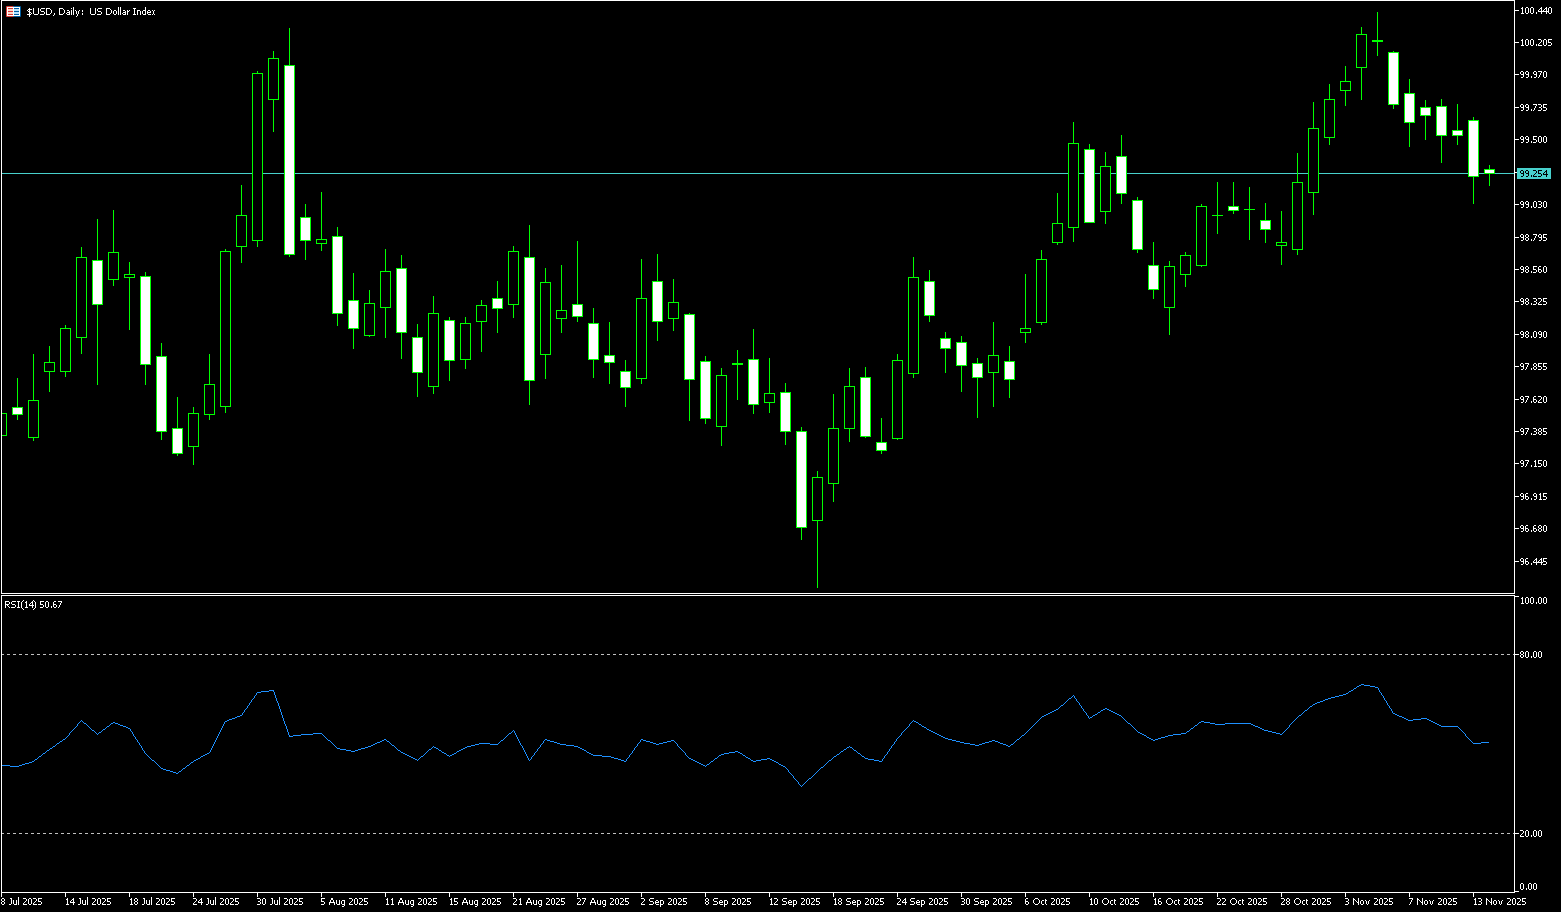
The US dollar index held steady around 99.35 on Tuesday, after hitting a three-week low on Monday, as weak manufacturing data increased market expectations for a Federal Reserve rate cut. The ISM Manufacturing Purchasing Managers' Index showed that factory activity contracted for the ninth consecutive month at the fastest pace in four months, fueling calls for further rate cuts. Traders are now pricing in an 88% probability of a 25 basis point rate cut at next week's meeting. Meanwhile, President Donald Trump announced on Sunday that he had chosen his next Federal Reserve Chairman, with reports indicating that White House National Economic Council Director Kevin Hassett is the leading candidate. Investors are now focused on comments from Federal Reserve Chairman Jerome Powell later today, which could provide additional guidance on the central bank's policy outlook.
The US dollar index rebounded sharply after testing the 99.00 level early in the week, and the subsequent reversal formed a bullish hammer candlestick pattern, suggesting potential for short-term upside. Therefore, the sustainability of the bearish breakout on the daily chart for the US dollar index remains questionable. On the upside, the previous upward trendline resistance level above the 200-day moving average at 99.60 will be a key level to watch. A sustained break above this trendline could strengthen the bullish bias and represent the next resistance level for long positions. If the US dollar index successfully breaks through the psychological level of 100, the resistance level of 100.25 will be a clear target for the bulls—the rally in November of last year encountered resistance near this level. On the downside, the area formed by the 50-day moving average at 99.11 and the psychological level of 99.00 provides reasonable initial support; if the correction continues, the 100-day moving average at 98.58 is a possible subsequent support level.
Today, consider shorting the US Dollar Index around 99.45; Stop loss: 99.56; Target: 99.05; 99.00
WTI Crude Oil
WTI crude oil is trading around $58.60 per barrel. Oil prices rose on Monday, supported by concerns about supply disruptions triggered by the Ukrainian drone attack on Russia, as well as uncertainty surrounding the Venezuelan geopolitical situation. The market is currently very sensitive to potential Russian oil supply risks and is closely monitoring developments in the Russia-Ukraine situation. Previously, Brent and US crude oil futures had fallen for four consecutive months, marking the longest losing streak since 2023, mainly due to continued pressure on oil prices from expectations of increased global supply. On the other hand, OPEC+ decided to maintain current production policies in the first quarter of next year, while the drone attack on the Black Sea CPC pipeline caused partial loading disruptions, significantly increasing market uncertainty regarding the supply side. Tensions between the US and Venezuela have further fueled concerns about export risks. Overall, the combination of multiple supply variables has kept oil prices relatively strong despite resilient demand. The current rise in the crude oil market is more driven by supply-side event-driven disruptions than by a trend-based change in the supply-demand structure. Overall, short-term oil prices are supported by expectations of tightening supply, but the medium-term trend will depend on the strength of demand recovery and the further evolution of geopolitical risks.
Looking at the daily chart of US crude oil, prices have formed a steady rebound structure after breaking through short-term moving average resistance. Currently, prices have closed higher for several consecutive days and are holding above the moving averages at 57.59 (October 26th low) and 58.00 (psychological level), indicating strengthening bullish momentum. The MACD indicator has formed a golden cross at a low level and is approaching the zero line, with the momentum bars gradually expanding, suggesting further strengthening of the trend. Support levels to watch are 57.59 (October 26th low) and 57.05 (October 25th low). If these levels hold, bulls have a chance to test the 60.00 (psychological level) and 61.54 (89-day moving average).
Today, consider going long on spot crude oil around 58.38; Stop loss: 58.25; Target: 60.00; 60.30

Spot Gold
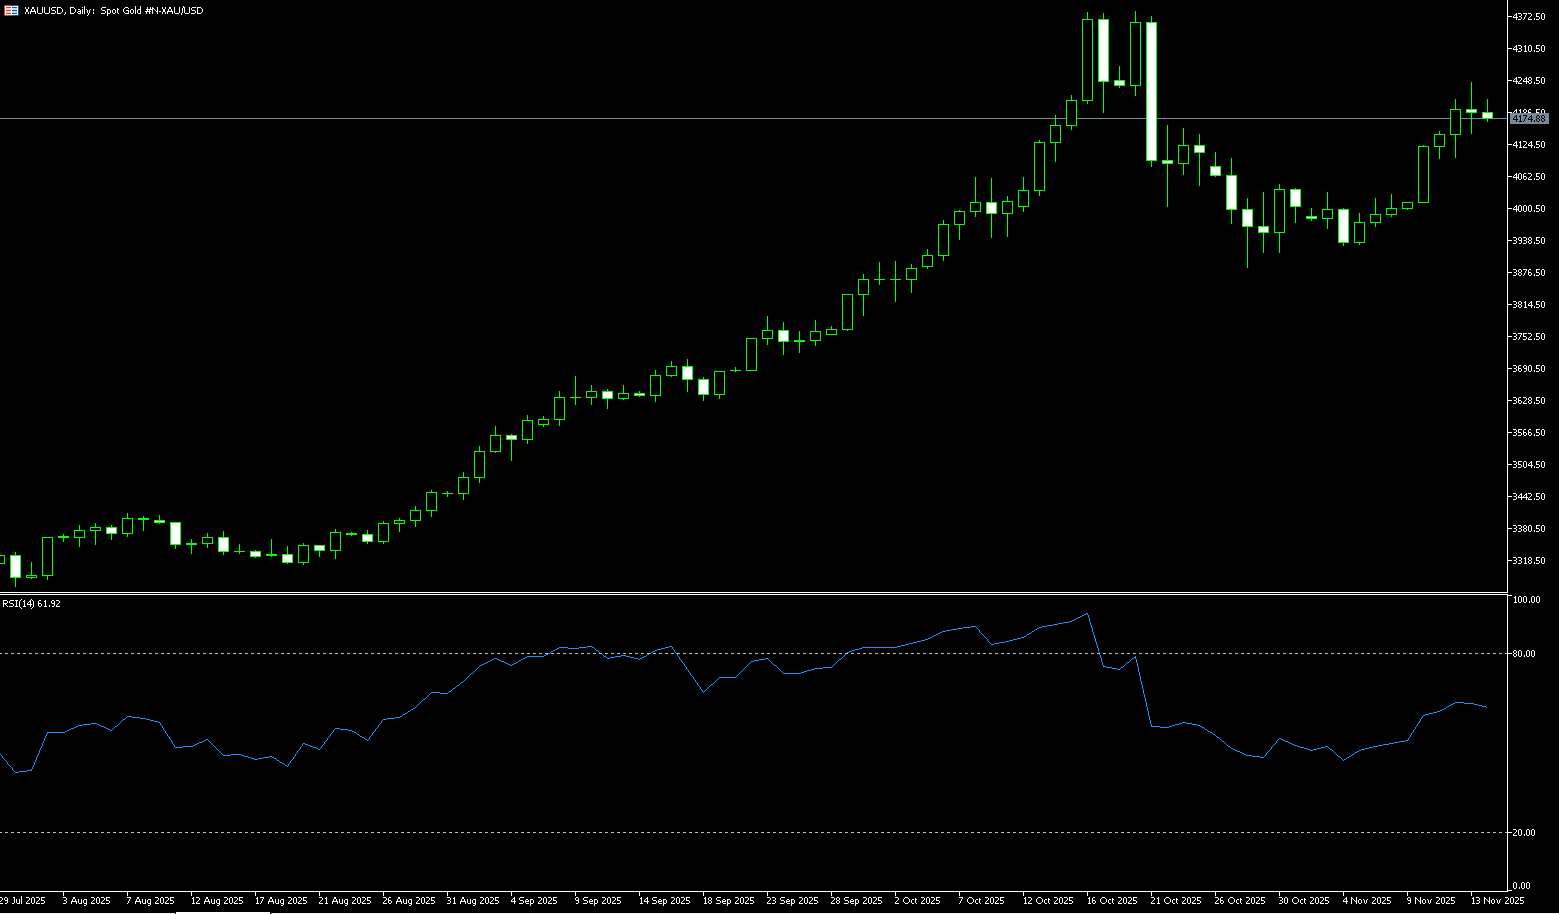
Gold fell to $4164 per ounce on Tuesday as investors took profits after prices hit a six-week high on Monday, with increasing expectations of a US interest rate cut next week. Gold prices rose on Monday, reaching a six-week high of $4264.60 per ounce at one point; safe-haven demand provided support, with expectations of further interest rate cuts by the Federal Reserve being the core factor supporting gold prices. Market analysts believe that expectations of further interest rate cuts by the Federal Reserve are the core factor supporting precious metal prices. Currently, traders expect the probability of a rate cut by the Federal Reserve at its December meeting to have risen to 87%. In addition, market speculation that the next Federal Reserve chairman may take a more dovish stance has further boosted market sentiment. Gold prices have risen nearly 60% year-to-date, supported by strong central bank purchases, continued ETF inflows, persistent geopolitical tensions, and expectations of US interest rate cuts. Meanwhile, the dollar index fell to a two-week low, making dollar-denominated gold cheaper for holders of other currencies, thus increasing demand.
The 4-hour chart shows that spot gold has successfully broken out of a clear symmetrical triangle pattern, a breakout signal indicating a continuation of the bullish trend. Although momentum has improved after the breakout, short-term follow-through buying remains limited as the Relative Strength Index (RSI) remains in overbought territory around 65. This factor has led to gold prices consolidating within the previous resistance range of $4,250-$4,270. A successful breakout of this range would strengthen bullish sentiment, targeting the psychological level of $4,300 and opening up potential for testing the historical high near $4,381. On the downside, initial support is at $4,187, near the 21-period simple moving average on the 4-hour chart, with further support at the $4,150 level, the upper edge of the broken triangle pattern.
Consider going long on spot gold today around $4,205; Stop loss: $4,200; Target: $4,230; $4,240
AUD/USD
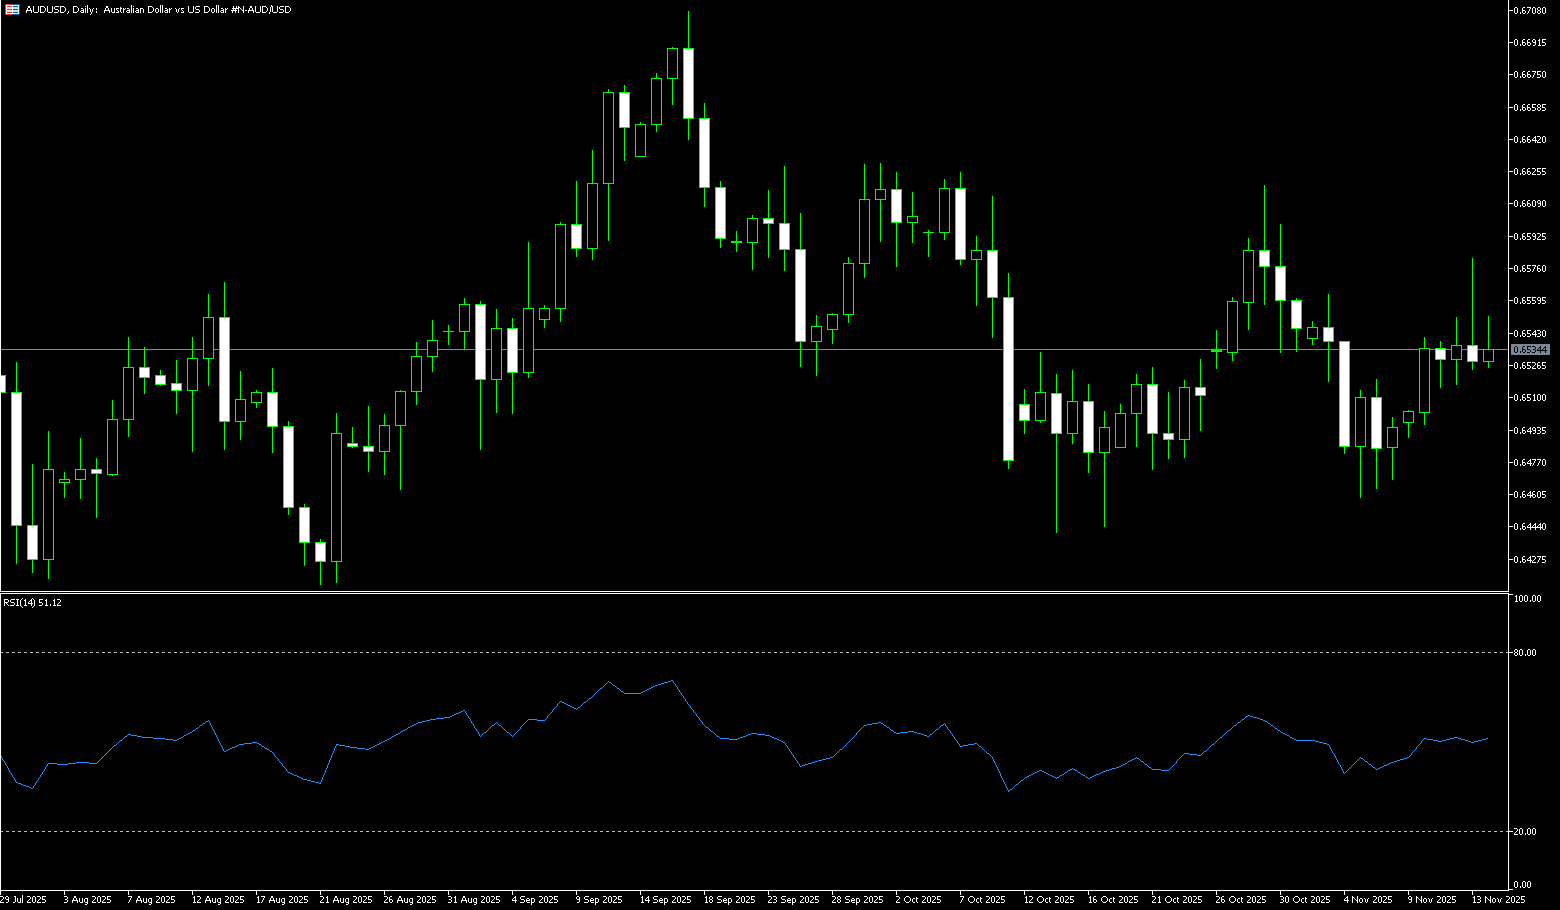
The Australian dollar stabilized around $0.6560 after hitting a two-week high of $0.6570 at the start of the week, supported by strong economic data that fueled market expectations of a possible interest rate hike by the Reserve Bank of Australia. The manufacturing purchasing managers' index climbed to a three-month high in November, while the decline in ANZ-Indeed job advertisements slowed, indicating weak hiring demand. Last week, the first full monthly price release showed that price pressures remained high, with overall inflation rising to a seven-month high and trimmed mean inflation exceeding expectations. Market focus is now shifting to this week's third-quarter GDP release, with forecasts suggesting strong economic growth could fuel speculation about a rate hike in early 2026. Externally, the Australian dollar is also supported by a weaker US dollar, as the market now anticipates an 87% probability of an 85% rate cut at the Federal Reserve's policy meeting next week.
From a technical perspective, AUD/USD has found support above the 20-day simple moving average at 0.6507 and the psychological level of 0.6500, and is looking to build momentum after breaking through the downtrend line extending from the September high of 0.6707. The oscillator on the daily chart is just beginning to gain positive momentum, further supporting a move towards the 0.6600 level. A sustained strong break above the latter should pave the way for further short-term appreciation and push the AUD/USD pair towards the next relevant resistance level near the 0.6660-0.6665 area. Momentum could extend further to test the September high of 0.6707. On the other hand, the 20-day simple moving average at 0.6507 and the psychological level of 0.6500 now appear to be direct support. A decisive break below the latter could expose the key support near the 200-day simple moving average at 0.6465.
Consider going long on the Australian dollar today around 0.6553; Stop loss: 0.6540; Target: 0.6590; 0.6600
GBP/USD
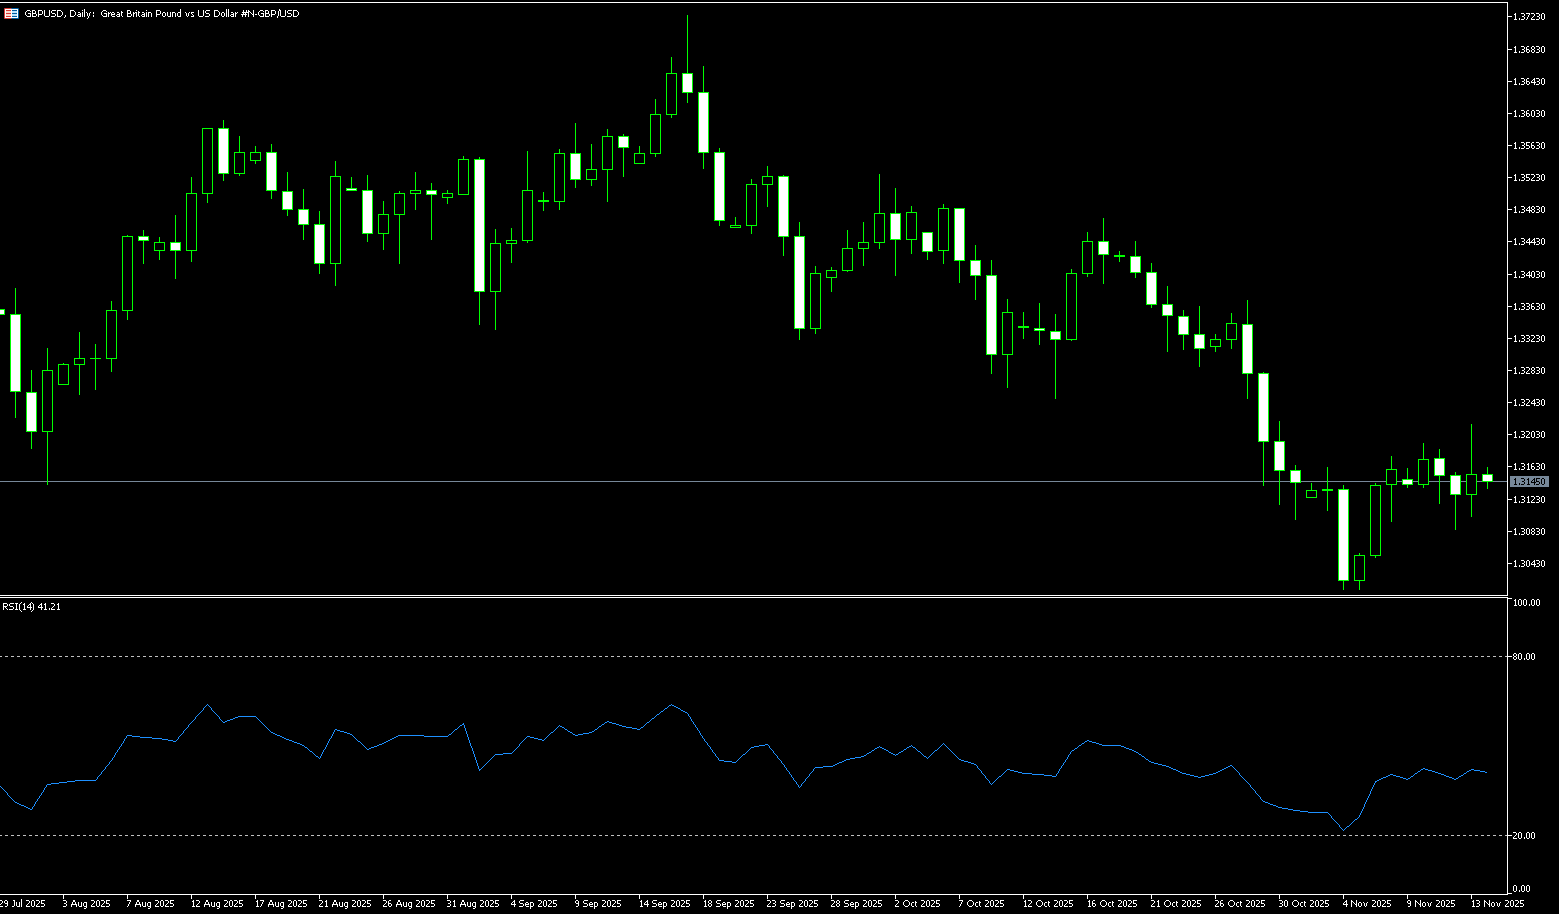
GBP/USD struggled with 1.3200 during Tuesday's early European trading session, consolidating its sharp pullback from a five-week high of 1.3276. Growing market expectations that the Bank of England will cut its benchmark interest rate at its December 18th monetary policy meeting put downward pressure on the pound against a backdrop of a generally stronger US dollar. Buyers were unimpressed by the brief relief from the UK autumn budget, as sentiment surrounding central bank expectations dominated the market, and no major economic data was released on Tuesday from either side of the Atlantic. On the other hand, markets continue to digest the UK's November budget while awaiting a series of US economic data this week to clarify the global interest rate outlook. Chancellor Rachel Reeves rejected allegations of misleading the public about the UK's fiscal situation before the budget, and Prime Minister Keir Starmer defended the measures, calling them "necessary options" to avoid additional borrowing.
From a short-term technical perspective, the daily chart shows the 21-day simple moving average (SMA) at 1.3148 slightly rising, while the 50-day SMA at 1.3270 continues to decline. The 14-day Relative Strength Index (RSI) is at 50.70, neutral, suggesting that momentum is stabilizing after the recent rally. Initial support is at the 21-day SMA at 1.3148, with considerable support found near 1.3100. The first resistance is at the 50-day SMA at 1.3270. A daily close above the latter could begin to ease bearish pressure until the pair re-breaks higher moving average resistance. The 200-day simple moving average has risen to 1.3318, forming an upper resistance level that limits any rebound.
Consider going long on GBP/USD today around 1.3200; Stop loss: 1.3188; Target: 1.3250; 1.3255
USD/JPY
The yen weakened against the dollar on Tuesday to around 156.00, retreating from a three-day winning streak as traders locked in profits. The recent rally was driven by bets on a possible interest rate hike by the Bank of Japan, suggesting a potential shift in monetary policy direction. In the latest news, Finance Minister Katayama stated that she believes there are no disagreements between the government and the Bank of Japan on the economic assessment, highlighting continued coordination between fiscal and monetary policies. She also noted that she expects the Bank of Japan to maintain close coordination with the government to implement monetary policy measures aimed at achieving the 2% inflation target and supporting sustainable wage growth. Katayama's comments followed those of Bank of Japan Governor Kazuo Ueda, who expressed confidence in the Japanese economic outlook and stated that the central bank would carefully consider the pros and cons of raising interest rates at its December policy meeting.
The USD/JPY pair's corrective move from the 158.00 area (its highest level since mid-January) has been along a downward-sloping channel. The overnight rebound validated the trend channel support, which coincides with the 61.8% Fibonacci retracement level of the November rally and should now act as a key turning point. A decisive break below this level would be seen as a new trigger for bearish traders and pave the way for a two-week downtrend for the pair. Meanwhile, the psychological level of 155.00, as well as the psychological levels of 154.50 and 154.00, are likely to protect the short-term downside. On the other hand, any subsequent gains are likely to face strong resistance near the 156.00 area, representing the upper boundary of the aforementioned trend channel. If the strong breakout continues, it could trigger a short-term pullback and push USD/JPY to the intermediate resistance level of 156.60-156.65, and then move towards the psychological level of 157.00. Momentum could extend further to the mid-157.00 range, after which the spot price will attempt to reclaim the 158.00 level again.
Consider shorting USD near 156.10 today; Stop loss: 156.30; Target: 155.15; 155.00

EUR/USD
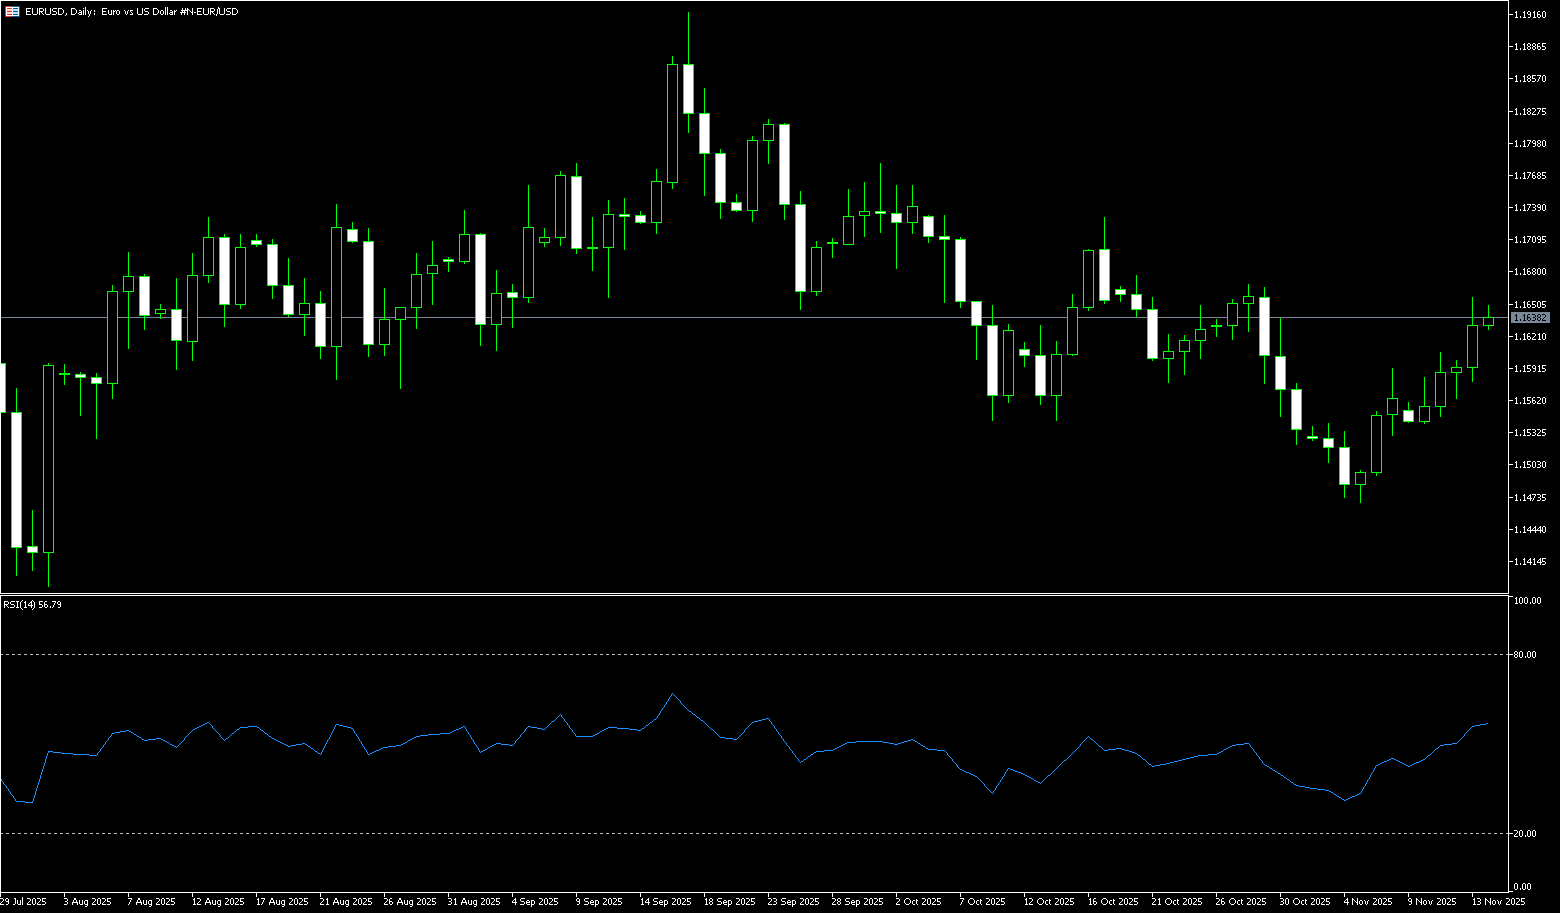
EUR/USD continued its upward trend on Tuesday, reaching near 1.1620. The dollar weakened against the euro as weaker-than-expected US manufacturing purchasing managers' index (PMI) data increased pressure on the Federal Reserve to cut interest rates later this month. Data released Monday by the Institute for Supply Management (ISM) showed that US manufacturing contracted for the ninth consecutive month in November, with the manufacturing PMI falling to 48.2 from 48.7 in October. The figure was lower than the expected 48.6. The shared currency is gaining increasing acceptance, meaning the ECB has stopped cutting interest rates. ECB President Christine Lagarde stated last week that borrowing costs are at an “appropriate level.” Meanwhile, ECB Governing Council member Joachim Nagel noted his satisfaction with the monetary policy setup. Any signs of slowing eurozone inflation could put pressure on the euro against the dollar in the short term.
The euro/dollar pair remains strong under the influence of US dollar dynamics, and the short-term outlook for the pair still looks optimistic. That said, the Relative Strength Index (RSI) has risen above 55, indicating improved upward momentum, although the Average Directional Index (ADX) below 12 still indicates a weak trend. However, challenging the 1.1660 area will be a difficult task. Further upward momentum is expected to face the November high of 1.1656 (November 13). A break above this area would expose potential upside to the weekly highs of 1.1668 (October 28) and 1.1728 (October 17). Conversely, a break below the weekly low of 1.1491 (November 21st) could open the door to the November low of 1.1468 (November 5th), followed by the key 200-day simple moving average at 1.1439. The August low of 1.1391 (August 1st) from here then re-enters the picture.
Consider trading the Euro around 1.1610 today; Stop Loss: 1.1600; Target: 1.1655; 1.1650
Disclaimer: The information contained herein (1) is proprietary to BCR and/or its content providers; (2) may not be copied or distributed; (3) is not warranted to be accurate, complete or timely; and, (4) does not constitute advice or a recommendation by BCR or its content providers in respect of the investment in financial instruments. Neither BCR or its content providers are responsible for any damages or losses arising from any use of this information. Past performance is no guarantee of future results.
More Coverage


Risk Disclosure:Derivatives are traded over-the-counter on margin, which means they carry a high level of risk and there is a possibility you could lose all of your investment. These products are not suitable for all investors. Please ensure you fully understand the risks and carefully consider your financial situation and trading experience before trading. Seek independent financial advice if necessary before opening an account with BCR.
BCR Co Pty Ltd (Company No. 1975046) is a company incorporated under the laws of the British Virgin Islands, with its registered office at Trident Chambers, Wickham’s Cay 1, Road Town, Tortola, British Virgin Islands, and is licensed and regulated by the British Virgin Islands Financial Services Commission under License No. SIBA/L/19/1122.
Open Bridge Limited (Company No. 16701394) is a company incorporated under the Companies Act 2006 and registered in England and Wales, with its registered address at Kemp House, 160 City Road, London, City Road, London, England, EC1V 2NX. This entity acts solely as a payment processor and does not provide any trading or investment services.

 English
 简体中文
简体中文
 繁體中文
繁體中文
 Bahasa
Melayu
Bahasa
Melayu
 Tiếng
Việt
Tiếng
Việt
 ไทย
ไทย
 日本語
日本語
 한국어
한국어
 ភាសាខ្មែរ
 español