


0
US Dollar Index
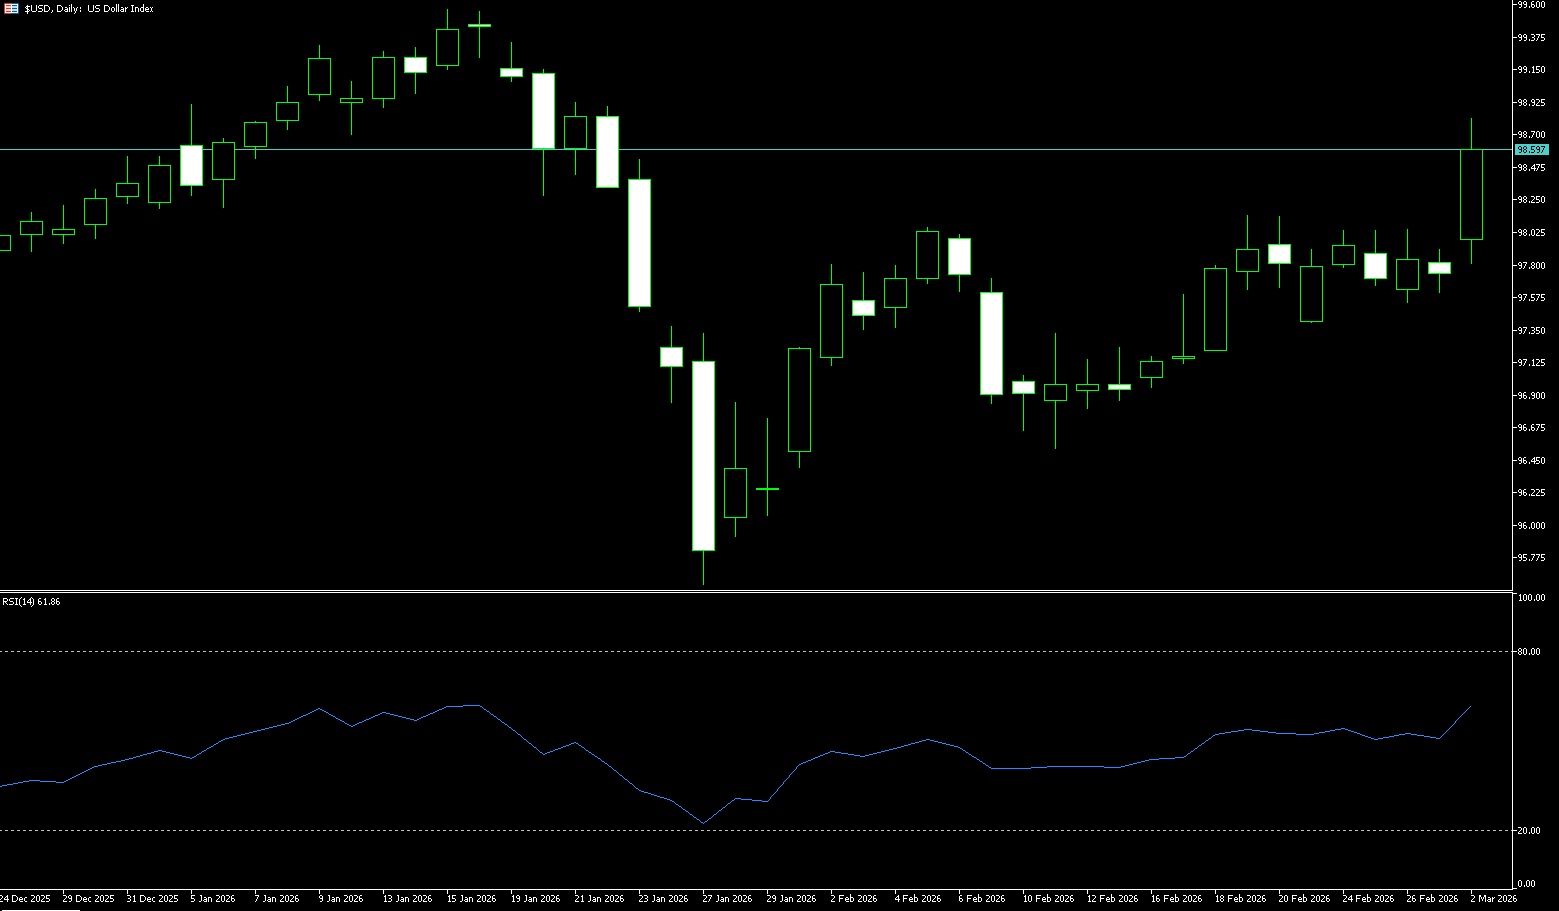
The US dollar index rose on Monday, reaching 98.56, its highest level in five weeks, as investors turned to safe-haven assets following the weekend's US and Israeli strikes against Iran that killed Iran's Supreme Leader Ayatollah Ali Khamenei. The conflict has significantly disrupted maritime traffic in the oil-rich Gulf region. Iran has also launched attacks on US assets in neighboring countries, including the United Arab Emirates, Bahrain, Kuwait, Qatar, Saudi Arabia, Jordan, Iraq, and Syria. The dollar index fell as much as 0.12% to 97.61 on Friday, but recorded its first monthly gain since October in February, rising 0.47%, although gains triggered by better-than-expected January producer price index (PPI) data had faded as traders closed out positions ahead of the month and weekend.
The dollar was also boosted this week by safe-haven buying triggered by concerns over the US-Iran conflict. However, the foreign exchange market saw relatively flat volatility this week, with traders assessing the impact of geopolitical uncertainties and new tariffs. The US dollar is consolidating slightly, seemingly awaiting its next real catalyst. On the daily chart, the US dollar index remains below Monday's high of 98.56 and the 100-day simple moving average of 98.54, while trading below the declining 200-day simple moving average at 98.35, continuing broader trend pressure. The Relative Strength Index (RSI) hovers around 53, highlighting a lack of strong momentum, consistent with a floating downward tone rather than impulsive selling. Immediate resistance is at the 200-day simple moving average of 98.35, followed by the 100-day simple moving average at 98.54. A clear break below 97.65 (last Friday's low) would open the way to deeper support at the 25-day simple moving average level.
Today, consider going long on the US Dollar Index around 98.45; Stop loss: 98.35; Target: 98.80; 98.90
WTI Crude Oil
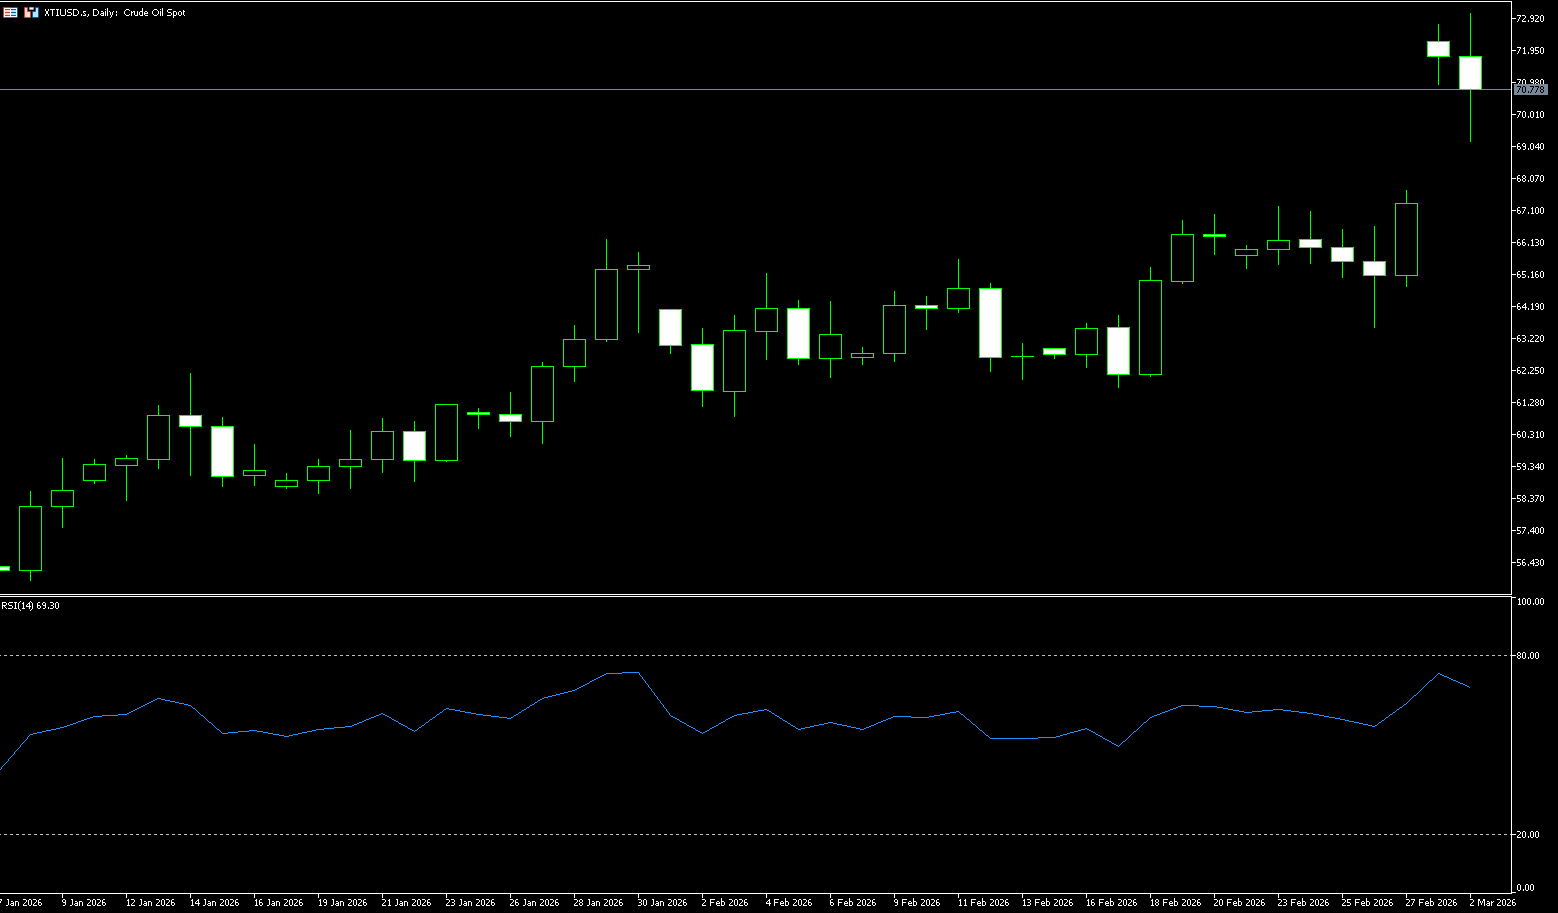
Oil prices opened nearly 10% higher on Monday, with US crude reaching a high of $73.20 per barrel, a new high since June 23, 2025. Despite OPEC's announcement over the weekend of increased production in April, short-term Middle East geopolitical tensions are dominating oil prices. Tensions between the US and Iran have exacerbated concerns about a disruption in the Strait of Hormuz. The Strait of Hormuz is packed with oil tankers, with over 250 ships anchored and waiting. US crude may test the $75 per barrel mark today. With the sharp deterioration of the situation in Iran over the weekend—especially the assassination of Iranian Supreme Leader Khamenei by the joint US-Israel military action, and the subsequent missile retaliation and the de facto paralysis of the Strait of Hormuz—the impact of this Iranian situation is far greater than that of Venezuela or the previous Red Sea crisis. Venezuela was merely a matter of production increases or decreases, while the Iranian situation involves the potential blockage of a "global energy choke point." If the Strait of Hormuz faces a prolonged blockade, global inflationary pressures will reignite, potentially forcing central banks to reassess their monetary policy paths.
From a technical perspective, the overnight surge in oil prices has allowed bulls to regain control of the market. Late last week, oil prices briefly fell below a key trendline to $63.60, before strong buying pulled prices back above this key level of $65.56. Buying also broke through Monday's high of $67.28, strengthening upward momentum. At the beginning of this week, prices rose above the psychological level of $70 to $73.20 per barrel, a new high since June 23, 2025. There is potential to challenge the previous high of $76.74 (June 2025 high) and even the psychological level of $80. On the other hand, the first support level is at $70 (a psychological level). If the rebound is weak, a test of the $67.24 support level (last week's high) is more likely. A break below this level would further challenge the $66.52 (9-day moving average) area.
Today, consider going long on crude oil around 70.45; stop loss: 70.30, target: 72.00; 72.50
Spot Gold
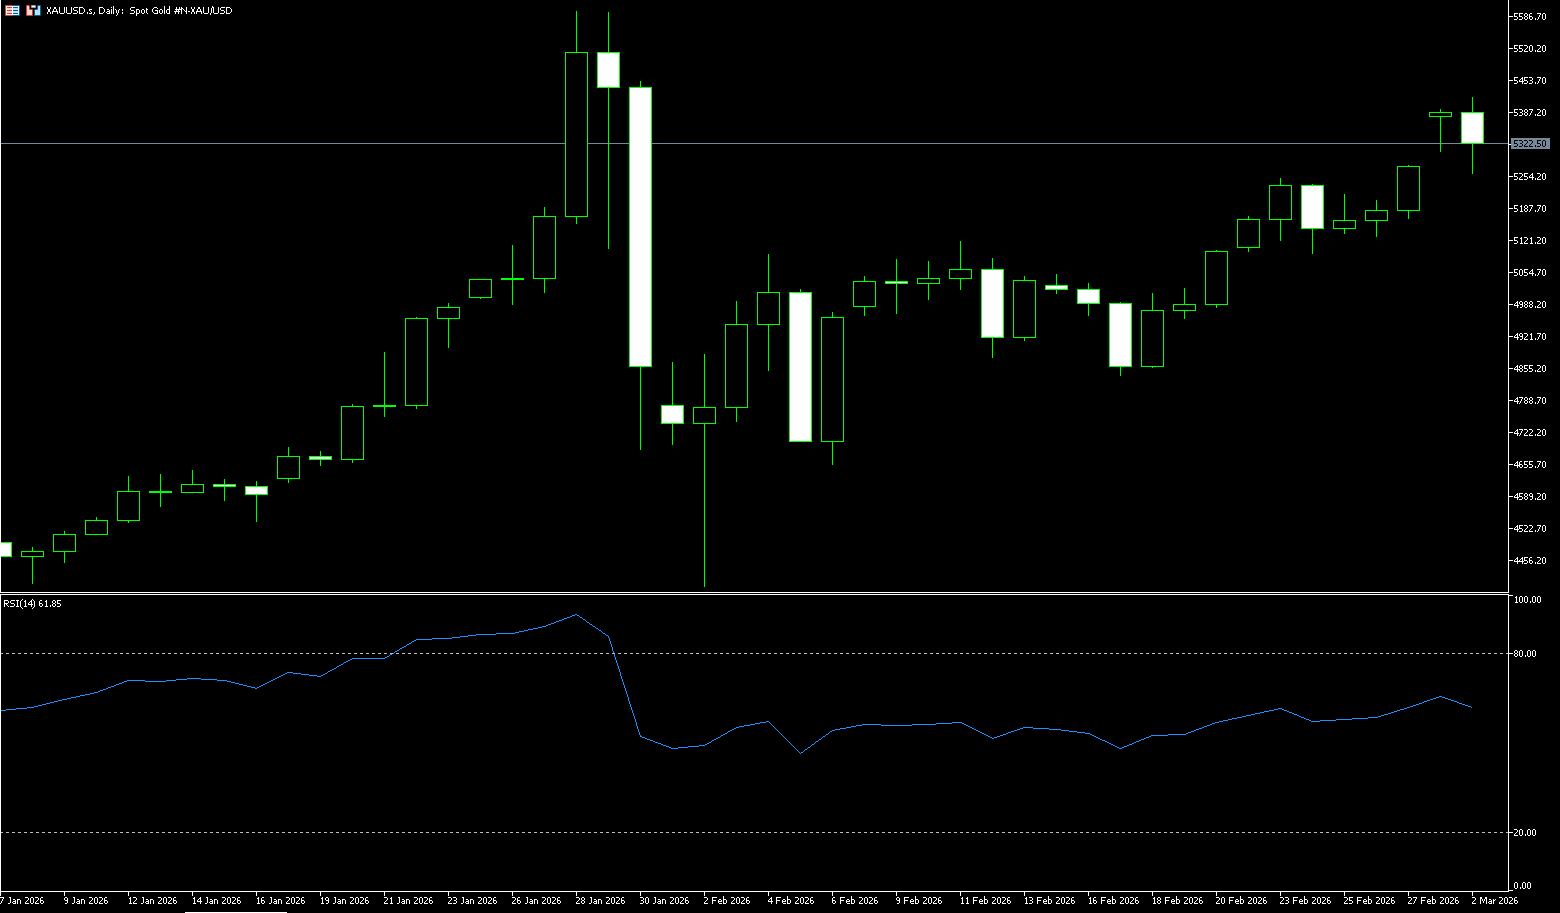
In early Asian trading on March 2nd (Beijing time), spot gold opened higher by over 2.0%, reaching a one-month high of $5,420 per ounce. This was due to escalating tensions in the Middle East following the weekend's US and Israeli attacks on Iran, which resulted in the deaths of over 40 key Iranian officials. Safe-haven demand surged, and gold prices may target the $5,500 per ounce level today. Silver and platinum also recorded monthly gains. Gold is currently in a clear upward trend and is forming a standard breakout pattern, showing strong bullish signals from a technical perspective. From a fundamental perspective, before gold finally breaks out of its long-term trading range and reaches a new historical high in 2025, it has maintained a range-bound trading pattern for nearly 40 years. During these 40 years, numerous large-scale wars and regional conflicts have occurred globally, but gold prices have consistently failed to break out of this range, remaining within a relatively stable fluctuation range.
From a technical perspective, whether gold can successfully challenge the historical high of $5,598.20 in the short term hinges on how it breaks through the core resistance zone of $5,392 (January 28 high) - $5,420 (Monday high). Different breakout methods will directly determine the strength and sustainability of the subsequent price movement. The ideal breakout pattern is: after consolidating around $5,300-$5,350, gold prices are accompanied by a significant increase in trading volume, with new buying pushing prices to officially break through this level—this type of breakout indicates strong bullish sentiment in the market for gold, potentially leading to a rapid approach to the historical high. From a support perspective, gold's secondary support currently lies in the retracement range of $5,250 to $5,226 (Monday's low), further targeting the psychological level of $5,200. A hold above the $5,300-$5,320 range would challenge the $5,400 psychological level. A break above this level would target the $5,500-$5,450 area.
Consider going long on gold today around $5,310; Stop loss: $5,300; Target: $5,360; $5,380
AUD/USD
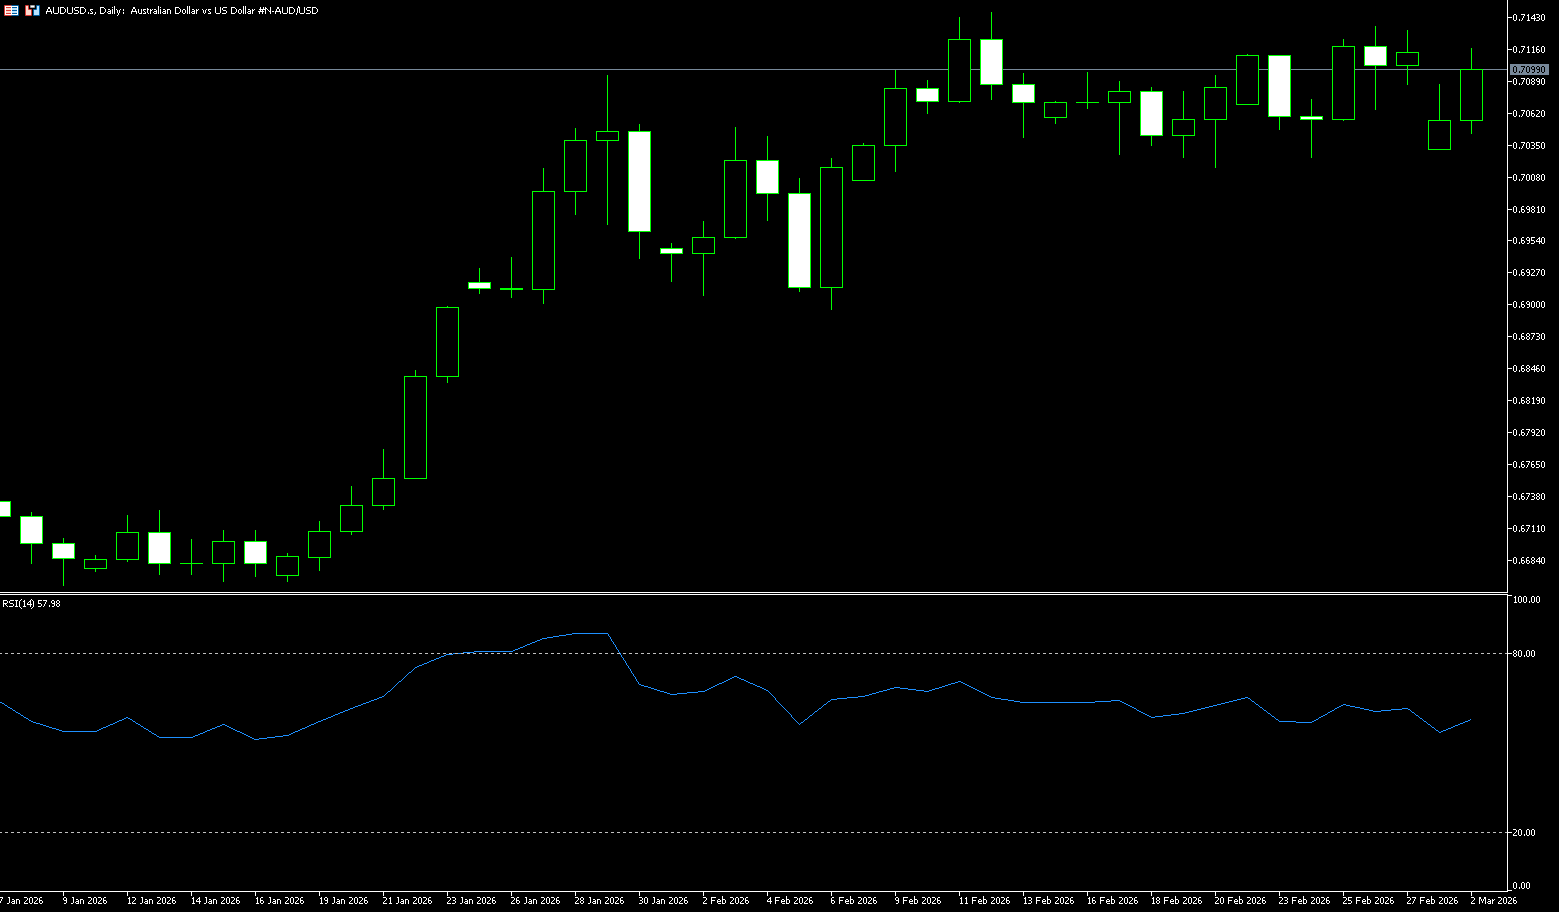
The Australian dollar fell to around $0.7033 on Monday, erasing last week's gains as investors sought safe-haven assets, such as the US dollar, amid escalating conflict in the Middle East. The coordinated US-Israeli strikes against Iran over the weekend, resulting in the death of Iran's Supreme Leader Ayatollah Ali Khamenei, prompted retaliatory attacks from Iran targeting US assets in neighboring countries, disrupting global financial markets. Escalating geopolitical uncertainty has put pressure on risk-sensitive currencies, including the Australian dollar, which is often seen as a proxy for global growth and commodity demand. Domestically, the manufacturing Purchasing Managers' Index (PMI) for February 2026 was revised down to 51 from a preliminary reading of 51.5, marking its lowest level in four months. Meanwhile, the Melbourne Institute's monthly inflation gauge fell 0.2% month-on-month in February, marking its first decline since August last year.
On the daily chart, AUD/USD is trading around 0.7100. The short-term bias is slightly bullish, as the spot price is firmly above support near the 25-day (0.7053) and 34-day (0.6978) simple moving averages, indicating that buyers have defended the middle range of the previous rally. The 14-day Relative Strength Index (RSI) is at 63, holding above the 50 midline, reinforcing positive momentum despite losing the previously seen extreme overbought reading. This indicates a still strong but stable trend background. Immediate resistance is located at 0.7141-0.7157 (February 2023 high + technical pattern resistance), and a sustained break above this level will focus on the psychological resistance zone around 0.7200. On the downside, initial support lies at the level of the 25-day (0.7053) and 34-day (0.6978) simple moving averages. A deeper pullback would expose the psychological support level at 0.6900.
Consider shorting the Australian dollar near 0.7100 today; Stop loss: 0.7110; Target: 0.7060; 0.7050
GBP/USD
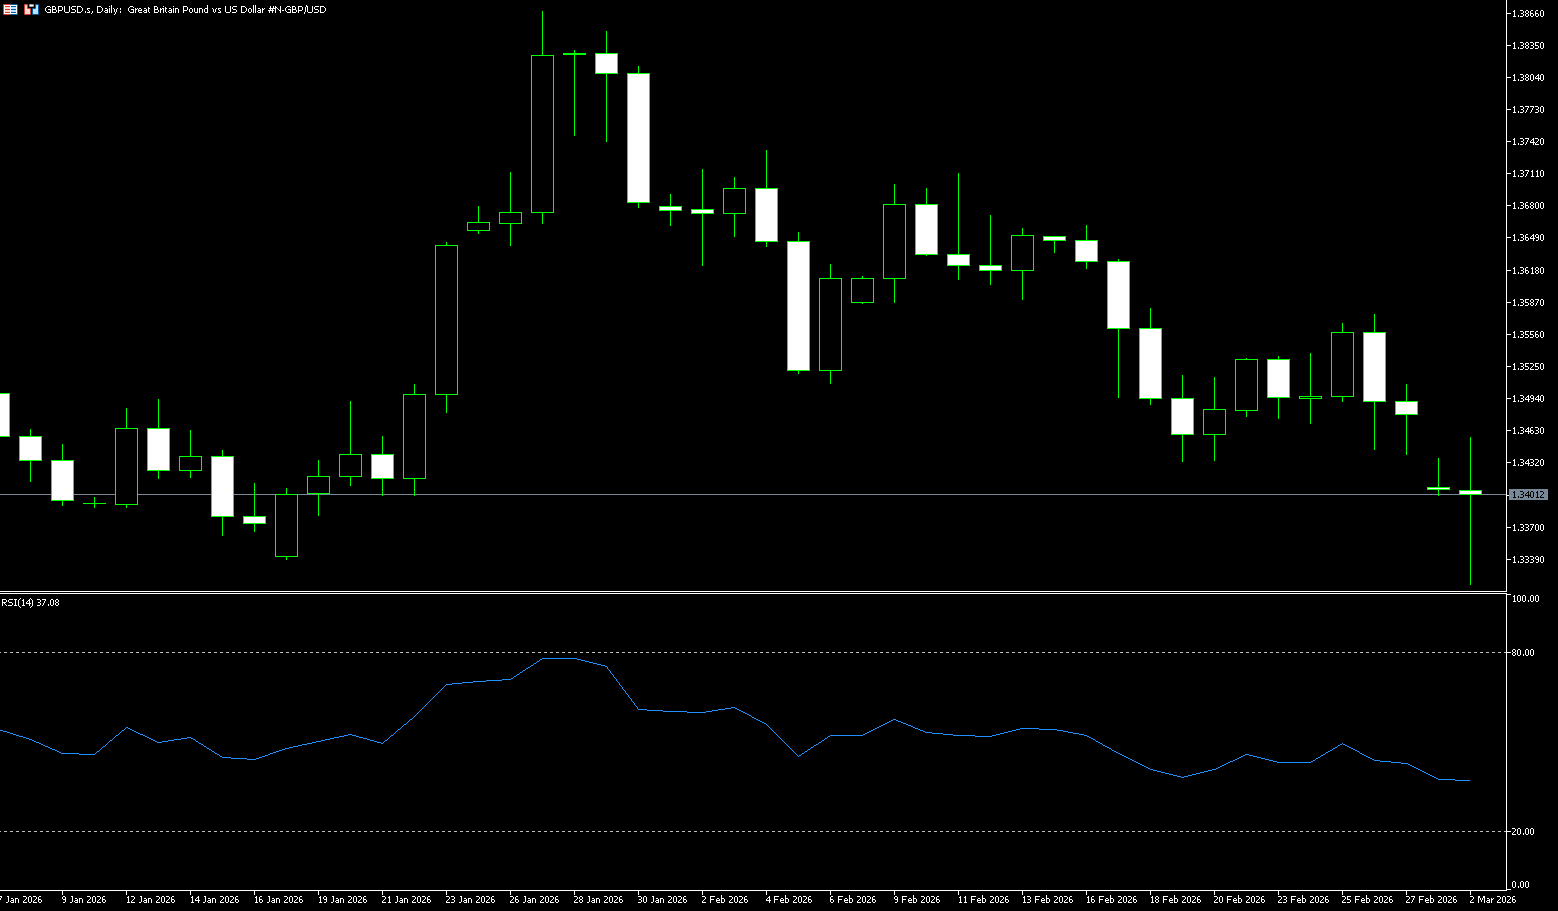
The pound fell to around $1.3315 in early March, its lowest level since December 2025, as risk aversion fueled a dollar rebound amid escalating tensions in the Middle East. The United States and Israel launched a coordinated strike against Iran over the weekend, killing Iran's Supreme Leader Ayatollah Ali Khamenei. In retaliation, Tehran attacked US assets in its neighboring country. Domestic political uncertainty intensified following Labour's unexpected defeats in Gordon and Denton, further pressuring the currency. Labour easily won those seats in the 2024 general election. This result increased concerns about Starmer and Chancellor Rachel Reeves, fearing they might be replaced by ministers pushing for higher fiscal spending, potentially exacerbating public finance pressures in the UK. Markets are now focused on a series of domestic data releases this week, including house prices, Bank of England consumer credit, mortgage approvals, the Halifax House Price Index, and Purchasing Managers' Index (PMI) readings.
Technical analysis on the daily chart suggests a persistent bearish bias, as the pair is trading within a descending channel pattern. The 14-day Relative Strength Index (RSI) is currently at 41, showing persistent bearish pressure without oversold conditions, indicating sellers remain in control but lacking an extreme capitulation. The short-term bias is slightly bearish, as spot prices remain below the 50-day simple moving average at 1.3540 and are sliding towards the flatter 9-day moving average at 1.3489, indicating weakening upward momentum. Initial support is at the reversal zone near 1.3315 (early weekly low), followed by the 1.3300 (psychological level). On the upside, near-term resistance is at the 75-day simple moving average at 1.3452, followed by the 1.3500 (psychological level).
Consider shorting GBP/USD today near 1.3412; Stop loss: 1.3424, Target: 1.3350; 1.3360
USD/JPY
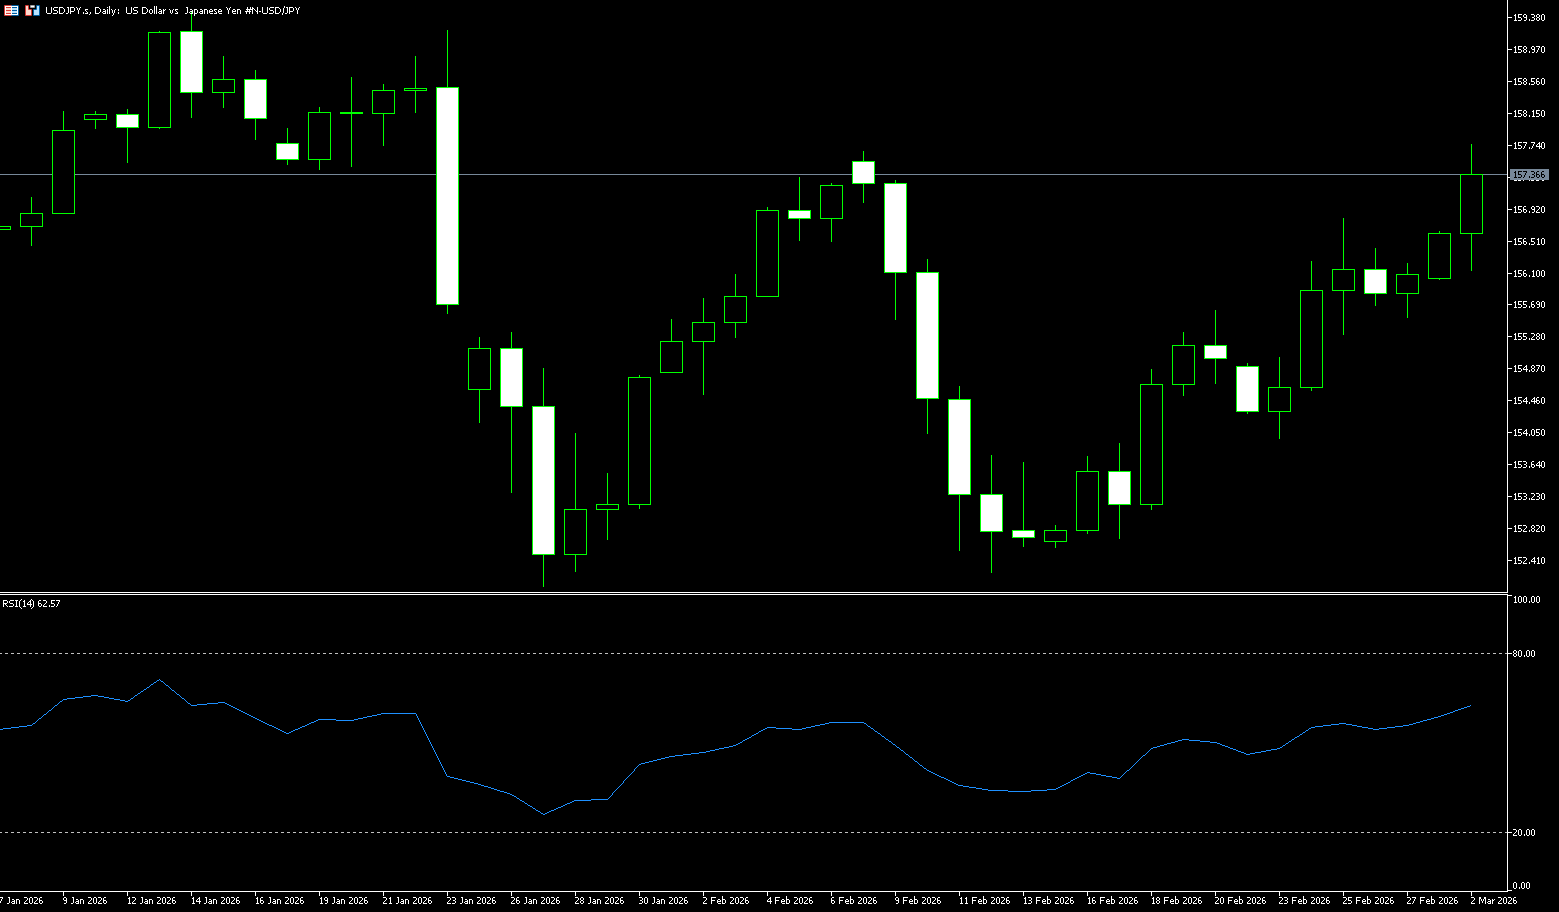
The yen fell to around 157.60 per dollar on Monday, extending last week's decline as the dollar strengthened following the US and Israeli attacks on Iran. These attacks resulted in the death of Iran's Supreme Leader Ayatollah Ali Khamenei and effectively closed the Strait of Hormuz. Tehran's retaliatory actions targeting US assets in the region have increased fears of a larger conflict. The yen also faces pressure from the increasingly uncertain path of the Bank of Japan's monetary policy. Last week, the Japanese government nominated two inflationary scholars to the Bank of Japan's policy board, while Prime Minister Sanae Takaichi expressed concerns about further interest rate hikes during a meeting with Governor Kazuo Ueda. Bank of Japan officials countered these concerns, maintaining the possibility of a near-term rate hike.
The current USD/JPY exchange rate movement is essentially a game between the "USD-Japan interest rate differential advantage" and "expectations of a tightening policy from the Bank of Japan." On the daily chart, USD/JPY remains within a medium- to long-term upward channel, but the upward slope has slowed slightly. The price encountered resistance near a double top around the two-week high of 156.82-156.81, resulting in a technical pullback. Short-term moving averages are beginning to turn downwards, indicating weakening short-term bullish momentum but the overall trend remains intact. The MACD histogram is gradually contracting, indicating a slowdown in the upward momentum. The RSI is in the 55-60 range, indicating a slightly bullish but not overheated state. Key daily support lies in the 155.00-154.50 area, a defensive zone for the bulls; a break below this level could lead to a pullback to around 153.00. Resistance is at 157.25 (Monday's high), a break above which could test 158.00 or even 159.45 (January 14th high). In the short term, the exchange rate is more likely to remain within the 155-158 range, with the trend direction depending on US inflation data and the attitude of Federal Reserve officials.
Consider shorting the US dollar today around 157.50; Stop loss: 157.70; Target: 156.30; 156.10
EUR/USD
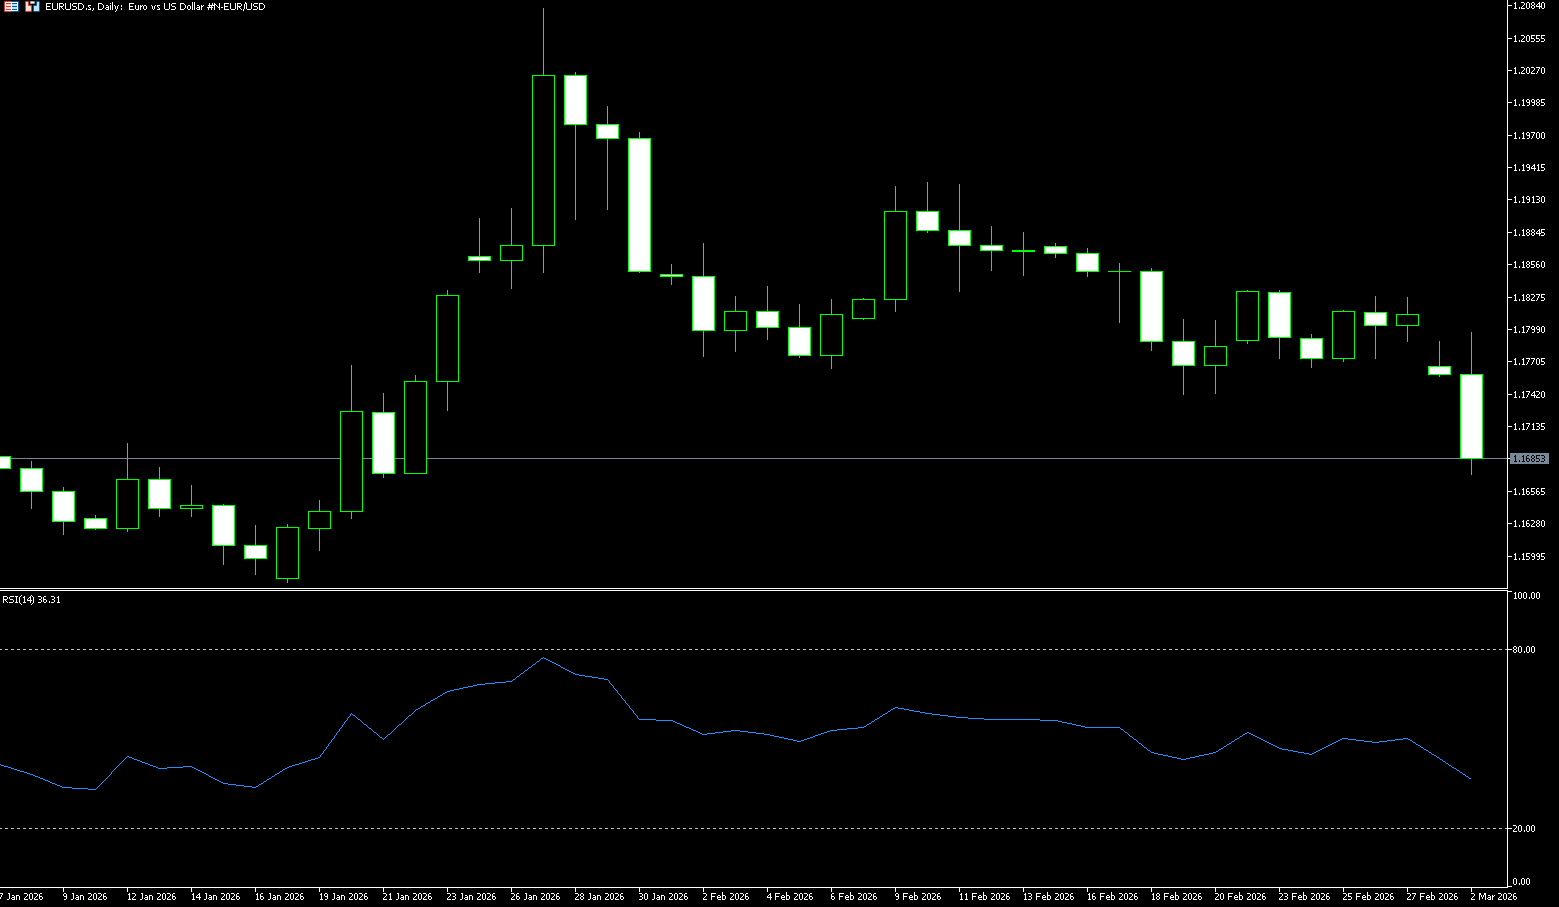
The EUR/USD pair opened with a bearish gap at the start of the new week, as global risk aversion triggered by the Iran war boosted the US dollar. However, spot prices lacked follow-through selling, remaining below the 1.1700 mid-range during the Asian session. Increased anxiety among traders due to escalating conflict in the Middle East strengthened the US dollar against the euro, driving up safe-haven currencies. Iran's Supreme Leader Ayatollah Ali Khamenei was killed following a "massive" and ongoing attack by the US and Israel against the Iranian leadership and military. Airstrikes continue in the Middle East, with Iranian missiles targeting Tel Aviv and Gulf states. Israel also continues its attacks on Iran. Concerns about escalating conflict may provide some support for safe-haven currencies like the US dollar in the short term.
From a technical perspective, EUR/USD appears to have confirmed a break below the lower boundary of its trading range of over a week. This supports the possibility of further short-term depreciation against the backdrop of recent failures to break above the 25-day simple moving average (1.1842), which has now turned from support to resistance. The 14-day Relative Strength Index (RSI) has fallen back to 48, reinforcing downward momentum at the mid-range level. The Moving Average Convergence Divergence (MACD) indicator has flipped towards the zero line, indicating weakening bullish pressure and an increased risk of further weakness. Initial resistance for the pair is at 1.1800 (a psychological level), followed by the 1.1842 (25-day simple moving average) and the 1.1884 (February 13 high) area, which acts as a stronger barrier in any attempt to rally. On the downside, initial support is at 1.1667 (200-day simple moving average), a break below which would expose the 1.1600 (psychological level).
Consider shorting the Euro today near 1.1700; Stop loss: 1.1715; Targets: 1.1650, 1.1640
Disclaimer: The information contained herein (1) is proprietary to BCR and/or its content providers; (2) may not be copied or distributed; (3) is not warranted to be accurate, complete or timely; and, (4) does not constitute advice or a recommendation by BCR or its content providers in respect of the investment in financial instruments. Neither BCR or its content providers are responsible for any damages or losses arising from any use of this information. Past performance is no guarantee of future results.
More Coverage


Risk Disclosure:Derivatives are traded over-the-counter on margin, which means they carry a high level of risk and there is a possibility you could lose all of your investment. These products are not suitable for all investors. Please ensure you fully understand the risks and carefully consider your financial situation and trading experience before trading. Seek independent financial advice if necessary before opening an account with BCR.
BCR Co Pty Ltd (Company No. 1975046) is a company incorporated under the laws of the British Virgin Islands, with its registered office at Trident Chambers, Wickham’s Cay 1, Road Town, Tortola, British Virgin Islands, and is licensed and regulated by the British Virgin Islands Financial Services Commission under License No. SIBA/L/19/1122.
Open Bridge Limited (Company No. 16701394) is a company incorporated under the Companies Act 2006 and registered in England and Wales, with its registered address at Kemp House, 160 City Road, London, City Road, London, England, EC1V 2NX. This entity acts solely as a payment processor and does not provide any trading or investment services.

 English
 简体中文
简体中文
 繁體中文
繁體中文
 Bahasa
Melayu
Bahasa
Melayu
 Tiếng
Việt
Tiếng
Việt
 ไทย
ไทย
 日本語
日本語
 한국어
한국어
 ភាសាខ្មែរ
 español

