


0
US Dollar Index
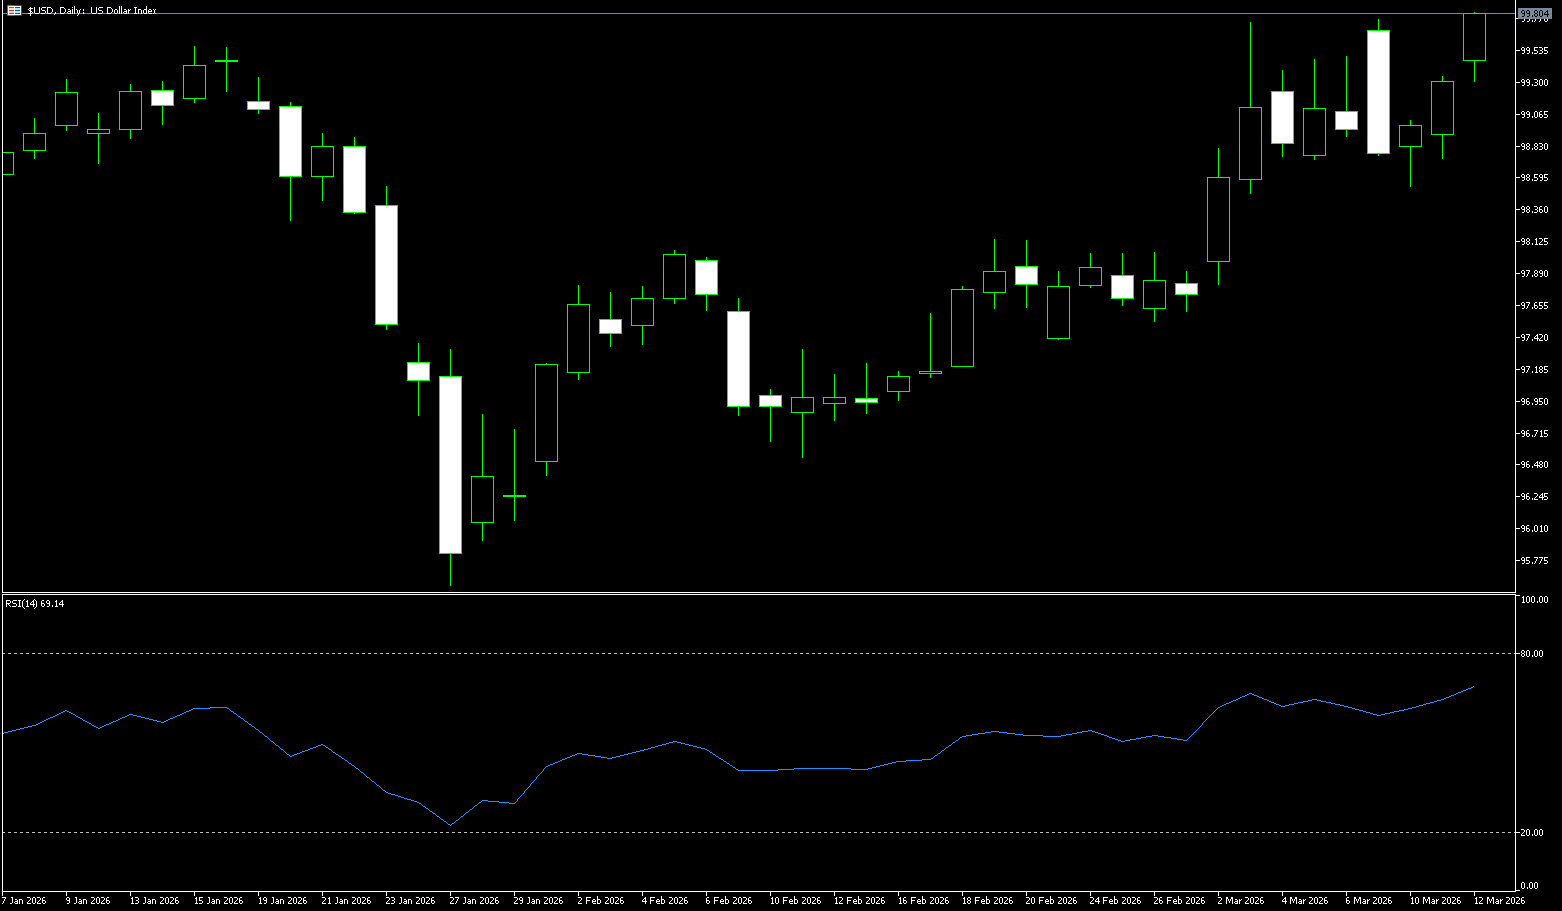
Midweek, global risk aversion reignited, and the US dollar index rebounded from its lows, currently trading around 99.65. It briefly fell to 98.69 during the session. The global oil supply crisis, initially boosted by Trump's remarks, did not last long. The ongoing conflict with Iran and the impasse in the Strait of Hormuz reignited global tensions, causing the US 10-year Treasury yield to plummet, and the dollar to follow suit. The dollar index's failure to break through the key 99.7 level suggests a turning point in global risk sentiment in 2026. The core reason lies in the Federal Reserve's policy shift: the current real interest rate of 0.75% and unemployment rate of 4.4% have shifted the focus to a soft landing rather than aggressive anti-inflation measures, fundamentally limiting the dollar's upside potential. Furthermore, G7 and IEA measures have suppressed safe-haven demand, the "energy doomsday" trade has subsided, and the dollar has lost support for aggressive interest rate hikes in 2022. Unless a renewed conflict triggers prolonged inflation, forcing the market to abandon its expectations of two Fed rate cuts in 2026, the dollar is unlikely to regain its previous strength.
Technically, the dollar index is consolidating above its trading range, with resistance around 96.69, still capped by the neckline of a previous double top. On the daily chart, the dollar index is trading around 99.60. The short-term bias is slightly bullish, as the price remains above the 55-day and 100-day simple moving averages, further solidifying initial support. The Relative Strength Index (RSI) is at 66.35, showing positive momentum without overbought conditions, and the gradually rising Average Directional Index (ADX) has rebounded to the mid-20s, indicating that trend strength is being rebuilt after the previous consolidation phase. Immediate resistance is seen at 99.70 (last week's high); a daily close above this level would open the way to 100.00 (a psychological level). On the downside, initial support is expected at 99.00 (the psychological level), followed by the 98.56 level (the 100-day simple moving average).
Today, consider shorting the US Dollar Index around 99.80; Stop loss: 99.90; Target: 99.40; 99.30
WTI Crude Oil
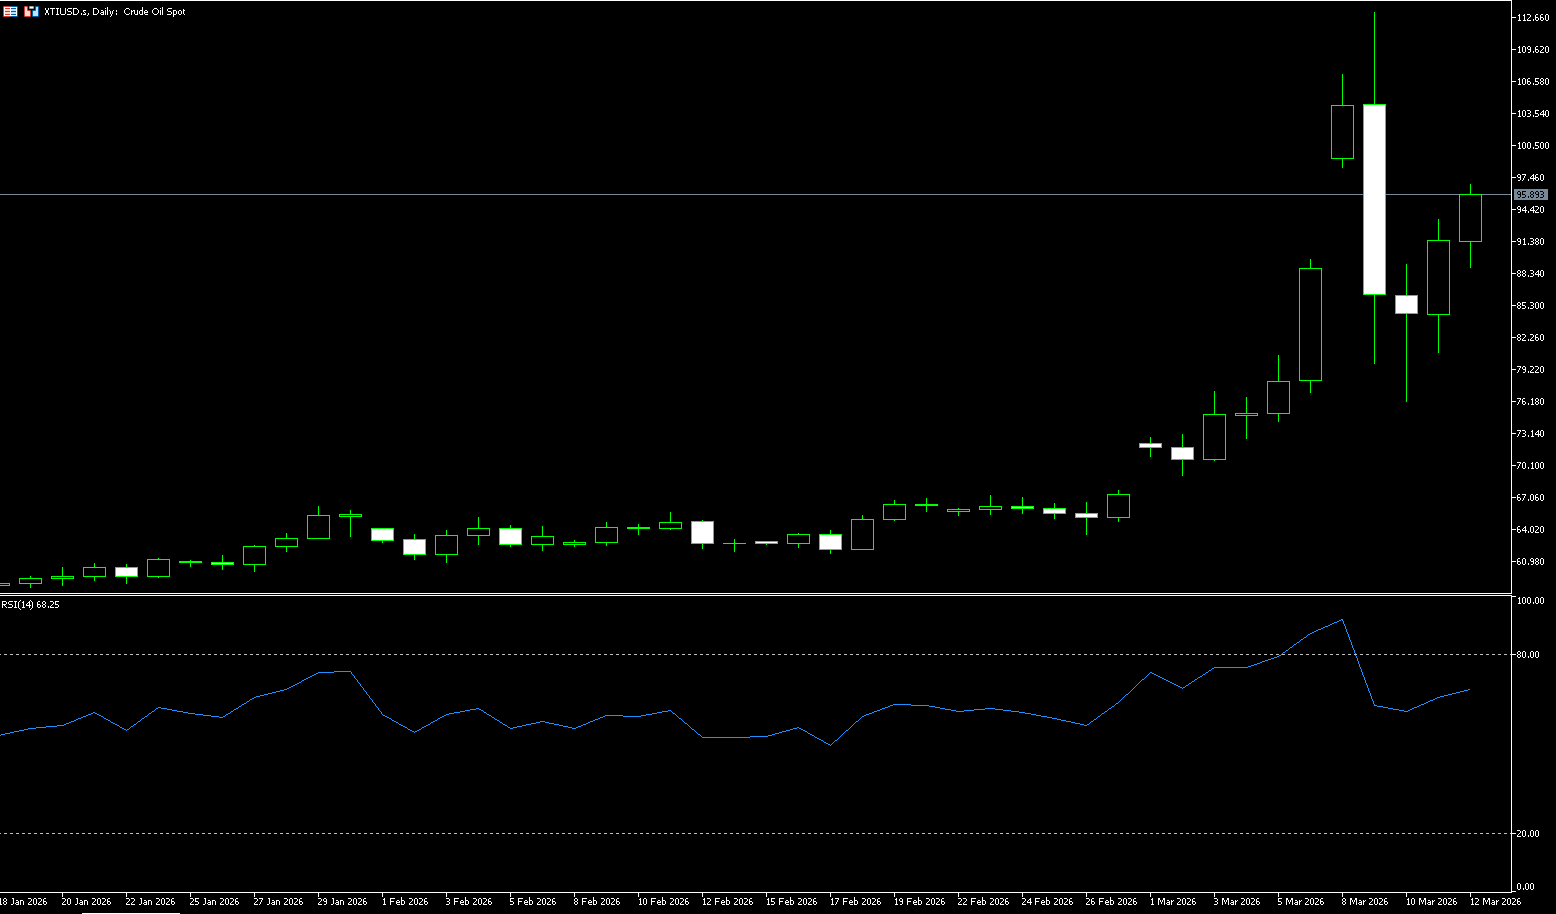
US crude oil traded around $95.00 per barrel on Thursday. US crude oil rose more than 4% on Wednesday, despite the release of oil reserves by various countries. However, Iran's warning to prepare for oil prices of $200 increased uncertainty. Although the International Energy Agency (IEA) proposed a record release of 400 million barrels of oil reserves to curb energy prices, analysts generally believe that this is insufficient to address the supply gap caused by the protracted war in the Middle East, equivalent to only four days of global crude oil production. Meanwhile, a US government report showed a larger-than-expected increase in crude oil inventories, but a larger decrease in fuel inventories, limiting the impact on oil prices. Supply concerns persist. Abu Dhabi National Oil Company shut down the Ruwais refinery due to a drone attack, and Saudi Arabia's increased supply through the Red Sea is still insufficient to fill the oil transport gap in the Strait of Hormuz. Energy consultancies warn that the current conflict is reducing daily supplies in the Gulf region by approximately 15 million barrels, potentially pushing oil prices up to $150 per barrel.
From a technical perspective, WTI crude oil has recently formed a support structure in the $80-$85 range. This area has been tested multiple times in the past few days but has remained stable, indicating a significant increase in buying pressure in this zone. On short-term charts, oil prices have broken through the previous downtrend line, which is generally considered a bullish technical signal. As the market gradually digests news of reserve releases, prices have returned to around $90, making this level a key pivot point for the current market. If oil prices can hold firmly above $90, further upside potential may open up in the short term, with $95 becoming the next target, and $100 being a more significant psychological barrier. On the downside, $80 remains the most important support level for WTI crude oil. This level has been tested multiple times recently but has held, indicating strong market support in this price range. A breach of $80 could lead the market to quickly seek a new equilibrium around the $70 area.
Today, consider going long on crude oil around 95.00; stop loss: 94.60, target: 9700; 9800
Spot Gold
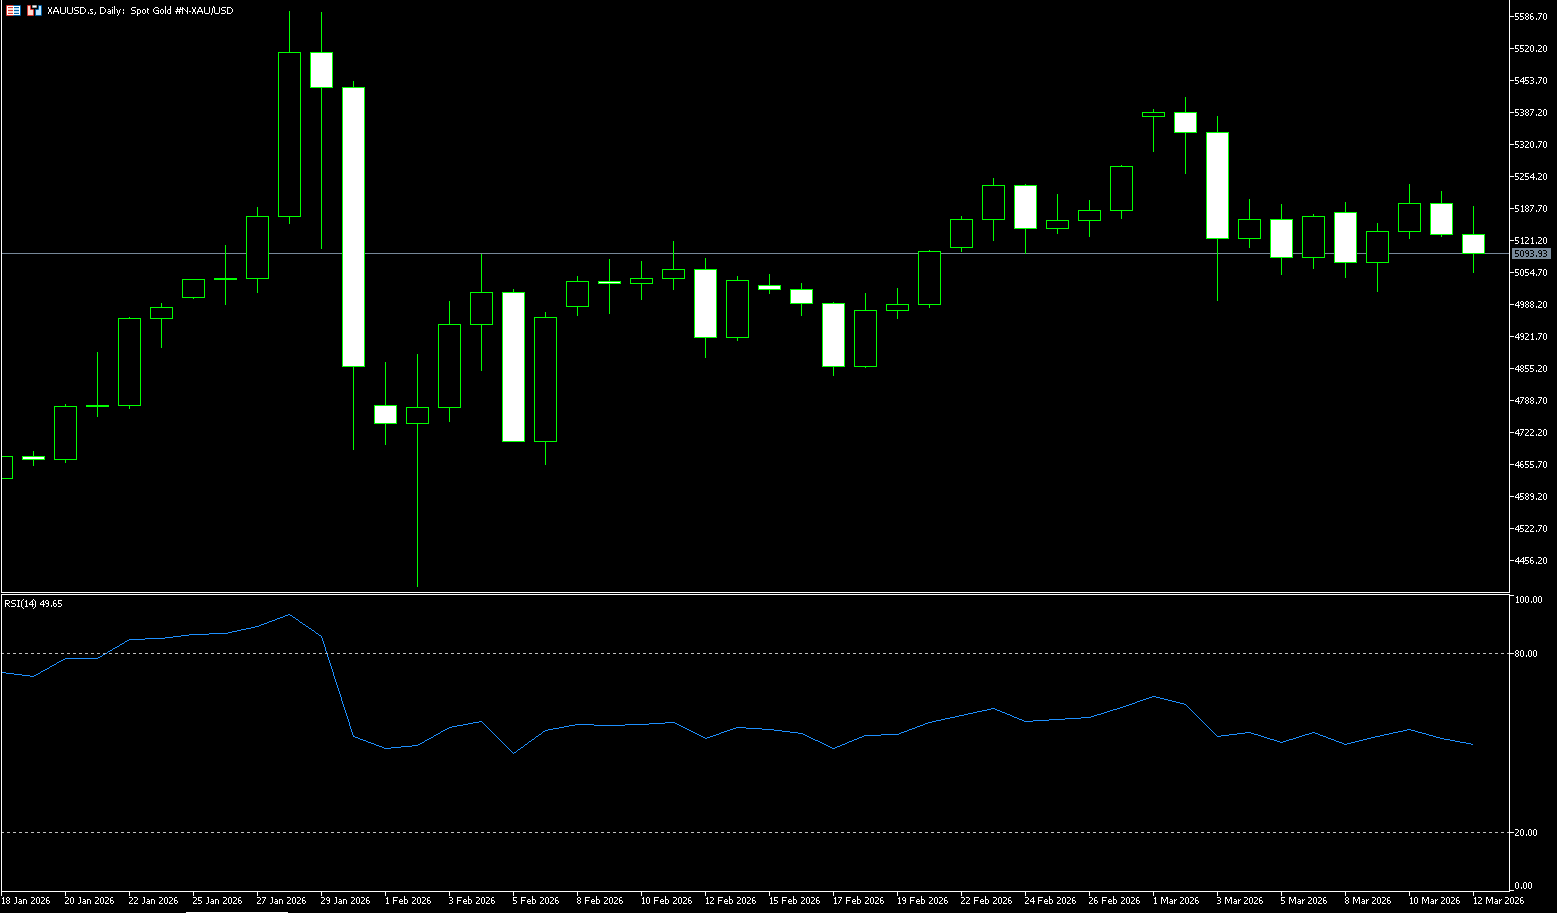
In the early morning of March 12th Beijing time, spot gold traded around $5080 per ounce. Gold prices were pressured by the dual pressures of a stronger dollar and heightened inflation concerns that could push up interest rate expectations. This pressure stemmed from a combination of factors, including asset liquidation demand during periods of market tension, a slowdown in official gold purchases, and the Federal Reserve's expected slowdown in interest rate cuts due to inflation risks triggered by oil prices. Central bank net gold purchases are projected to total approximately 850 tons in 2025, averaging 27 tons per month, but net purchases are expected to plummet to 5 tons in January 2026. This temporary slowdown exacerbates short-term supply pressure. OCBC strategists emphasized that other dragging factors include the possibility that the Federal Reserve may postpone its next interest rate cut, as rising oil prices could increase US inflation risks. Once the safe-haven phase subsides, previous actions will gradually unwind, and gold demand is expected to restart. The decline of the US dollar index to 99 further confirms the improved liquidity environment, while the pullback in oil prices has reduced uncertainty about the Fed's policy path. These changes are laying the foundation for a medium- to long-term stabilization of gold prices.
As previous liquidation pressures subside, the structural demand for gold as a diversified reserve asset will regain attention. Although official gold purchases slowed in January, the full-year forecast still maintains a strong pace of around 800 tons, coupled with lingering geopolitical uncertainties, ensuring a solid foundation for long-term buying. Once risk sentiment fully stabilizes, gold's safe-haven attributes will become more prominent again, and the price center is expected to gradually move upward. The daily chart shows that gold prices have rebounded after falling from a high of $5,598/oz to a low of $5,000/oz, and are currently stabilizing around $5,100/oz. The MACD indicator shows that although the histogram is still negative, the contraction trend is obvious, suggesting that the momentum divergence is easing. The RSI(14) reading is 53.43, which is in the neutral range, neither overbought nor oversold, reflecting that the market is in a balanced state. Strong support is seen at $5,050, with further support around the psychological level of $5,000. Holding above this level would provide momentum for further gains towards the $5,200 (psychological level) and $5,223 (Wednesday's high) resistance levels.
Consider going long on gold today around $5,070; Stop loss: $5.065; Target: $5,150; $5,140
AUD/USD
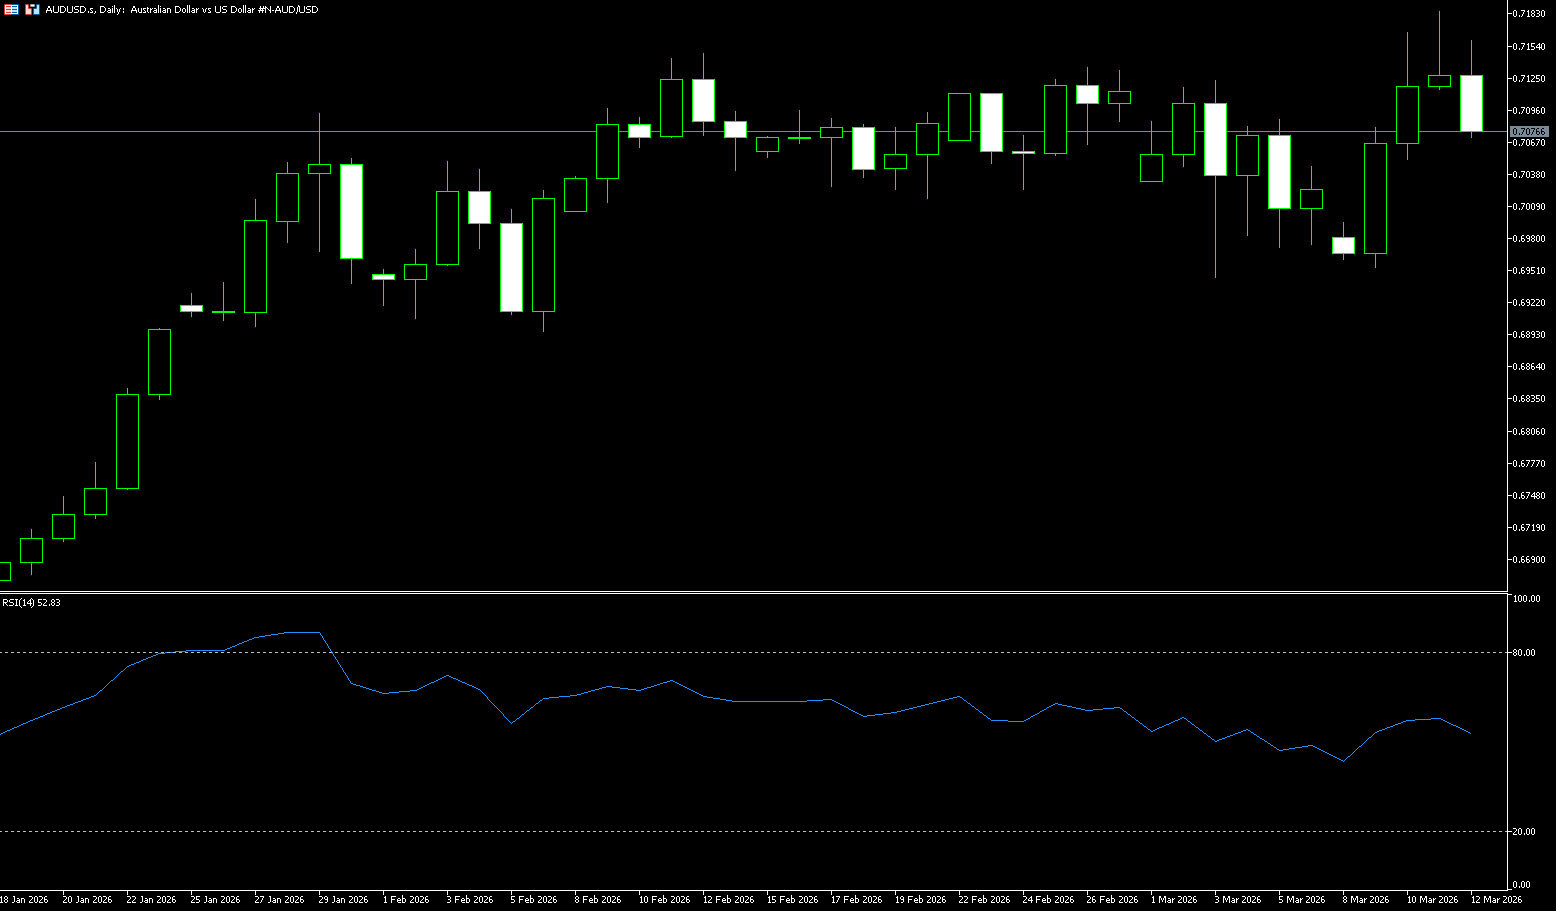
The Australian dollar appreciated to around US$0.7187, reaching its highest level since May 2022, driven by rising expectations of an interest rate hike next week. The Reserve Bank's deputy governor stated that rising oil prices could push inflation higher, increasing pressure to raise rates at the March 17 meeting, which the central bank has described as an "active" rate hike meeting. The market quickly increased the probability of a March rate hike to around 75%, up from below 30% earlier this week, and expects another rate hike to be fully priced in by August. Overall, traders expect a tightening of around 60 basis points this year, potentially pushing the cash rate to its post-pandemic peak when inflation exceeded 7%. Currently, headline inflation is at 3.8%, expected to surpass 4% as petrol prices continue to rise, while core inflation remains high at 3.4%, well above the Reserve Bank of Australia's target range of 2-3%. Elsewhere, markets remain tense due to conflicting reports of conflicting news from the Middle East conflict and increasing uncertainty.
On the daily chart, AUD/USD is trading at 0.7080. The short-term bias is bullish, as the spot price has broken above the 23.6% Fibonacci retracement level of 0.6976, measured from the low of 0.6421 to the high of 0.7147, reinforcing the continuation of the breakout from the previous correction range. The price is firmly above the 55-day, 100-day, and 200-day simple moving averages, all of which are trending upwards, confirming the established uptrend. The Relative Strength Index (RSI) remains above 60, indicating solid positive momentum, while the Average Directional Index (ADX) has retreated from its highs but remains above 25, suggesting the market still has direction rather than being range-bound. Immediate resistance is at 0.7200 (the psychological level), followed by 0.7283 (the 5-day high of 2022), and then the higher barrier of 0.7300. On the downside, initial support is at 0.7070, a break below which would open the door to a pullback. The first support level is at 0.7053, the low of March 10, followed by the psychological level of 0.7000.
Consider going long on the Australian Dollar today around 0.7068; Stop Loss: 0.7058; Target: 0.7120; 0.7130
GBP/USD
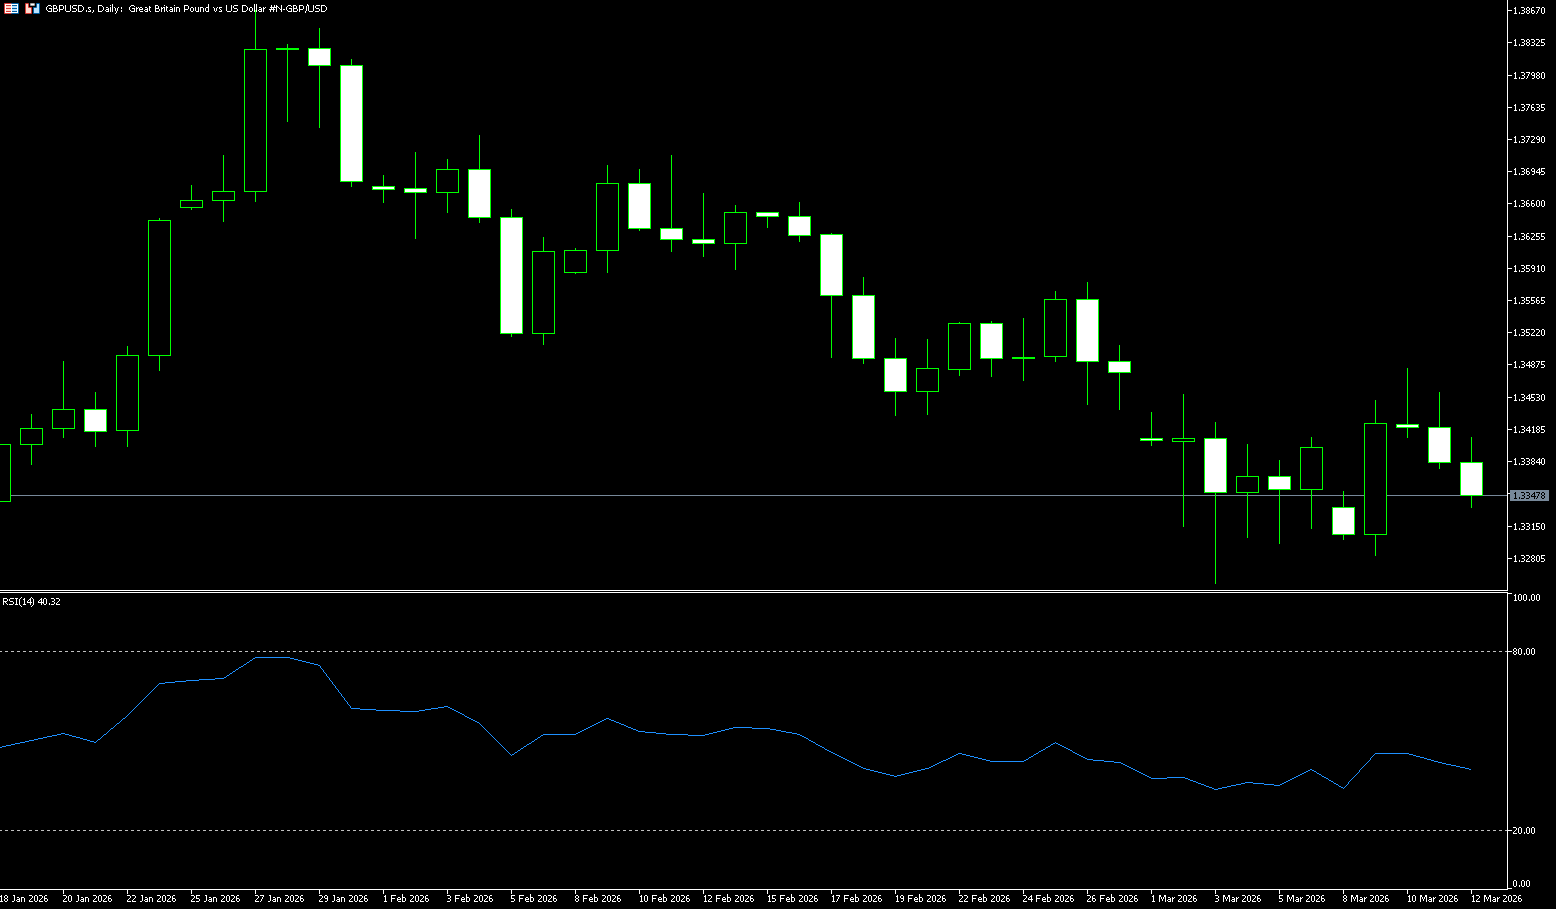
On the daily chart, GBP/USD is trading at 1.3360. The short-term bias is slightly bearish, as the pair remains below the confluence of the downtrend line from 1.3869 and the converging simple moving averages near 1.35, which is now limiting upside. The price has also retreated below the rising support line that previously guided the rally from 1.3035, indicating weakening bullish momentum. Initial resistance is seen near 1.3441, the 200-day simple moving average, followed by the psychological level of 1.3500, which will act as a more significant resistance level should buyers attempt a rally. On the downside, immediate support is at 1.3360, the recent swing low, a break below which would expose 1.3330 and 1.3300. A sustained break below 1.3300 would confirm renewed selling pressure and expose the pair to deeper downside risk in a broader correction phase.
Consider going long on GBP/USD around 1.3340 today; Stop loss: 1.3330, Target: 1.3400; 1.3390
USD/JPY
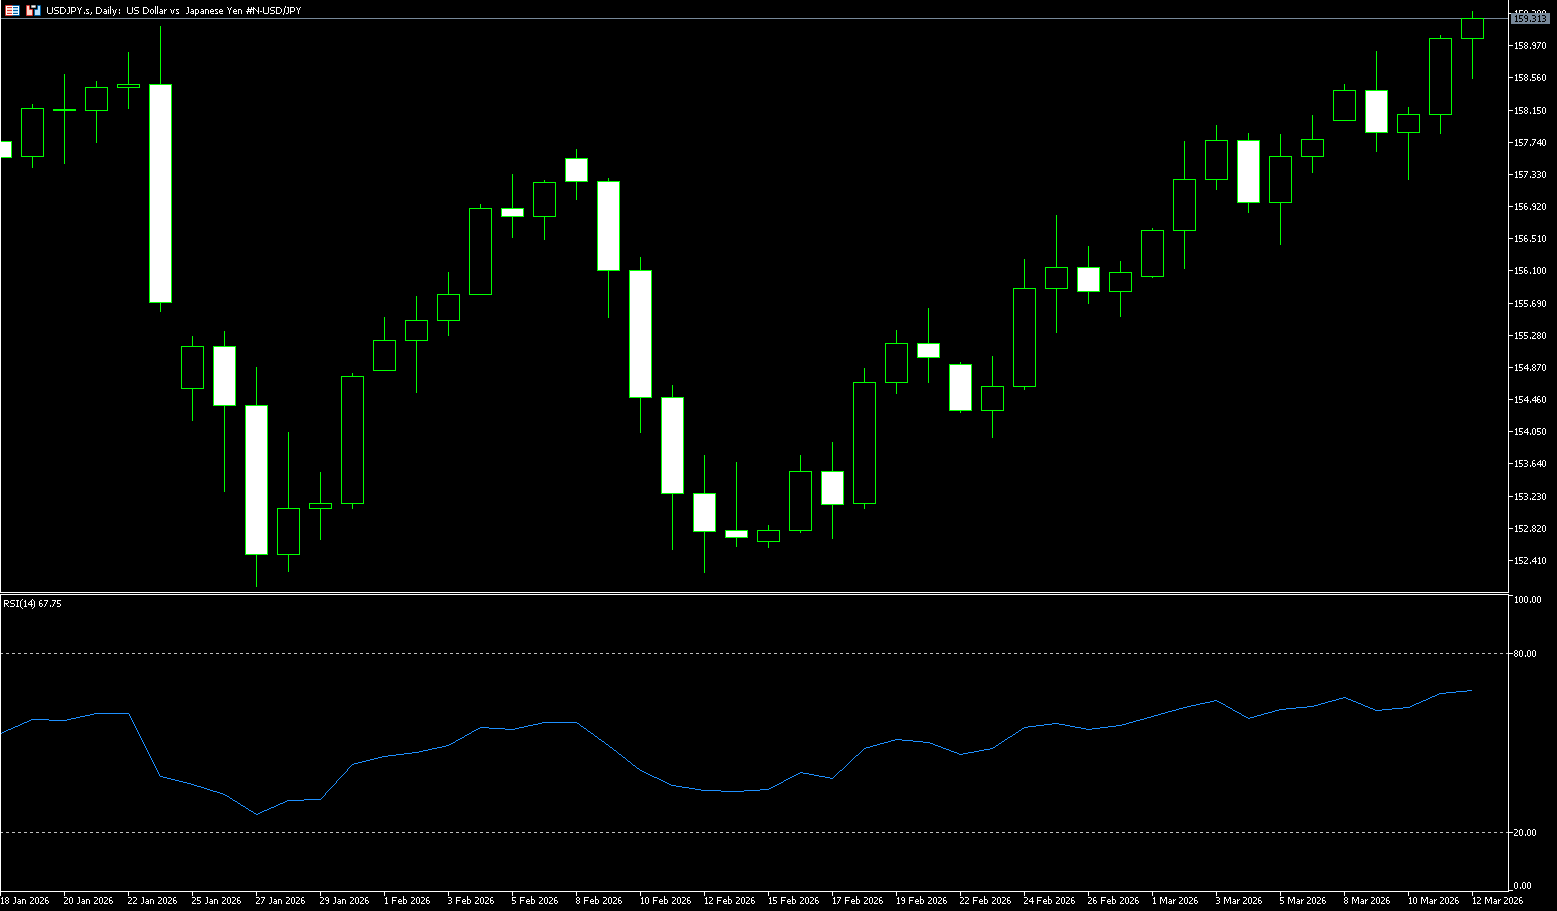
On Thursday morning, USD/JPY reached a high near 159.40. The yen strengthened slightly against the dollar as the Middle East war escalated. Iran launched its “strongest action” since the start of the war. Tehran tightened traffic control over the Strait of Hormuz, a key oil route. The US military rejected requests to escort oil tankers or other civilian vessels through the strait, with defense officials stating they would not do so until the Iranian threat subsided. Meanwhile, the Israel Defense Forces announced a “widespread wave of strikes” against Hezbollah infrastructure. Traders will be closely watching developments in the Iranian conflict. Any signs of escalating tensions between Iran and its neighbors, the US, and Israel could push safe-haven currencies like the yen higher, putting pressure on the pair in the short term.
The USD/JPY pair maintained a bullish short-term bias after breaking above the one-week trading range resistance at 158.00, reaching a high of 159.40. Furthermore, the MACD histogram has slightly turned positive, while the MACD line is near the signal line above zero, suggesting improved but still moderate upward momentum. Additionally, the Relative Strength Index (RSI) is around 65.53, still below overbought territory, indicating that buyers remain in control and have not yet shown signs of fatigue. Immediate support appears at the breakout point of the trading range resistance at 158.00, with deeper support at 157.30, protecting the recent high-low area. A break below 157.30 would weaken the bullish bias and make the 156.80 area the next downside focus. On the upside, initial resistance appears at 159.45 (January 14th), followed by 160.00 (a psychological level).
Consider shorting the US dollar around 159.50 today; Stop loss: 159.70; Target: 158.60; 158.70
EUR/USD
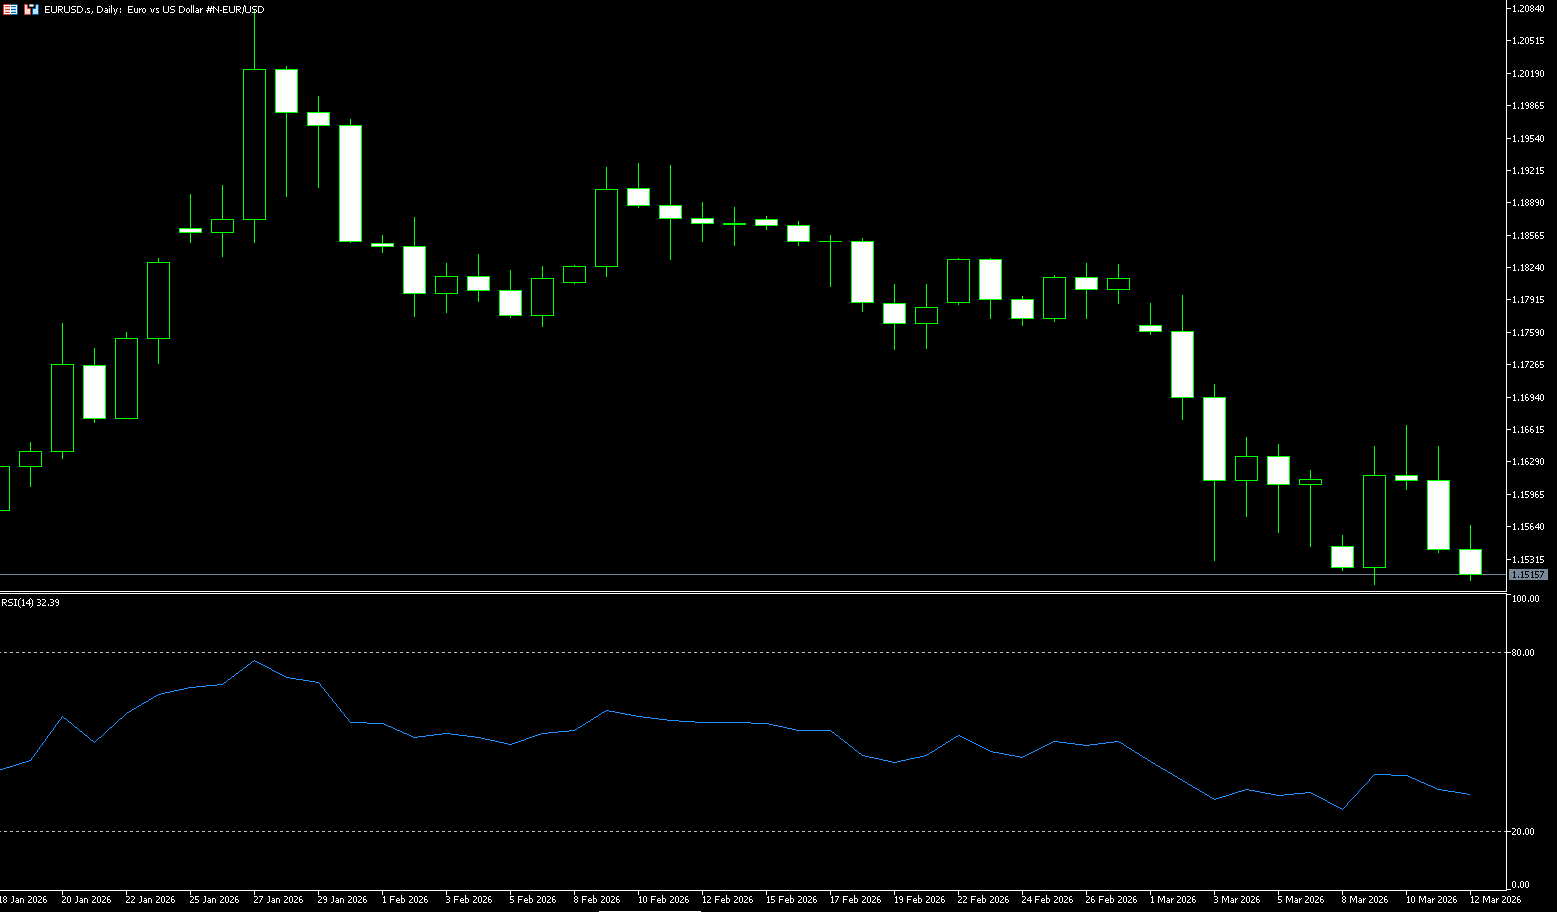
The euro fell below $1.1600, hitting its lowest level since the end of November last year, as uncertainty surrounding the Middle East conflict and concerns about rising inflation in the eurozone pressured the currency. The International Energy Agency proposed a record release of strategic oil reserves to help alleviate the sharp rise in energy costs caused by the conflict in Iran, keeping oil prices below $90 per barrel. On monetary policy front, market expectations have shifted towards a more hawkish stance from the European Central Bank. The market increasingly anticipates at least one 25 basis point rate hike this year, with some traders now considering the possibility of two hikes. On Tuesday, Christine Lagarde reiterated that despite the current surge in energy prices, the ECB remains committed to taking all necessary measures to control inflation.
The euro/dollar fell for the second consecutive day after hitting its 200-day simple moving average of 1.1676 due to overall dollar strength. After reaching a high of around 1.2082 on January 27, the EUR/USD pair consolidated sideways before retreating to the 1.1700 area. Since then, the pair has formed a series of lower highs and lower lows, reaching a low of 1.1507 before rebounding to the current level. As of this writing, EUR/USD is trading below the 200-day simple moving average at 1.1672, at 1.1547, indicating a long-term bearish trend. For the bearish continuation to materialize, EUR/USD must break above 1.1500. If this level is breached, the next area to watch is the daily low of 1.1468 from November 5, 2025. Conversely, bulls must retake 1.1600 before challenging the 200-day simple moving average at 1.1672. Once both levels are broken, the next support level will be at 1.1700.
Consider going long on the Euro today around 1.1500; Stop loss: 1.1490; Target: 1.1550, 1.1560
Disclaimer: The information contained herein (1) is proprietary to BCR and/or its content providers; (2) may not be copied or distributed; (3) is not warranted to be accurate, complete or timely; and, (4) does not constitute advice or a recommendation by BCR or its content providers in respect of the investment in financial instruments. Neither BCR or its content providers are responsible for any damages or losses arising from any use of this information. Past performance is no guarantee of future results.
More Coverage


Risk Disclosure:Derivatives are traded over-the-counter on margin, which means they carry a high level of risk and there is a possibility you could lose all of your investment. These products are not suitable for all investors. Please ensure you fully understand the risks and carefully consider your financial situation and trading experience before trading. Seek independent financial advice if necessary before opening an account with BCR.
BCR Co Pty Ltd (Company No. 1975046) is a company incorporated under the laws of the British Virgin Islands, with its registered office at Trident Chambers, Wickham’s Cay 1, Road Town, Tortola, British Virgin Islands, and is licensed and regulated by the British Virgin Islands Financial Services Commission under License No. SIBA/L/19/1122.
Open Bridge Limited (Company No. 16701394) is a company incorporated under the Companies Act 2006 and registered in England and Wales, with its registered address at Kemp House, 160 City Road, London, City Road, London, England, EC1V 2NX. This entity acts solely as a payment processor and does not provide any trading or investment services.

 English
 简体中文
简体中文
 繁體中文
繁體中文
 Bahasa
Melayu
Bahasa
Melayu
 Tiếng
Việt
Tiếng
Việt
 ไทย
ไทย
 日本語
日本語
 한국어
한국어
 ភាសាខ្មែរ
 español