


0
Currency & Commodity Analysis:
US Dollar Index
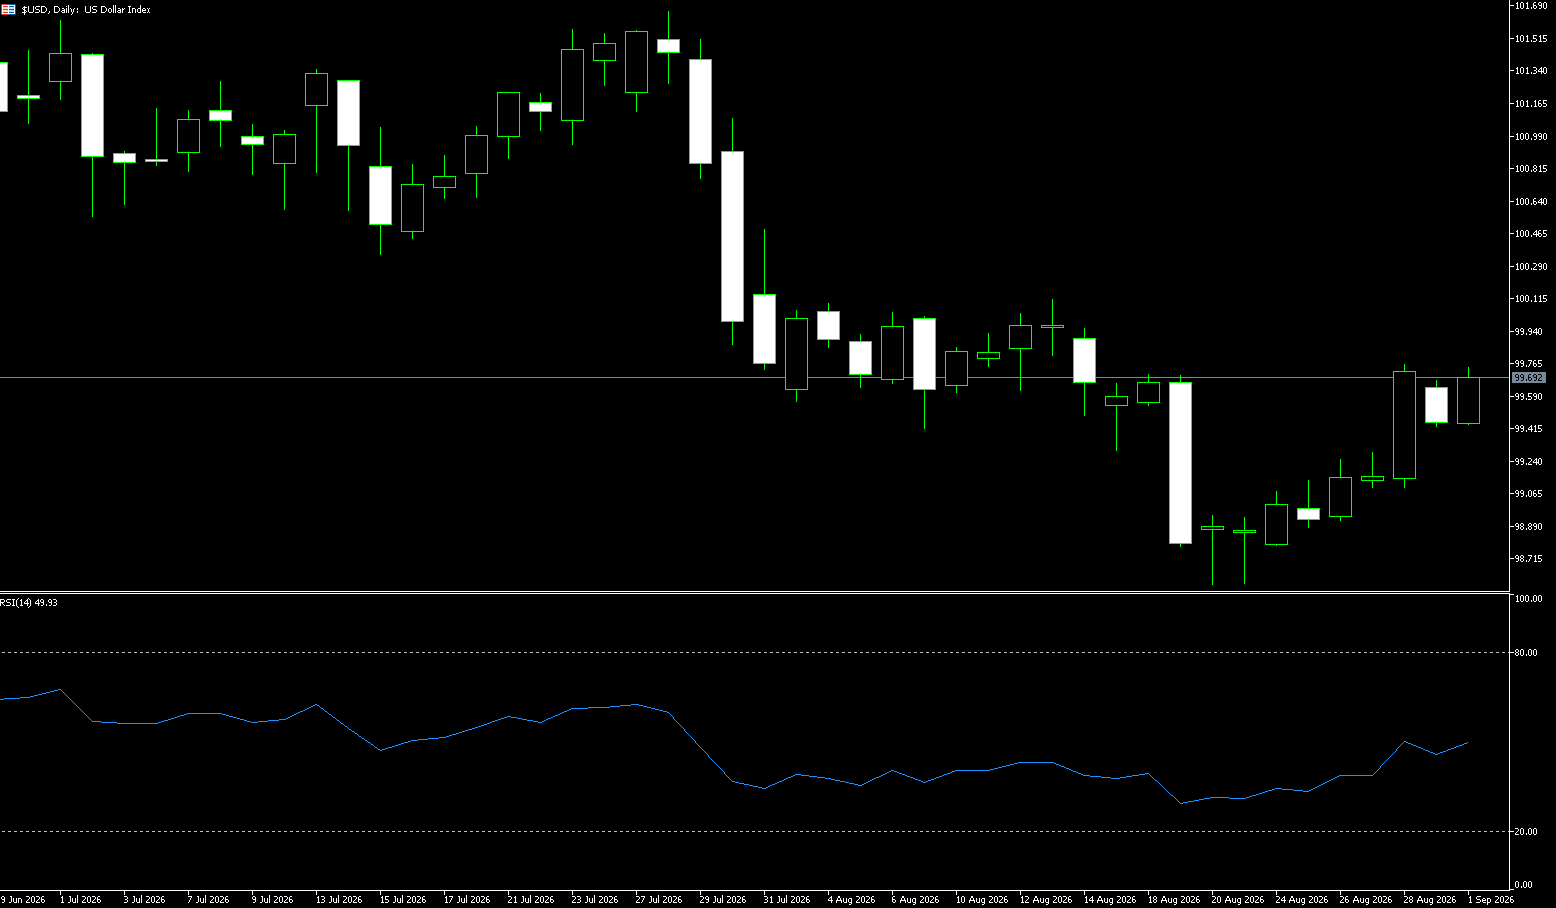
The US dollar index rose above 99.65, extending its rebound from the three-month low of 98.8 on August 21st and tracking the surge in the yield curve, with inflation risks consistent with a more hawkish Fed outlook. Renewed attacks between the US and Iran further dimmed the slight prospect of short-term improvement in energy flows in the Strait of Hormuz. Rising energy prices have exacerbated inflationary pressures after a number of FOMC members, including Chairman Warsh, warned that inflation might necessitate interest rate hikes. The Chairman also noted that the labor market is currently at full employment, consistent with the annual revision of nonfarm payrolls, which is significantly lower than the recent downward revision. Meanwhile, evidence of higher inflation in the Eurozone has increased the consensus on ECB rate hikes, limiting the DXY rebound.
The past few months have highlighted a familiar problem: it's one thing to bring inflation down from its peak, but it's much more difficult to pull it back to the target level. The final stages of the inflation pullback in the coming months could be a significant source of support for the dollar, especially if markets are overly optimistic about the speed at which residual price pressures will subside. Underlying inflation remains stubborn, and market expectations that interest rates will need to remain high for a longer period should continue to support the dollar. At the same time, fiscal concerns are unlikely to disappear quietly, adding another layer of uncertainty to an already turbulent second half of the year. The upside resistance areas to watch are the horizontal resistance levels around 99.72 (the 100-day simple moving average) and 99.70 (last week's high), followed by the psychological level of 100. Given the already strong intraday momentum, a pause or pullback is not unexpected. On the downside, the resistance is around 99.16 (the 9-day simple moving average), followed by the psychological level of 99.
Looking at the charts, the US dollar index quickly recovered lost ground and refreshed its intraday high after Fed Chairman Warsh's speech, indicating an immediate reassessment of the policy statement by the market. On the daily chart, the US dollar index is currently trading at 99.65. The index maintains a bullish pattern, standing above the 9-day (99.11) and 20-day (99.48) simple moving averages, which are trending upwards and provide support for a broader uptrend. The latest rally held above the uptrend line, keeping the short-term tone positive. Meanwhile, the Relative Strength Index (RSI) is around 49, which may slow the upward momentum rather than directly reverse the trend. On the upside, initial resistance is at the horizontal level near 99.71 (the 100-day simple moving average), followed by the psychological level of 100. Given the already stretched intraday momentum, a pause or pullback would not be unexpected. On the downside, support is near 99.11 (the 9-day simple moving average), followed by stronger support at the psychological level of 99.
Consider shorting the US Dollar Index at 99.80 today, with a stop-loss at 99.90 and targets at 99.30 and 99.40.
WTI Crude Oil
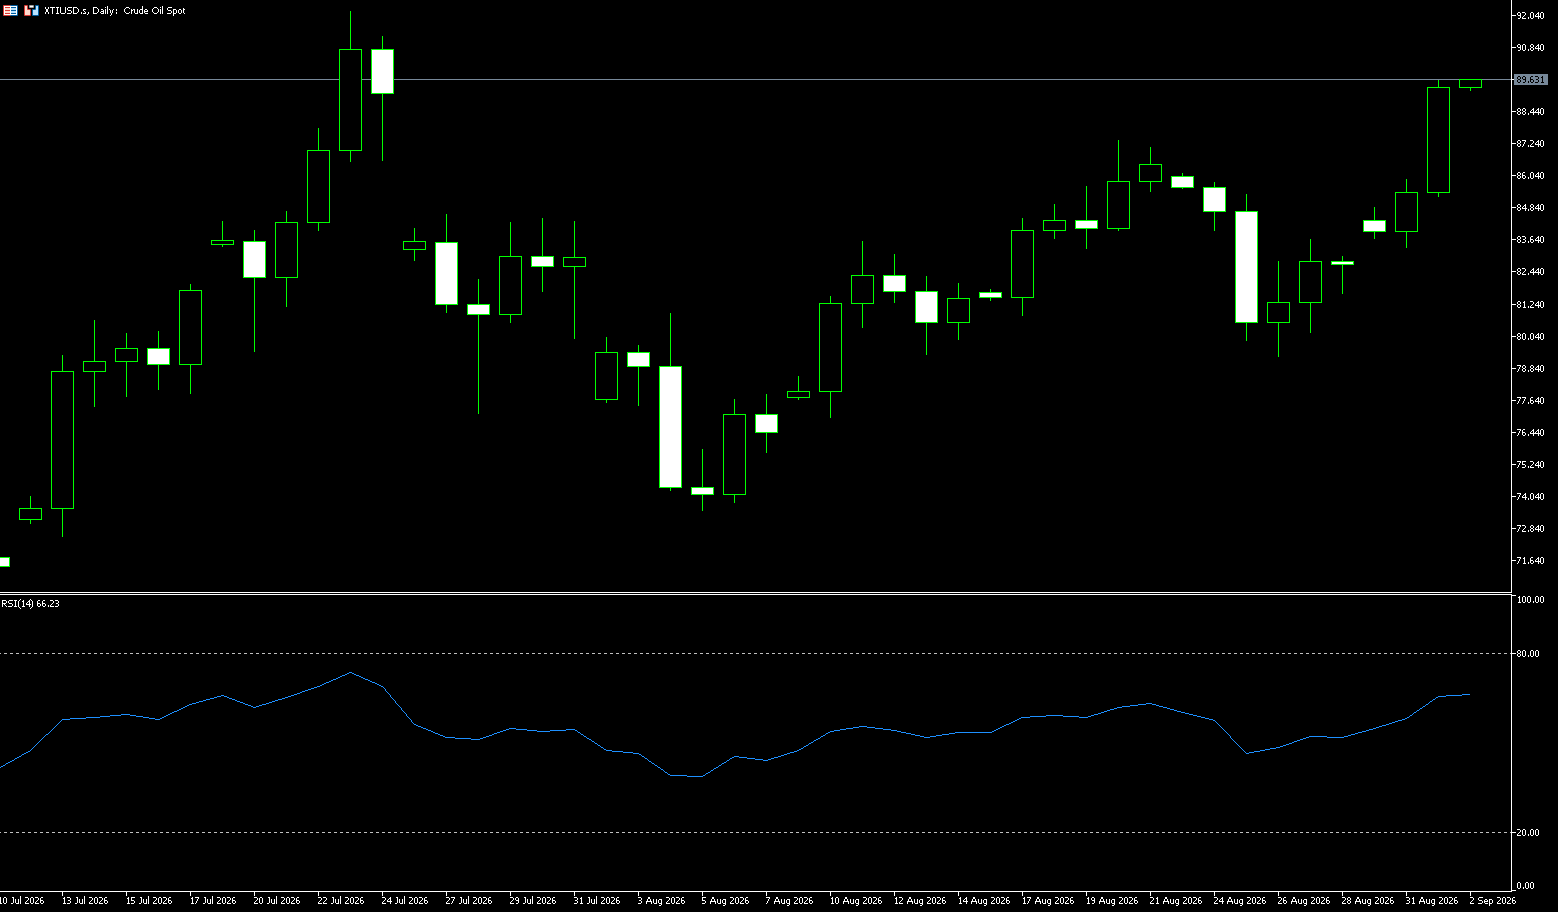
Crude oil prices rose more than 4% on Tuesday, nearing $89.50 a barrel, the highest level since the end of July, driven by a new round of US military strikes against Iranian targets in the Strait of Hormuz after two oil tankers in the region were attacked. US President Donald Trump also threatened a much larger response if Tehran retaliated. A senior Iranian military source said Tehran's response would be "far greater," and warned that bases in the region could be swiftly attacked by Iran. This escalation threatens to prolong the conflict and further disrupt oil exports from the region. Meanwhile, Ukraine launched a major drone attack on Russia's Ust-Lu refueling terminal in the Baltic Sea, causing a fire, and continues to target Russian refineries and energy infrastructure.
The overall outlook remains one of wide-ranging fluctuations in oil prices. While rising oil prices are vulnerable to potential negative news from the US, falling prices are influenced by positive news from Iran. However, due to domestic inflationary pressures and debt burdens in the US, coupled with some oil tankers secretly transiting the Strait of Hormuz, overall oil prices remain manageable. From a technical perspective, WTI oil prices are currently encountering resistance at the triangle pattern and have pulled back. Support is around $81.45, and resistance is around $88.50. Looking at the daily chart, the current WTI crude oil price is around $85 per barrel. In the MACD indicator, the DIFF is 0.95, the DEA is 1.17, and the histogram is -0.44. Both lines are still above the zero line, but the fast line is lower than the slow line, indicating that the momentum from the previous period has weakened. On the upside, consider the psychological resistance at $90.00 and the $92.00 level. On the downside, watch the 9-day moving average at $83.98; a break below this level would target the 20-day moving average at $82.19.
Today, consider going long on crude oil at 89.20, with a stop-loss at 89.00 and targets at 90.50 and 92.00.
Spot Gold
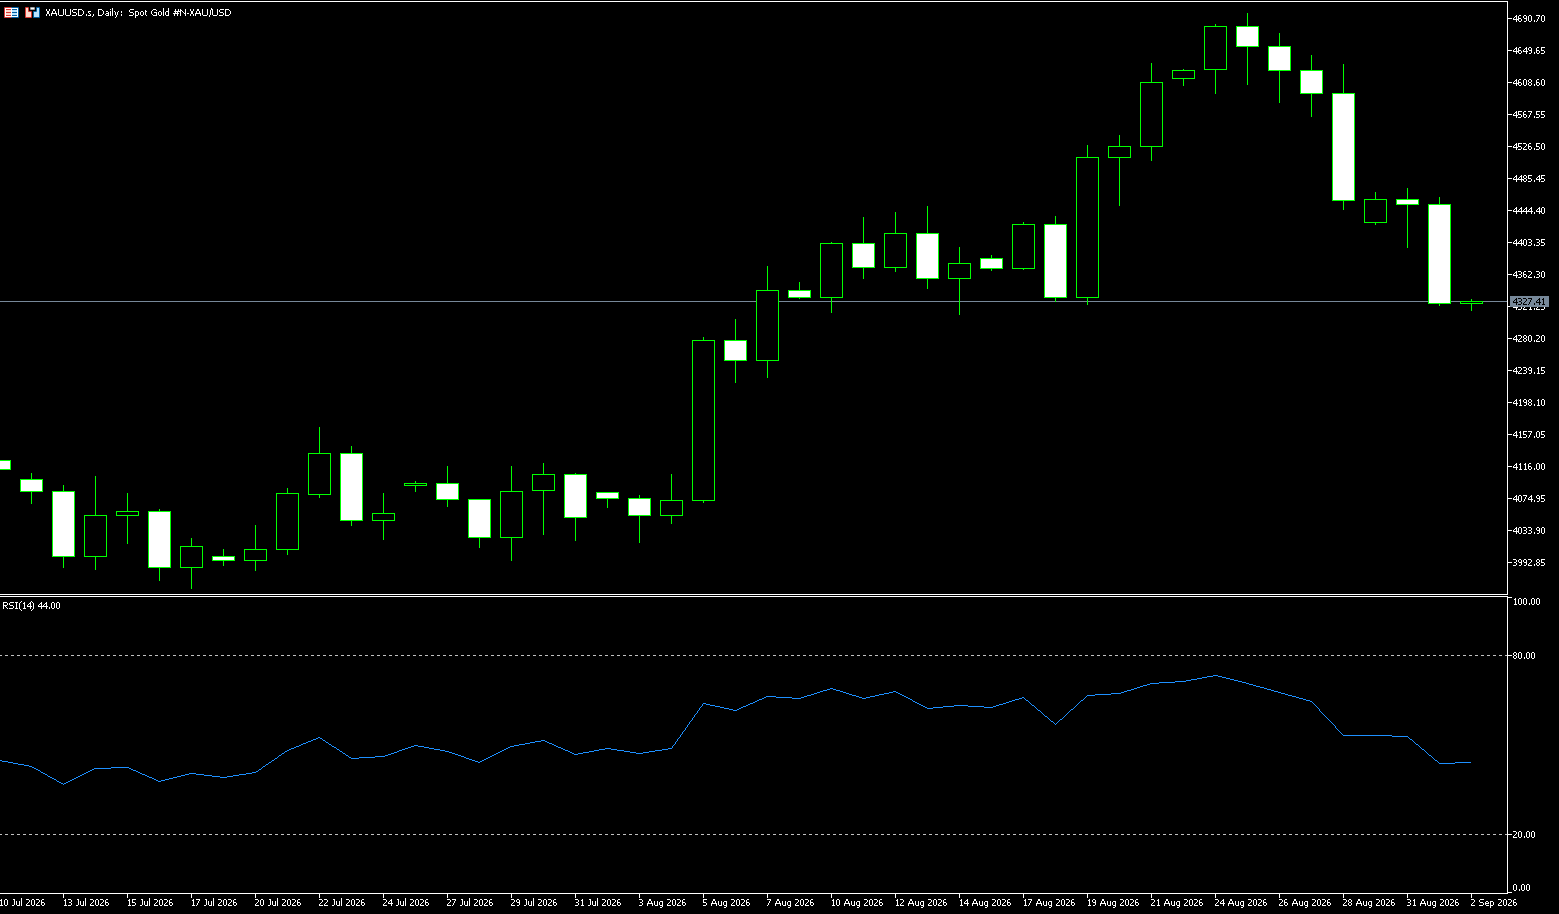
On Tuesday, gold prices fell more than 2.5% to around $4,325 per ounce, the lowest level since August 19, as rising U.S. Treasury yields put pressure on the non-yielding asset. Investors are also awaiting key U.S. labor market data for new clues about the outlook for Federal Reserve monetary policy. U.S. Treasury yields climbed to their highest level since January 2025 due to inflation concerns fueled by escalating tensions in the Middle East, strengthening expectations for a near-term Fed rate hike. Last week, Fed Chairman Kevin Warsh stated at the Jackson Hole symposium that central banks will “need to do work” if policymakers are not confident that inflation will return to the 2% target. According to the CME FedWatch tool, the market currently expects a 66% probability of a rate hike later this month. Attention now shifts to Wednesday's ADP employment report and Friday's non-farm payroll data for further clues about the Fed's policy path.
Looking ahead, interest rate hike expectations, a strong dollar, and a short-term surge in oil prices are key factors suppressing gold prices. However, a global economic slowdown, resulting in weaker employment in the US, and the US Treasury's determination to lower Treasury yields and sell bonds to support the market due to its massive debt, provide a solid foundation for gold's upward movement. Technically, spot gold has quickly corrected to the bottom of its trading range, using space to buy time. Currently, bulls still have the upper hand, with resistance at $4,500 and support at the bottom of the range. On the daily chart, gold prices still have a short-term bullish bias as they extend above the psychological level of $4,300. Momentum remains constructive, with the Relative Strength Index (RSI) at 47 and the Moving Average Convergence Divergence (MACD) histogram remaining above zero, suggesting that despite signs of easing upward momentum, buyers remain in control. At the top, initial resistance is the 25-day moving average at $4,369; then the psychological level of $4,400. On the downside are the psychological level of $4,300 and the immediate support at the 34-day moving average of $4.283.
Consider going long on gold today at $4,324, with a stop-loss at $4,320 and targets at $4,368 and $4,380.
AUD/USD
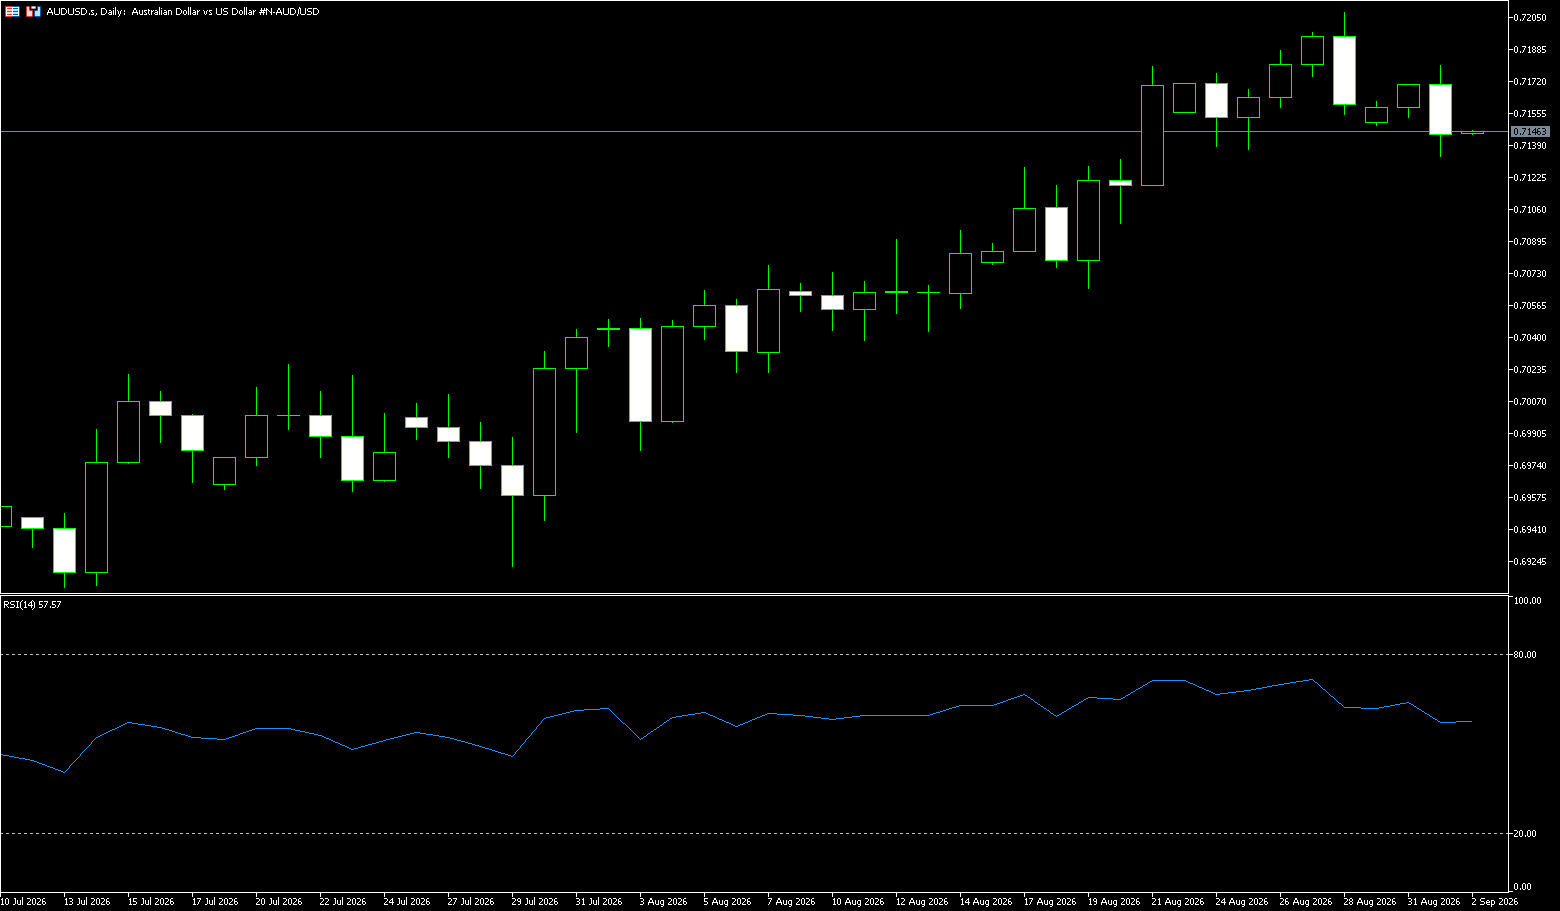
The Australian dollar edged lower against the US dollar during Tuesday's European trading session, trading around 0.7150. The Australian dollar edged lower against the US dollar as renewed Middle East conflict pushed up oil prices, causing US Treasury yields to surge and the dollar to strengthen. The US dollar index, which measures the dollar against six major currencies, rose slightly to near 99.50. The 10-year US Treasury yield hit a 19-month high of 4.78%, approaching a multi-year high of 4.81%. In Australia, investors awaited second-quarter GDP data due on Wednesday. Australian GDP growth is expected to slow to 1.8% year-on-year in the second quarter, citing continued weakness in the housing sector – including falling house prices – and weaker residential investment. They noted that after a surprise rise in inflation in July, the market had increased its pricing in another rate hike by the Reserve Bank of Australia (RBA), making the upcoming data "closely watched." However, despite shifting market expectations, the market still leans towards the RBA maintaining its current rate.
From a technical perspective, the Australian dollar/US dollar pair remains above its 20-day simple moving average of 0.7106, indicating a slightly bullish short-term bias. However, momentum is weak, with the 14-day Relative Strength Index (RSI) hovering around 62 and the Moving Average Convergence Divergence (MACD) indicator slipping slightly into negative territory. This, in turn, suggests that upward pressure is slowing rather than accelerating. On the downside, initial support lies at the current 20-day simple moving average at 0.7106, and the 0.7100 (psychological level) area, which should act as an immediate pivot. Following this is stronger structural support near 0.7077, at the 100-day simple moving average. As long as AUD/USD remains above this moving average, pullbacks could attract buyers. On the other hand, bulls will need to wait for sustained strength and a break above 0.7200 before setting up a move towards 0.7264 (the May 14 high), followed by the nearby upper limit of 0.7300 (a psychological resistance level).
Consider going long on the Australian dollar at 0.7135 today, with a stop loss at 0.7125 and targets at 0.7190 and 0.7180.
GBP/USD
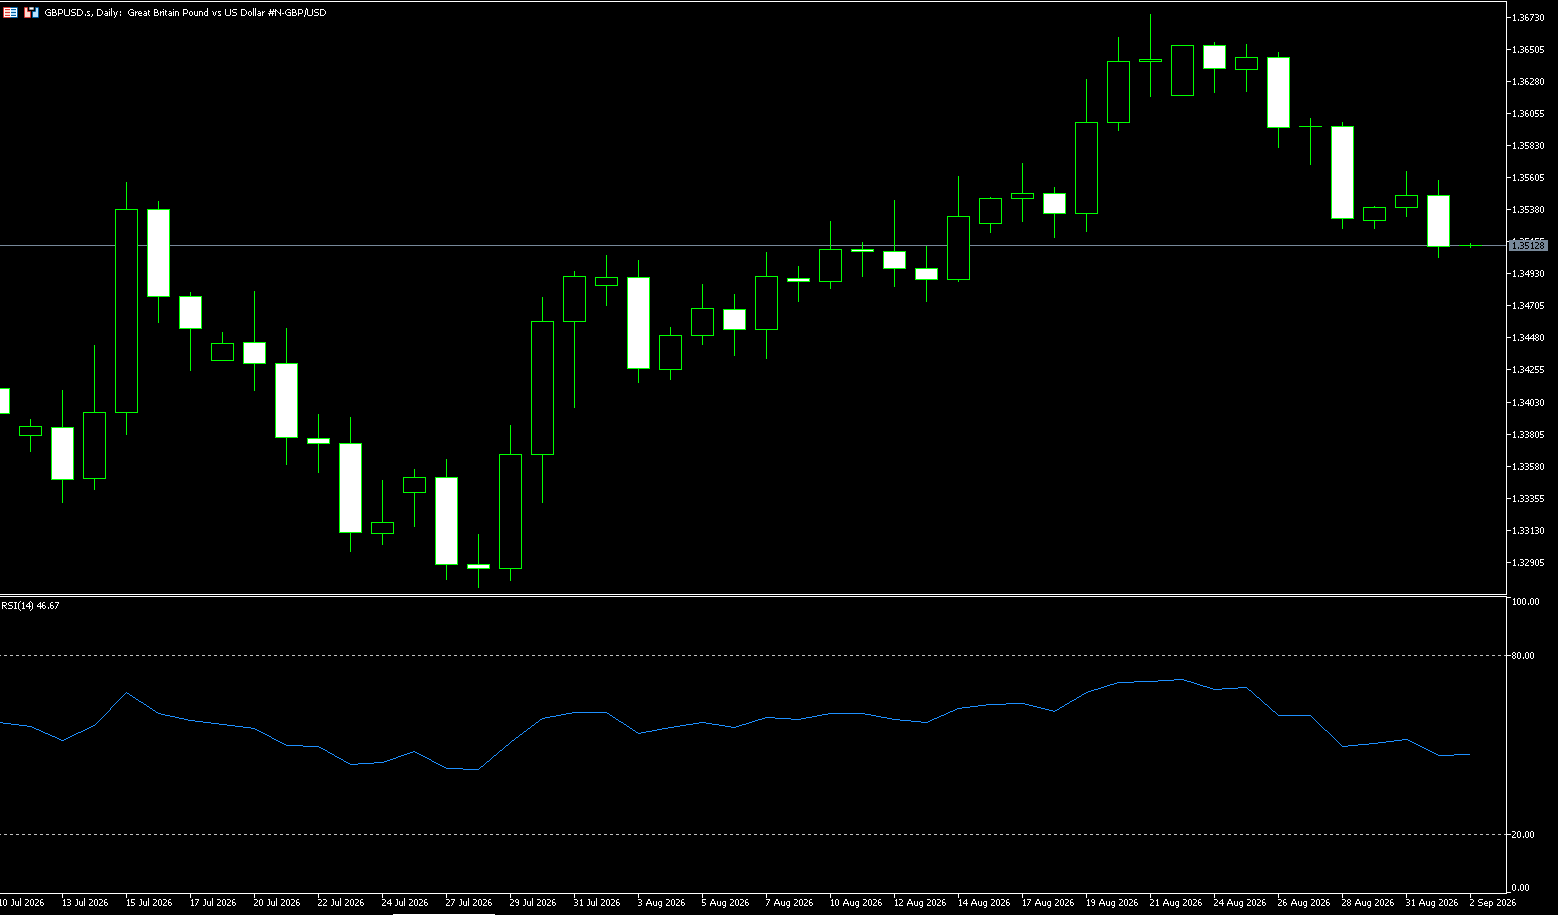
The GBP/USD pair edged lower around 1.3525 in early Asian trading on Tuesday. The dollar rose slightly against the pound due to ongoing tensions in the Middle East and hawkish comments from Federal Reserve Chairman Kevin Warsh at the Jackson Hole symposium. US President Trump threatened on Monday to launch a strong strike against Iran after the first exchange of fire between the US and Iran in a month. Meanwhile, Iran's Revolutionary Guard Corps (IRGC) said it was targeting US military bases in both Middle Eastern countries in response to the first US attack on Iran in weeks. Later on Monday, the UK Maritime Trade Operations Authority (UKMTO) reported that an oil tanker was hit by three projectiles while exiting the Strait of Hormuz, according to Reuters. Escalating tensions in the Middle East could drive safe-haven inflows, supporting the dollar and putting pressure on this major currency pair. On Friday, market focus will turn to August employment data. If the results are weaker than expected, it could drag the dollar down in the short term.
On the daily chart, GBP/USD is trading at 1.3525. The pair maintains a mildly bullish bias, with the price above the 34-day and 25-day simple moving averages at 1.3515 (1.3486), indicating potential buying demand on pullbacks. However, the spot price is approaching the 25-day simple moving average at 1.3528, which constitutes nearby resistance, while the Relative Strength Index (RSI) at 52.94 suggests that upward momentum is solid but not overextended. On the upside, initial resistance lies at the key psychological resistance level near 1.3600, followed by the Bollinger Bands near 1.3668. On the downside, support first appears at the 34-day simple moving average at 1.3486, followed by the lower Bollinger Band at 1.3433; buyers are expected to re-enter at this level should a corrective pullback occur.
Today, consider going long on GBP at 1.3510, with a stop-loss at 1.3500 and targets at 1.3550 and 1.3560.
USD/JPY
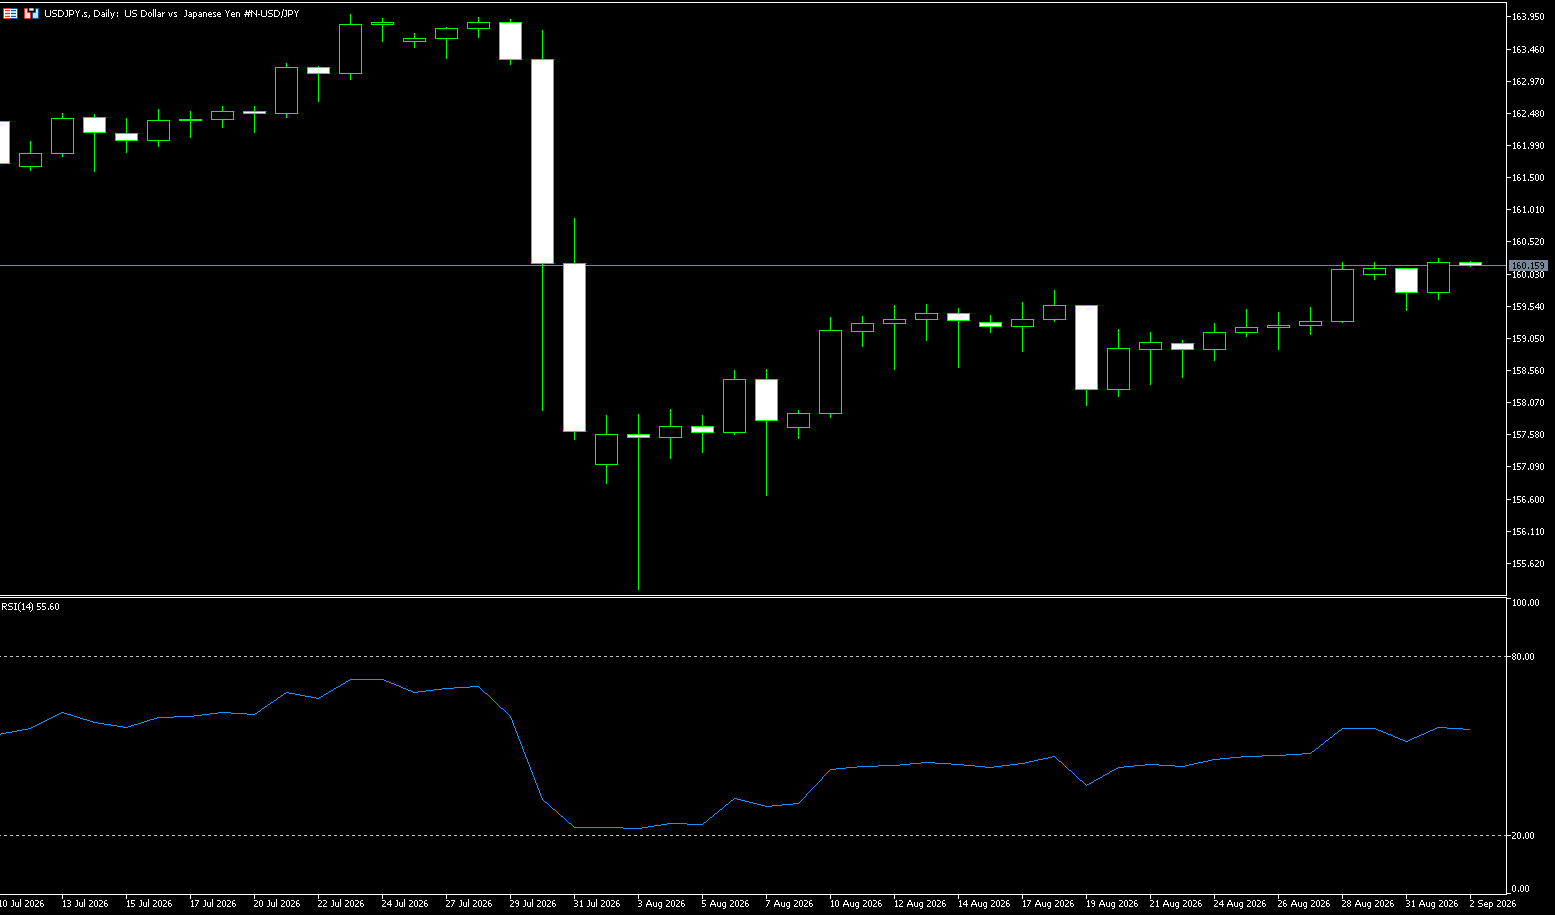
US Treasury Secretary Bessant stated during the G20 finance ministers' meeting that he believes the Japanese government and central bank will take action to strengthen the yen, adding, "I have information the market doesn't have." When asked if he meant an interest rate hike, he said, "I think the market is pricing that in." The yen strengthened after his comments, with USD/JPY trading around 160. According to media reports, Bessant held bilateral meetings with Bank of Japan Governor Kazuo Ueda and the Japanese Finance Minister during the G20. During the talks, he actively pushed for further interest rate hikes by the Bank of Japan and called for a clearer and more sustainable fiscal plan from Japan. The market reacted quickly. Bessant's remarks reinforced the already largely priced-in September rate hike expectations, leading to partial unwinding of carry trades and renewed activity among yen bulls. Despite the USD/JPY pair remaining high, investors are beginning to reassess the pace of interest rate differential narrowing. If the Bank of Japan provides clearer policy communication, coupled with signals of fiscal sustainability, the yen is expected to receive more sustained support, rather than relying solely on short-term intervention.
In the short term, USD/JPY is likely to oscillate within the 159.13 (20-day moving average) - 160.79 (50-day moving average) range. If the Bank of Japan raises rates in September and hints at a quarterly pace of rate hikes, the yen may move towards 158; if rate hike expectations fail to materialize or Warsh's speech continues to strengthen the dollar, the exchange rate may break through 160 and trigger a new round of intervention discussions. Further statements from US and Japanese officials during the G20 summit will be a key short-term variable. On the upside, near-term resistance lies at the high of 160.20 from the beginning of the week, followed by 160.79 (50-day moving average), which is the first hurdle for any rebound attempt, and holding below this level further strengthens the bearish tone. With no clear support level in the immediate data, the market focus remains on whether sellers can maintain pressure below 159.47 (early weekly low). A break above and above 158.36 (August 21 low) is needed to alleviate the current downward bias.
Consider shorting the US dollar at 160.35 today, with a stop-loss at 160.50 and targets at 159.70 and 159.60.
EUR/USD
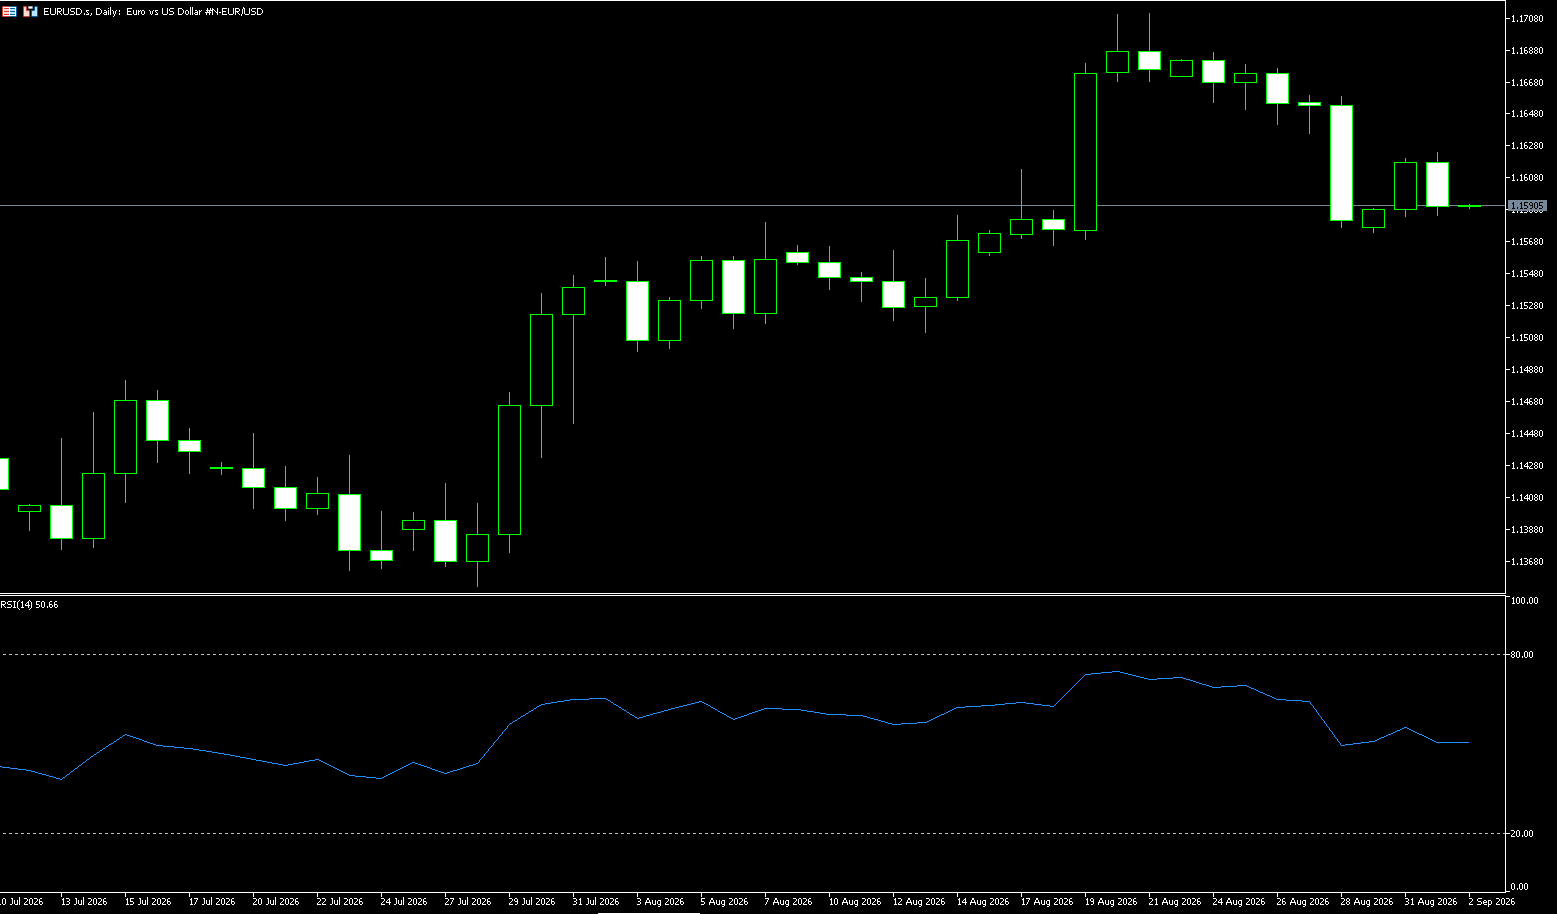
The euro/dollar pair rose slightly near 1.1600 in early trading on Tuesday. Despite hawkish comments from Federal Reserve Chairman Kevin Warsh at Jackson Hole, the dollar strengthened against the euro. Data released Monday by the German Federal Statistical Office (Destatis) showed that Germany's consumer price index (CPI) inflation rate rose to 2.9% year-on-year in August from 2.8% in July. This data met market expectations and marked the third consecutive month of increase. On a monthly basis, the CPI rose 0.2% in August, lower than the previous reading of 0.8% and weaker than the expected 0.3%. European Central Bank policymakers have already raised borrowing costs once and may raise interest rates again at their upcoming policy meeting on September 10. Traders are betting on further tightening of monetary policy next year. Across the Atlantic, hawkish comments from the Federal Reserve may support the dollar and limit the upside potential of this major currency pair. Warsh stated that if policymakers lack confidence that underlying inflation is returning to the 2% target, the Fed "still has work to do," leading traders to increase their bets on a September rate hike.
On the daily chart, EUR/USD is trading slightly below the psychological level of 1.1600. The pair maintains a constructive bias, with the spot price rising above the 20-day simple moving average at 1.1594 and the 100-day simple moving average at 1.1569, indicating that the underlying structure remains supportive after the recent rebound from the mid-1.15 level. Momentum is positive, and the Relative Strength Index (RSI) (14) is around 55, suggesting continued buying interest, but not yet overbought. On the upside, initial resistance is near the 200-day simple moving average at 1.1633, followed by 1.1711 (the recent high), where profit-taking may begin. On the downside, initial support is at the 100-day simple moving average at 1.1569, and further retracement would likely lead to stronger demand around the 1.1500 level.
Consider going long on Euros at 1.1580 today, with a stop loss at 1.1570 and targets at 1.1640 and 1.1630.
Stock Analysis:
Australian ASX 200 Stock Index
Basic Market Overview:
The Australian Securities Exchange (ASX) 200 index fell slightly on Tuesday, closing at 9,067 points, marking its second consecutive day of decline, pressured by weakness in retail trade, technology, and business services. Market sentiment remained cautious ahead of Wednesday's release of Australian second-quarter GDP data, with expectations that growth would continue to weaken after the slowest pace of the year in the previous quarter. Meanwhile, the latest data showed a record current account deficit of A$27.2 billion in the second quarter, although this deficit was smaller than expected. Nevertheless, some of the losses were offset by a private survey showing that factory activity in major trading partner China accelerated in July, with output, new orders, and exports all rising.
Meanwhile, US stock index futures rose slightly after a pullback on Wall Street on Monday, still achieving monthly gains. The four major banks fell slightly, while REA Group (-4.3%), Westfarmers (-3.2%), and Woolworths (-2.7%) also contributed to the decline. Energy stocks performed well, with Woodside Energy rising 1.1% and Santos Energy gaining 1.8%.
Sector Performance:
Leading Sectors: Energy, Coal, and Precious Metals. Stronger oil and coal prices drove the energy sector higher; Santos and Woodside Energy closed higher, while the mining/gold sector supported the index's decline.
Leading Sectors: Retail, Technology, Business Services, and heavyweight bank stocks Wesfarmers and Woolworths weakened after ex-rights trading; REA Group saw a significant pullback; the technology sector was collectively under pressure, limiting the market's upside potential.
Technical Analysis:
The ASX200 closed at 9066.7, down 0.10%, marking its second consecutive day of slight decline. The index initially tested lower levels before finding support, exhibiting a narrow range of consolidation with reduced volume throughout the day, reflecting strong market caution. The index has entered a pullback phase from its previous historical high of 9296.7, closing with a small bearish doji candlestick on Tuesday, representing a short-term consolidation after the high-level rise, without a significant breakout. Short-term moving averages are providing resistance, and bullish momentum is weakening; the RSI has fallen from overbought territory to neutral, indicating a temporary balance between bulls and bears. The intraday low held the key support zone of 9020-9000, and the bulls' defense is currently effective. Macroeconomic Background: The market is taking a wait-and-see approach, awaiting Australia's Q2 GDP data on Wednesday; rising US Treasury yields are suppressing growth stocks, while slightly improved Chinese manufacturing data is supporting the resource sector, resulting in a mixed news environment.
Wednesday Technical Scenario: Bullish Scenario (GDP in line with expectations/relatively loose): A firm hold above 9080 would test the 9120 resistance level; a breakout above 9120 with significant volume would retest the previous high above 9200, indicating a resumption of the upward trend after the pullback. Neutral Scenario (Data Meets Market Expectations): The price will continue to consolidate within the 9000-9120 range, digesting high-level profit-taking and awaiting new catalysts to choose a direction. Bearish Scenario (GDP Significantly Weaker Than Expected): A decisive break below 9000 and a close below this level will open up short-term downside potential, with the next target being the 8900-8940 support zone. Do not open positions before the release of major economic data; wait for a valid breakout of the range after the GDP data release before following the trend to avoid the risk of a sudden gap down after the data release.
Trading Strategy:
Short-Term Trading Strategy (Intraday/Next-Day Approach):
1. Bullish Approach (Light Position): Consider a small long position if the price retraces to the 9020-9000 support level and stabilizes; set a stop-loss below 8980; first take-profit at 9110, second take-profit at 9180-9200. Prerequisite: The 9000 level cannot be broken with significant volume during the trading session.
2. Bearish Strategy (Playing the Pullback): If the price rebounds to 9110-9120 and encounters resistance, a small short position can be initiated; place the stop-loss above 9150; the first target is 9030, with a further target of 8940 if it breaks through.
Key Risk Warnings:
1. Data Risk: A larger-than-expected deviation in Australia's Q2 GDP could trigger a significant gap in the index, posing a slippage risk to short-term stop-loss orders;
2. External Risks: Overnight performance of US stocks, fluctuations in US Treasury yields, and changes in commodity prices directly impact the resource-heavy sectors of the Australian stock market;
3. Structural Risks: Significant market divergence; large differences in individual stock performance during index fluctuations;
China Shanghai Composite Index
Basic Market Overview:
The Shanghai Composite Index fell 0.16% on Tuesday, closing at 3979.9 points, while the Shenzhen Component Index fell 1.02% on the first trading day of September, as escalating tensions in the Middle East overshadowed signs of improvement in China's manufacturing sector. The US and Iran clashed for the first time in nearly a month, with US forces attacking an island in the Strait of Hormuz and Iran retaliating with attacks on the UAE and Jordan. This latest hostilities has cast a shadow over the prospects for restoring normal shipping through this strategic waterway. Domestically, a private survey showed that China's manufacturing PMI rose to 51.5 in August from a four-month low of 50.9 in July, exceeding the forecast of 51.0.
This is consistent with official data showing a manufacturing PMI rise to 49.8 from 49.2, and also exceeds market expectations of 49.7. Notable decliners include Foxconn Industrial Internet (-2.93%), SMIC (-2.01%), CATL (-1.50%), and NAURA Technology Group (-4.59%).
Sector Performance:
Leading sectors: Agriculture/Grain and Seed Industry. High-dividend financial stocks (banks > insurance > securities) showed moderate strength, with safe-haven funds continuing to support the market in a volatile market, supporting the lower limit of the overall market. AI Media / Short Drama Applications. Low-end consumer retail, supported by consumption-stimulating policies, represents a defensive sector undergoing a shift in capital flows, offering a safe-haven attribute during volatile markets.
Leading Declining Sectors: AI Hardware, Optical Modules, CPO, Semiconductors
Technical Analysis:
Tuesday's opening price was 3979.99, with a high of 3995.18, a low of 3976.47, and a closing price of 3979.89, a daily decrease of -0.16%. Shanghai Stock Exchange turnover was 944.3 billion yuan, and the total turnover of the two markets was 2.03 trillion yuan, a decrease of approximately 97.6 billion yuan compared to the previous trading day. The candlestick pattern formed a small upper shadow doji (inverted T-shaped candlestick), indicating a pullback after reaching a high near 3995, with bulls failing to break through the 4000 mark. There is significant divergence between bulls and bears, and the upward movement lacks incremental capital support. Short-term moving averages remain upward, and the index stays above the short-term support zone; however, the 4000 psychological level combined with the resistance zone of medium- and long-term moving averages indicates increasing selling pressure; the market is characterized by low volume: there was neither a significant sell-off nor a breakout with high volume, indicating a wait-and-see consolidation phase.
On Wednesday, the Shanghai Composite Index outperformed the Shenzhen Component Index, with heavyweight stocks lagging behind while small-cap and thematic stocks showed relatively better activity. Although the index fluctuated, the profit-making effect for individual stocks has not completely disappeared. Overall, after the low-volume doji, the market is likely to maintain a high-level consolidation and shakeout pattern, with two scenarios: Scenario A (Slightly Strong): A breakout above 3995 with high volume, followed by a test of 4000; however, increased volume is necessary, with trading volume needing to return to above 2.1 trillion yuan for a valid breakout; Scenario B (Slightly Weak): Failure to break out with high volume will result in a downward pullback to confirm support, testing the 3960-3970 area, with an extreme pullback target around 3925. If the price continues to rise with decreasing volume, the top divergence structure will be further confirmed, increasing the probability of a short-term pullback. If the price breaks through with increasing volume, the divergence will become invalid, and the rebound trend will continue.
Trading Strategy:
Short-term Trading Strategy (Intraday/Next-Day Swing Trading)
1. For those holding positions: Near the 3990-4000 resistance zone: Gradually reduce positions to take profits on high-priced stocks, avoiding blindly adding to positions and chasing highs. If the price retraces to around 3970 and stabilizes with decreasing volume, retain a core position to play the rebound. If the price breaks below 3960 with increasing volume, further reduce the overall position to avoid short-term pullbacks.
2. For those holding cash and observing: Do not chase highs, and do not enter the market with heavy positions above 3990. Observe two conditions for buying on dips: the index retraces to the 3925-3940 support zone and stabilizes + market sentiment improves. Only after a valid breakout above 4000 with increasing volume is it suitable to add to positions with small positions to play for new gains. Key Risk Warnings:
1. Volume Risk: With continuously shrinking volume, the validity of breaking through 4000 points is insufficient, and a pullback is likely to occur after a surge.
2. Index Divergence Risk: While the Shanghai Composite Index is supported by heavyweight stocks, the ChiNext and STAR Market 50 are weak. Individual stock performance cannot be judged solely by the Shanghai Composite Index; sector rotation and divergence are significant risks.
3. Technical Divergence Risk: The hourly chart shows a bearish divergence, and once profits are realized, the short-term pullback will be larger.
4. External and News Disturbances: Fluctuations in US stocks and policy changes could alter the intraday trading pattern at any time.
Disclaimer: The information contained herein (1) is proprietary to BCR and/or its content providers; (2) may not be copied or distributed; (3) is not warranted to be accurate, complete or timely; and, (4) does not constitute advice or a recommendation by BCR or its content providers in respect of the investment in financial instruments. Neither BCR or its content providers are responsible for any damages or losses arising from any use of this information. Past performance is no guarantee of future results.
More Coverage






2026 © - All Rights Reserved by BCR Co Pty Ltd
Risk Disclosure:Derivatives are traded over-the-counter on margin, which means they carry a high level of risk and there is a possibility you could lose all of your investment. These products are not suitable for all investors. Please ensure you fully understand the risks and carefully consider your financial situation and trading experience before trading. Seek independent financial advice if necessary before opening an account with BCR.
BCR Co Pty Ltd (Company No. 1975046) is a company incorporated under the laws of the British Virgin Islands, with its registered office at Trident Chambers, Wickham’s Cay 1, Road Town, Tortola, British Virgin Islands, and is licensed and regulated by the British Virgin Islands Financial Services Commission under License No. SIBA/L/19/1122.
Open Bridge Limited (Company No. 16701394) is a company incorporated under the Companies Act 2006 and registered in England and Wales, with its registered address at Kemp House, 160 City Road, London, England, EC1V 2NX. Open Bridge Limited acts solely as a payment processor for BCR Co Pty Ltd and does not provide any financial, trading, or investment services on its behalf. Open Bridge Limited's role is limited to payment processing.


 English
 简体中文
简体中文
 繁體中文
繁體中文
 Bahasa
Melayu
Bahasa
Melayu
 Tiếng
Việt
Tiếng
Việt
 ไทย
ไทย
 日本語
日本語
 한국어
한국어
 ភាសាខ្មែរ
 español