


0
Stock Market Analysis
Australia ASX 200 Index
MARKET OVERVIEW
Australia's ASX 200 fell 88 points, or 1.0%, on Wednesday to close at 8,978, extending its losing streak to a third session and marking a four-week low. Wall Street had also declined for a third straight session on Tuesday as renewed Middle East tensions weakened risk sentiment, pushed oil prices higher and revived inflation concerns and expectations of further rate increases.
Concerns over supply disruptions and inflation kept local traders cautious, with markets pricing close to a 60% probability that the Reserve Bank of Australia will raise rates later this month. Traders are also awaiting Thursday's July trade data after strong exports and weak imports in June. Losses were limited, however, by stronger-than-expected second-quarter GDP, supported by private demand and mining exports.
Weakness was broad-based, with non-energy materials, commercial services and consumer names among the biggest drags. BHP fell 3.6% and Rio Tinto lost 1.9%, weighing on the mining sector, while softer gold prices pressured Northern Star Resources (-5.0%) and Evolution Mining (-1.9%). In contrast, Woodside Energy gained 1.2%, while the four major banks rose between 0.2% and 0.5%.
Hong Kong Hang Seng Index
MARKET OVERVIEW
The Hang Seng Index fell 0.8%, or 210 points, on Wednesday to around 25,105, extending its decline to a third consecutive session as escalating U.S.-Iran tensions drove broad risk aversion across Asian markets. U.S. airstrikes on Iran and retaliatory Iranian attacks intensified concerns about further disruption in the Strait of Hormuz, pushing Brent crude above $95 a barrel and WTI above $91.
Higher energy prices revived inflation concerns and pushed the U.S. 10-year Treasury yield up to 4.798%, while markets increased the probability of a Federal Reserve rate hike. Meanwhile, Shein fell another 0.45% on Wednesday to HK$48.28 after dropping as much as 10% on its first trading day on Tuesday, highlighting investor caution toward the long-awaited IPO.
A stronger U.S. dollar and higher borrowing costs also increased pressure on Hong Kong's rate-sensitive and technology shares. Notable laggards included Cathay Pacific (-5.0%), Tencent (-1.3%), Z.AI (-6.0%), Lenovo (-1.2%) and MiniMax (-1.1%).
Currency Analysis
U.S. Dollar Index
MARKET OVERVIEW
The U.S. Dollar Index rose 0.25% on Tuesday to close at 99.64. The move was driven mainly by a renewed escalation in the U.S.-Iran conflict, which lifted oil prices and global government-bond yields, intensifying inflation concerns. The U.S. 10-year Treasury yield reached its highest level since January 2025, while Japan's 30-year government-bond yield moved above 3% for the first time in 30 years.
Early Wednesday, the index was quoted at 99.55, near a three-week high, as surging oil prices strengthened inflation concerns and reinforced expectations that the Federal Reserve could raise rates soon. Oil rose for a third consecutive session amid renewed U.S.-Iran hostilities and growing fears of further disruption to Middle East energy flows. Fed Chair Kevin Warsh's commitment to fighting inflation also strengthened rate-hike expectations, with markets now pricing roughly a 70% chance of an increase this month. Fed Governor Michael Barr said Tuesday that the central bank should be prepared to raise rates if inflation fails to ease.
TECHNICAL VIEW
The dollar is currently supported by rising Treasury yields, higher oil prices and safe-haven demand. Whether this short-term rebound develops into a sustained advance will still depend on whether U.S. economic data can validate the durability of a higher-rate environment.
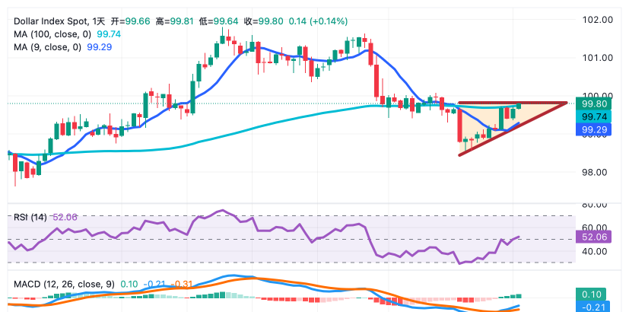
On the daily chart, the Dollar Index retains a mildly bearish structure and is trading around 99.65, still just below the 100-day EMA at 99.74. This is the key near-term resistance level for bulls. A decisive break and hold above 99.74 would bring the 100.00 psychological level and the 100.50 area into focus. If the index remains capped, support may emerge around 99.28, the 9-day moving average, and 99.00, the next psychological level.
AUD/USD
MARKET OVERVIEW
AUD/USD fell to a one-and-a-half-week low during Wednesday's Asian session and was trading around 0.7165, extending its decline to a second consecutive session. The initial positive reaction to Australia's stronger-than-expected second-quarter GDP faded quickly as follow-through U.S. dollar buying emerged, supported by rising Fed rate-hike bets and escalating U.S.-Iran tensions.
This suggests that the path of least resistance for AUD/USD remains tilted to the downside and supports an extension of the pullback from last Friday's recent high, just above 0.7200 and the strongest area since mid-May. After the GDP release, the market raised the probability of a fourth rate increase at the September meeting from 48% to 57%, while a November rate hike is now fully priced. The probability of another increase in the first quarter of 2027 also rose from 62% to 82%.
At the same time, concerns about potential oil-supply disruption from the escalating U.S.-Iran conflict pushed energy prices higher and added to inflation pressure. However, the stronger U.S. dollar capped the Australian dollar's upside as higher yields increased demand for the safe-haven currency.
TECHNICAL VIEW
Any further decline is likely to find meaningful support near the 0.7125 confluence zone, where the 100-period simple moving average on the four-hour chart meets the 23.6% Fibonacci retracement of the June-August rally. This suggests that the technical backdrop remains supportive even though the 14-period RSI has slipped toward the mid-30s. MACD points to fading momentum rather than a clear bearish reversal.
A decisive break below 0.7125 would expose the next Fibonacci support levels near 0.7074, 0.7033 and 0.6992. On the upside, the 0.7170 area is the first resistance ahead of 0.7200. A break above 0.7200 would provide a fresh bullish trigger. As long as AUD/USD remains above the 0.7125 confluence support, the short-term bullish bias remains intact.
GBP/USD
MARKET OVERVIEW
GBP/USD slipped toward 1.3500 in early European trading on Wednesday. Persistent tensions in the Middle East supported safe-haven currencies such as the U.S. dollar and weighed on sterling. Investors are now focused on the U.S. August employment report due Friday.
CNBC reported that the United States and Iran exchanged another round of attacks on Tuesday. President Donald Trump said the strike was retaliation for Iran's attempt to lay mines in a key waterway and for an earlier attack on a military base, warning that further strikes would follow if Tehran responded.
Bank of England Governor Andrew Bailey played down the inflation threat, saying the United Kingdom has not seen significant second-round inflation effects. According to Bloomberg, markets have fully priced a 25-basis-point rate increase this year and expect another move next spring. Bailey said second-round effects had been fairly modest and that labour-market weakness had been evident for some time, adding that policymakers could watch the situation for now.
TECHNICAL VIEW
On the daily chart, GBP/USD retains a mildly constructive bias because spot remains above the 100-day simple moving average at 1.3442 and the lower Bollinger Band at 1.3436, indicating potential dip-buying demand. However, price is still below the Bollinger mid-band at 1.3551, showing that upside momentum has not yet taken control. RSI is around 48.47, keeping momentum neutral to slightly range-bound.
Initial resistance sits at the Bollinger mid-band at 1.3551. A daily close above this level would open room for a move toward the 1.3600 psychological level. On the downside, the 1.3500 area provides immediate support, while the 100-day SMA at 1.3442 and the lower Bollinger Band at 1.3436 form a nearby demand zone. A break below that area would weaken the current constructive bias.
USD/JPY
MARKET OVERVIEW
The yen strengthened broadly, with USD/JPY plunging nearly 1% after approaching the 160 level and then trading around 158.70. The abrupt move triggered speculation that Japanese authorities may have intervened in the foreign-exchange market or conducted a rate check, although there has been no official confirmation.
The previous joint U.S.-Japan intervention took place in late July, when USD/JPY climbed close to 164, a 40-year high. A global bond selloff has pushed the 10-year Japanese government bond yield to the historic 3% level for the first time since 1996, increasing the servicing cost of Japan's large debt burden. At the same time, Prime Minister Sanae Takaichi is planning aggressive investment while raising concerns about long-term fiscal stability, factors seen as weakening the yen and providing a tailwind for USD/JPY.
U.S. Treasury Secretary Scott Bessent has also expressed support for decisive monetary measures to address yen weakness, further strengthening the case for a Bank of Japan rate increase this month. Even so, the hawkish outlook has not been enough to attract sustained yen buying because Japan's borrowing costs remain well below those of other major economies, including the United States. This keeps yen-funded carry trades active and continues to support USD/JPY.
TECHNICAL VIEW
After the sudden drop toward the 158.00 area, a two-week low, USD/JPY has been recovering gradually and is now trading around 158.50-158.70 as traders continue to assess the possibility of renewed intervention by the Bank of Japan and the Ministry of Finance.
The short-term tone remains constructive. The pair is attempting to build momentum toward the 200-period simple moving average on the four-hour chart at 160.20. The 61.8% Fibonacci retracement near 160.64 could provide the next upside barrier, followed by the 78.6% retracement around 162.10 and the previous high near 163.96. On the downside, initial support is located at the 38.2% Fibonacci level at 158.59, followed by the 158.00 psychological level. A break below would expose 157.56, the August 6 low.
EUR/USD
MARKET OVERVIEW
During Wednesday's European session on September 2, EUR/USD traded in a narrow range around 1.1585 and was marginally lower on the day. The pair remains near its lowest levels since August 20 as the market waits for the European Central Bank's latest policy guidance, with rate-hike expectations the key short-term driver for the euro.
ECB Governing Council member Gabriel Makhlouf told the media that next week's policy decision 'will not surprise anyone,' with markets close to fully pricing a September rate increase. He said policy is not yet restrictive and would only become 'broadly restrictive' once rates rise above 2.75%. Makhlouf added that the central bank must be prepared to act if inflation risks rise materially and would have to respond if inflation moved in the wrong direction.
A weaker U.S. labour market and policy uncertainty are expected to remain negative for the dollar, leaving room for further euro appreciation over the medium term. Short-term volatility may increase because of energy prices and policy divergence between the United States and Europe, but the broader path remains tilted toward a stronger euro. As long as the Federal Reserve's independence is not seriously called into question, sustained dollar strength may be difficult to maintain, while improving fiscal and growth conditions could gradually support the euro toward higher target levels.
TECHNICAL VIEW
On the daily chart, EUR/USD is trading just above its 100-day simple moving average at 1.1567, which provides immediate support, but remains below the Bollinger mid-band at 1.1602, leaving spot slightly pressured within the recent range. RSI is 50.02, effectively neutral, indicating a lack of directional momentum while price consolidates between nearby support and overhead resistance.
Immediate resistance sits at 1.1600, the psychological level, and 1.1602, the Bollinger mid-band. A more important barrier is the previous Friday's high near 1.1655, where recent rebounds could encounter selling pressure. On the downside, the 100-day SMA at 1.1567 defines immediate support. A break below would bring the 1.1500 psychological level into view and open room for a deeper pullback within the broader consolidation range.
Commodity Analysis
WTI Spot Crude Oil
MARKET OVERVIEW
Oil prices surged on Tuesday. Brent crude gained 5.06% to settle at $90.68 a barrel, while U.S. crude rose 4.65% to $89.50, with both benchmarks closing at five-week highs. The main catalyst was another escalation in the U.S.-Iran conflict.
The United States launched a new round of airstrikes on Iranian targets, while two tankers were attacked near the Strait of Hormuz. Iran warned that it would block Gulf oil exports, and the U.S. Treasury Secretary threatened tougher sanctions, increasing market fears of supply disruption in the Middle East. Renewed conflict also raised concern that energy flows through the Strait of Hormuz could face prolonged disruption.
Production outages at refineries around the world, particularly in the Middle East and Russia, have also lifted refined-product prices. U.S. diesel futures jumped to a 52-month high and have risen around 51% over the past 10 weeks, while the crack spread reached a record of roughly $107 a barrel.
On Sunday, the U.S. military carried out what it described as 'limited and precise' strikes on two launch facilities on Iran's Larak Island in the Strait of Hormuz, saying the Islamic Revolutionary Guard Corps was preparing to launch rockets carrying mines into the waterway. Iran's Tasnim News Agency reported three fatalities, including two members of the IRGC Navy.
TECHNICAL VIEW
On the daily chart, WTI has reclaimed the $85 psychological level and the 100-day moving average around $85.11, while also breaking above the previous short-term resistance band around $83-$84. The broader structure has therefore shifted back from correction into a stronger configuration.
The $90 area is now an important pivot between buyers and sellers, while the source report identifies $86-$87 as the first resistance zone. If price decisively breaks above the upper Bollinger Band near $89.67 and holds above it, the next phase could retest the $90 area. If risk sentiment intensifies further, the market could challenge the previous cyclical high around $95.
On the downside, initial support is near the $85 psychological level and the 100-day moving average around $85.11. As long as WTI remains stable above $82, the daily-chart rebound structure has not been materially damaged.
Spot Gold
MARKET OVERVIEW
Gold rose above $4,390 an ounce in Wednesday afternoon trading, rebounding from a near one-month low as the U.S. dollar and Treasury yields eased from recent highs. Investors are waiting for Friday's U.S. employment data for further guidance on the Federal Reserve's policy outlook.
Oil prices reached a six-week high as traders weighed supply risks from the continuing Middle East conflict against signs that crude was still reaching the market. Meanwhile, the latest ADP report showed that U.S. private employers added 38,000 jobs in August, the weakest increase since January and below the 47,000 expected, signalling broader cooling in the labour market.
According to the CME FedWatch tool, markets now assign a 66% probability to a Federal Reserve rate increase in September, up from roughly 40% a week earlier. The Dutch central bank also said it had transferred 86 metric tonnes of gold from New York and Ottawa to London over the past six months to improve tradability and strengthen crisis preparedness.
TECHNICAL VIEW
If Federal Reserve policy communication falls short of the market's rate-hike expectations, the U.S. dollar is likely to weaken before the end of September. If the Fed chooses to keep policy unchanged rather than tighten, gold's upward trend could extend and reopen further upside.
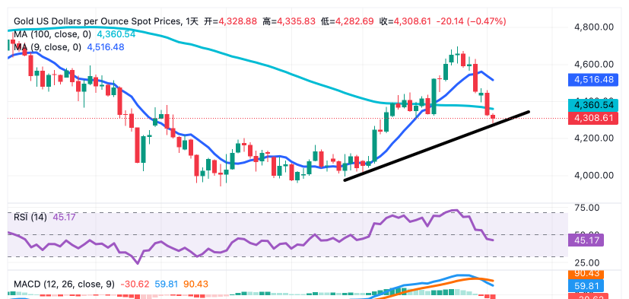
On the daily chart, however, gold remains technically bearish because spot is still below the $4,400 psychological level, suggesting that the rebound is being capped by overlapping dynamic resistance. RSI is near 50 and hovering just below the neutral midpoint, indicating that downside momentum is weakening but has not yet produced a convincing rebound signal.
Initial resistance is at $4,400, while a stronger bullish extension would target the Bollinger mid-band around $4,446. On the downside, $4,300 is the next key support area. A daily close below that level would open the door to a deeper correction toward the lower Bollinger Band around $4,207.
More Coverage






2026 © - All Rights Reserved by BCR Co Pty Ltd
Risk Disclosure:Derivatives are traded over-the-counter on margin, which means they carry a high level of risk and there is a possibility you could lose all of your investment. These products are not suitable for all investors. Please ensure you fully understand the risks and carefully consider your financial situation and trading experience before trading. Seek independent financial advice if necessary before opening an account with BCR.
BCR Co Pty Ltd (Company No. 1975046) is a company incorporated under the laws of the British Virgin Islands, with its registered office at Trident Chambers, Wickham’s Cay 1, Road Town, Tortola, British Virgin Islands, and is licensed and regulated by the British Virgin Islands Financial Services Commission under License No. SIBA/L/19/1122.
Open Bridge Limited (Company No. 16701394) is a company incorporated under the Companies Act 2006 and registered in England and Wales, with its registered address at Kemp House, 160 City Road, London, England, EC1V 2NX. Open Bridge Limited acts solely as a payment processor for BCR Co Pty Ltd and does not provide any financial, trading, or investment services on its behalf. Open Bridge Limited's role is limited to payment processing.


 English
 简体中文
简体中文
 繁體中文
繁體中文
 Bahasa
Melayu
Bahasa
Melayu
 Tiếng
Việt
Tiếng
Việt
 ไทย
ไทย
 日本語
日本語
 한국어
한국어
 ភាសាខ្មែរ
 español