


0
Currency & Commodity Analysis:
US Dollar Index
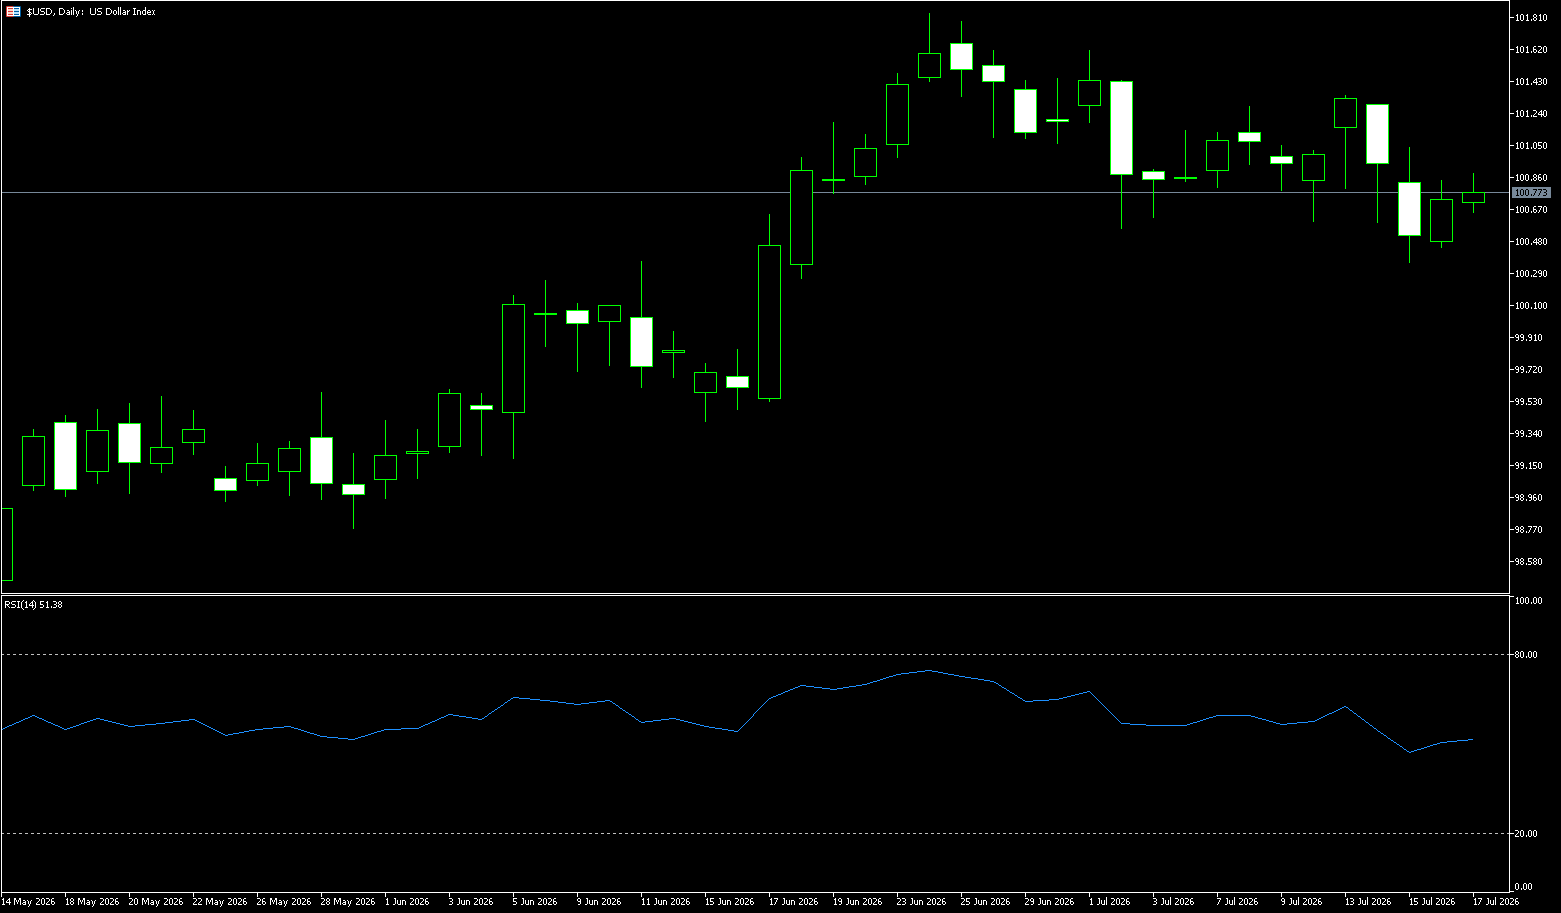
The US dollar index fell sharply last week, hitting a low of 100.36, as easing inflationary pressures reduced expectations for a near-term Federal Reserve rate hike. Data released last week showed that the Producer Price Index (PPI) unexpectedly declined in June, the first time in nearly a year, mainly due to lower energy costs, following Tuesday's lower-than-expected CPI inflation report. The market lowered its expectations for a September rate hike by the Federal Reserve, with the implied probability falling from 50% the previous day to about 44%. Meanwhile, investors continued to focus on escalating attacks in the Middle East following additional US strikes against Iranian targets. Renewed conflict caused a sharp rise in oil prices this week, raising renewed concerns about the inflation and interest rate outlook. Despite this, President Trump stated last week that Tehran had indicated a willingness to resume negotiations.
The US dollar index exhibited a clear downward consolidation trend last week. Amidst fluctuating expectations regarding the Federal Reserve's monetary policy and the interplay of geopolitical risks, market participants showed significant divergence in their views on the future trajectory of the dollar, and the technical battle between bulls and bears intensified. This week, the market is driven by multiple macroeconomic factors, with expectations regarding the Federal Reserve's interest rate path becoming the dominant factor. A comprehensive assessment of candlestick patterns, moving averages, and the Relative Strength Index (RSI) reveals that the US dollar index is currently in a critical phase of a battle between bulls and bears. Looking back at last week's market performance, the US dollar index entered a technical correction period after falling from its previous high. At the beginning of the week, the dollar saw a short-term rebound due to a reassessment of US inflation data, but it failed to break through key resistance levels. Mid-week and the end of the week saw the index give back some of its gains, generally remaining within a narrow range.
Last week, the US dollar index rose initially before falling, exhibiting a pattern of initial gains followed by a decline. At the beginning of the week, it rose from support, reaching a high of around 101.33. However, the significantly lower-than-expected US June CPI and PPI figures triggered a rapid downward revision of interest rate hike expectations, causing the dollar to plummet from above 101, reaching a low of around 100.36. Short-term bullish momentum has significantly weakened. The daily chart shows that after last week's sharp drop in CPI and PPI data, the US dollar index broke below the short-term moving average band, with the moving averages turning from support to resistance, indicating a weakening short-term trend and entering a consolidation phase. The MACD indicator formed a death cross above the zero line, with the green bars expanding, releasing bearish momentum. The RSI has fallen from around 58 to the 46 range, but has not yet entered oversold territory below 30, suggesting that the downside potential has not been fully realized. Furthermore, the index has fallen below the Bollinger Band midline, and the channel has shifted from expanding to converging, indicating a decrease in expected volatility.
Meanwhile, the US dollar index's short-term trend has weakened, entering a consolidation phase. If US Treasury yields remain weak, Fed officials speak dovishly, and risk sentiment improves, but the rebound fails to hold above 100.85 (the 25-day simple moving average) and 101.00 (the psychological level), it will likely test lower levels again. Conversely, 101.35–101.60 (the high point of this rebound, a watershed between bulls and bears) is the next target price for the bulls. On the downside, if the US dollar index retests 100.36; if it breaks below 100.36 {last week's low} - 100.00 {psychological support level}, the index will head straight for 99.49 {June 17 low}.
Today, consider shorting the US dollar index at 100.88, with a stop loss at 100.98 and targets at 100.40 and 100.30.
WTI Crude Oil
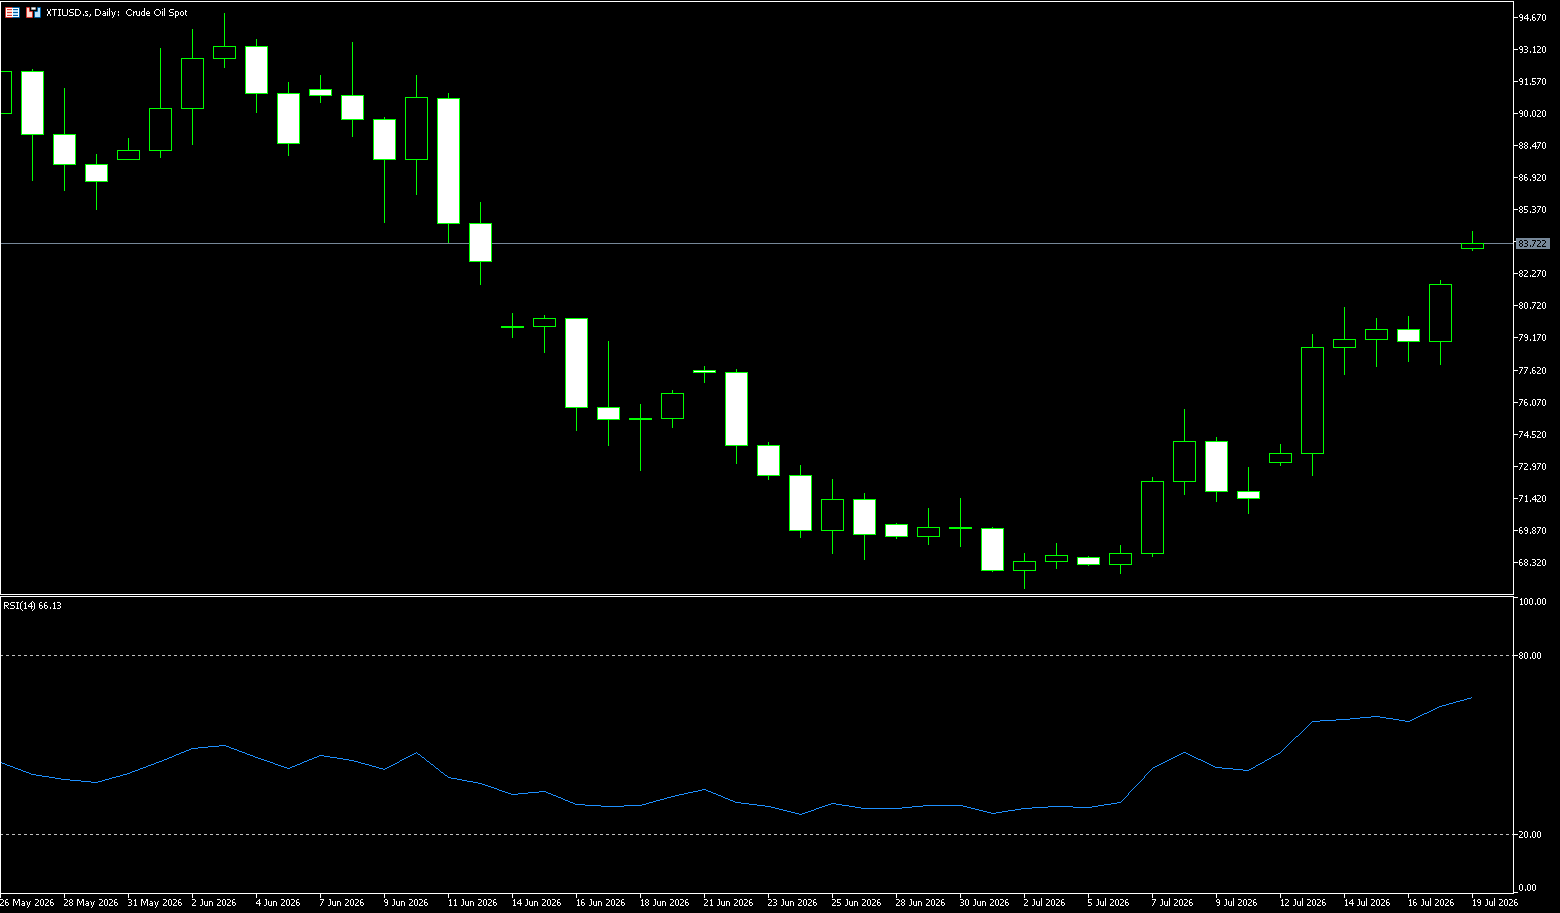
Before the end of last week, WTI crude oil was trading slightly below $82 a barrel, up more than 14%, as escalating attacks between the US and Iran heightened concerns about supply disruptions in the Middle East. The US launched several strikes against Iran this week, including the first attack on an oil tanker near the country's main export terminal, after the US reimposed a blockade on Iranian ports. President Trump also warned that the US might target Iranian infrastructure next week unless diplomatic efforts yield a breakthrough. Meanwhile, Tehran instructed Houthi rebels in Yemen to close the Babu Mandeb Strait, a key shipping route for Saudi Arabia's oil exports through the Red Sea, should Iran's power infrastructure be attacked. Shipping traffic in the Strait of Hormuz has dropped sharply since the latest escalation, although some ships are still passing through the waterway.
Overall, the escalation of the US-Iran geopolitical conflict and the disruption of shipping across the Strait have strongly resonated, directly dominating the recent trend in the international crude oil market. Currently, WTI crude oil prices are around $82, a cumulative increase of over 14% since before the conflict, with the geopolitical risk premium continuing to be released. In the short term, the US's escalating bombing and blockade operations, Iran's tough energy countermeasures and retaliatory stance, and the current sluggish shipping traffic across the Strait will continue to support the resilience of oil prices. Therefore, facing the situation of toll fees secured by Iran, the Revolutionary Guard actually has a strategic advantage. If the Iranian military makes a concession, it may directly declare a victory for the US in a war of attrition. Conversely, if Iran maintains its hardline stance, the situation remains unclear.
Last week, US WTI crude oil prices experienced a V-shaped reversal, a violent surge followed by high-level consolidation. Overall, the escalation of the US-Iran geopolitical conflict and the disruption of shipping across the Strait have strongly resonated, directly dominating the recent trend in the international crude oil market. Technically, WTI crude oil has shown a pattern of significant increase followed by slight consolidation, meaning there has been no significant pullback after the sharp rise, suggesting that the bullish forces are relatively strong. Oil prices have stabilized above the 5-day moving average of $79.48, with short-term moving averages turning upwards to form support. The MACD indicator shows a significant waning of bearish momentum and a release of bullish rebound momentum; however, it has not yet crossed the zero line, indicating it is merely a rebound, not a trend reversal. The RSI (14) is operating in the neutral-to-strong range of 56–62, not yet reaching the extreme overbought level above 70, theoretically still retaining upward testing space; however, after a continuous surge, the indicator has the potential risk of dulling and top divergence.
According to the daily chart, WTI crude oil prices are currently stabilizing above the 5-day moving average of $79.48, indicating a recovery after an oversold condition. The candlestick pattern shows a consolidation after three consecutive large bullish candles, a typical signal of a pause and consolidation after an upward move, with the market awaiting new catalysts. Further upward movement is possible, with $80.17 (nearly one-month high) being a key resistance level. A decisive break above this level would open up further upside potential to the 50-day moving average at $83.30, and a break below that would target the 100-day moving average at $87.63. Conversely, if WTI oil prices fall below the 5-day moving average at $79.48, they will likely test last week's low of $77.89. A break below this level would signal the end of the current rebound.
Today, consider going long on crude oil at $81.55, with a stop-loss at $81.35 and targets at $83.00 and $84.00.
Spot Gold
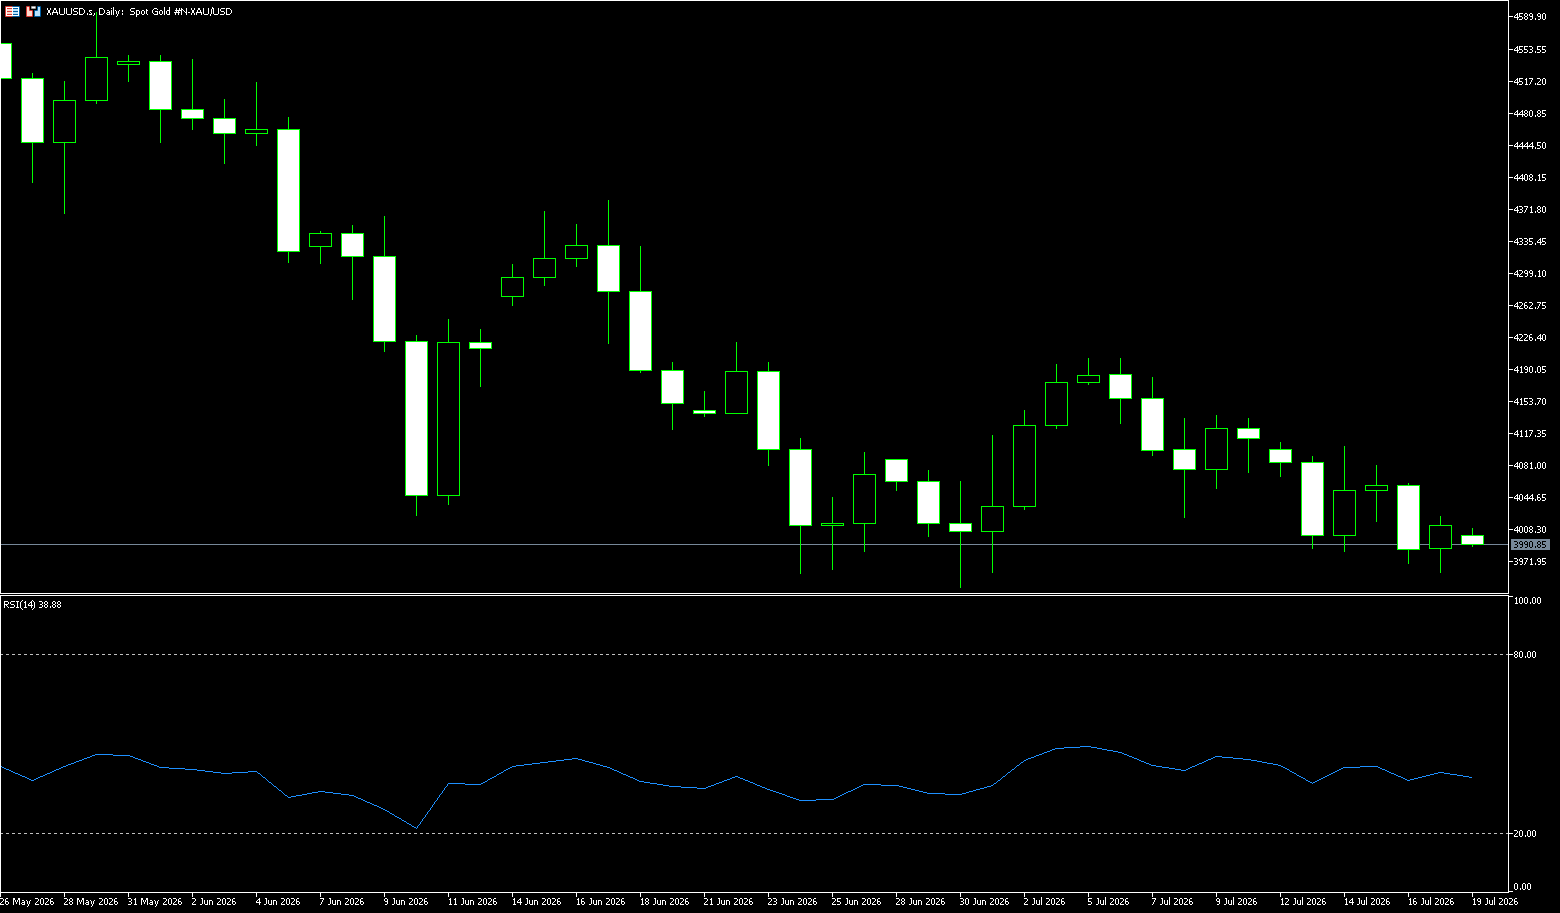
Gold remained around $4,000 per ounce last week, falling approximately 2.5% for the week, as escalating tensions in the Middle East pushed up oil prices, keeping inflationary pressures and interest rate concerns at the forefront. This week, the US launched multiple strikes against Iran, and President Trump warned that the US might target the country's infrastructure next week if diplomatic efforts fail to achieve a breakthrough. Iran responded by attacking a US base in a neighboring country, further exacerbating concerns about escalation and a prolonged disruption to energy supplies in the region. Meanwhile, last week's lower-than-expected US inflation data essentially ruled out a July rate hike, even though Federal Reserve Chairman Kevin Warsh reiterated his commitment to restoring price stability. However, market disagreement persists regarding a September rate hike by the Fed, putting pressure on non-yielding gold.
The situation in the Strait of Hormuz has again fueled concerns about runaway price pressures. If escalating tensions lead to a sustained rise in oil prices, it could offset recent inflation slowdowns, prompting central banks to maintain high interest rates for a longer period, thus diminishing gold's appeal. On the other hand, the geopolitical conflict itself strengthens gold's status as a traditional safe-haven asset, especially given the weakening dollar, which, while possessing safe-haven characteristics, is weighed down by inflation data. Overall, despite increased short-term volatility, gold is expected to maintain a relatively strong performance amidst the dual narratives of easing inflation and geopolitical risks. However, the escalating US-Iran conflict, the US airstrikes on Iran, and the tensions in the Strait of Hormuz pushing up oil prices create a complex interplay of inflation risks and safe-haven demand. Gold prices are locked in a tug-of-war around the $4,000 level, with a slightly bullish outlook. Investors should pay close attention to geopolitical developments and the Federal Reserve's actions.
On the daily chart, gold is trading with a clear bearish tone, as prices are clearly below the 20-day moving average at $4.072, the 34-day simple moving average at $4,162, and the longer-term 100-day simple moving average at $4,535. This overlapping configuration of simple moving averages above suggests that a rebound may be limited, especially considering that the shorter-term simple moving averages are accelerating downwards below the longer-term ones. The same chart shows momentum indicators further exacerbating the weakness, with the slope extending into negative territory. The 14-day Relative Strength Index (RSI) is moving towards 41-42, while the momentum indicator has also turned negative, reinforcing the view of continued downward pressure.
Technically, gold prices are currently in a tug-of-war around the $4,000 psychological level, perfectly reflecting the two-way struggle between safe-haven demand and interest rates. Rising oil prices have fueled inflation expectations, forcing US Treasury yields to remain high and significantly increasing the opportunity cost of holding gold. However, escalating threats from Iran have prevented safe-haven funds from exiting the market. In the short term, a clear break below the key support level of $3980-$4000, an area that has been tested multiple times, could lead to a test of $3943.70 (the low of June 30th), and even further to $3820 (the low of last October) and the psychological support level of $3800. On the upside, initial resistance is located near the 20-day simple moving average at $4072, followed by the psychological level of $4100. In the event of a deeper corrective rebound, the daily simple moving average at $4162 will become a stronger resistance level.
Today, consider going long on gold at $4013, with a stop loss at $4008; targets: $4060; $4070.
AUD/USD
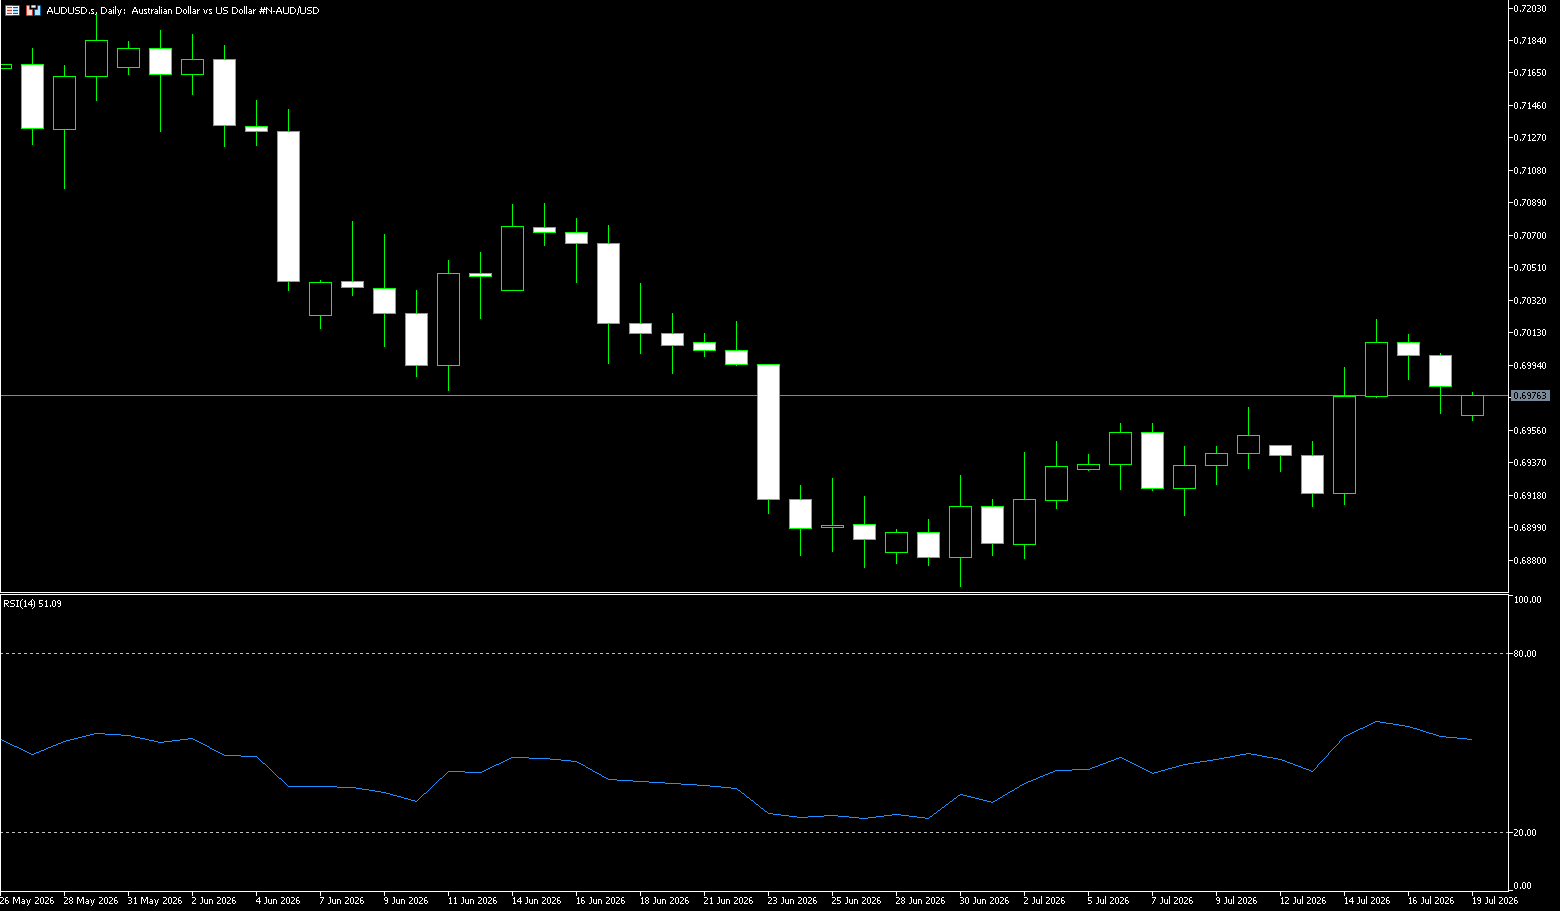
Last week, the Australian dollar rebounded from a low of 0.6915 to US$0.7020 before the weekend, near a three-week high, as a weaker dollar offset concerns about escalating conflict in the Middle East. The US launched another wave of attacks on Iranian coastal military assets and reinstated a naval blockade against Iran. Renewed tensions sent oil prices soaring and fueled renewed concerns about inflation. However, a generally weaker US dollar supported the Australian dollar as easing US inflationary pressures reduced expectations for a near-term Federal Reserve rate hike. In Australia, inflation expectations fell for the third consecutive month, dropping to a six-month low of 4.7% in July, down from 5.5% the previous month. The market now only prices a 20% chance of a rate hike in August and around a 60% chance by December. Traders are now awaiting key employment and inflation data later this month for new clues about the policy outlook.
The Australian dollar traded almost flat against a weaker US dollar as unexpectedly weak US inflation data earlier this week prompted investors to cut their bets on an immediate tightening of policy by the Federal Reserve. US producer price index data released Wednesday showed that factory inflation fell 0.3% month-on-month in June, down from 0.6% in May and below market expectations of 0%. The data followed a further contraction in the consumer price index, which recorded its largest monthly drop in nearly six years in June. These data suggested a potentially weaker Personal Consumption Expenditures (PCE) price index report, prompting investors to effectively rule out a July rate hike by the Federal Reserve and reduce expectations of monetary tightening in September, leading to a broad decline in the US dollar. On the other hand, the Australian dollar showed resilience in its declining consumer inflation expectations, which fell from 5.5% in June to 4.7% in July, the lowest level since January. These data did not eliminate market concerns about the Reserve Bank of Australia's monetary policy outlook, but neither did they weaken the bullish trend of the Australian dollar.
Last week, the Australian dollar against the US dollar rebounded and then consolidated at higher levels. After a sustained rise from the lows, approaching the resistance level of 0.7021 (last week's high), the bullish momentum slowed, and the pair entered a range-bound trading pattern. The daily chart maintains its position within a short-term upward channel, without any clear trend breakout signal, indicating an overall neutral-to-bullish bias. However, strong resistance above limits the bulls' ability to sustain a breakout. The exchange rate has stabilized above short-term moving averages, but continues to face resistance at the 100-day simple moving average (SMA) at 0.7062. The 14-day RSI is stable around 54, in a neutral range, neither overbought nor oversold, indicating a period of consolidation. The MACD remains above the zero line, with the red bars slightly contracting, suggesting a weakening of bullish momentum. The ADX (Advanced Directional Movement Index) reading of around 31 indicates that the overall trend remains active, but the latest rebound lacks strong momentum to challenge the moving average cluster above.
On the daily chart, the Australian dollar is trading around 0.70 against the US dollar, continuing to trade below the 50-day SMA at 0.7053 and the 100-day SMA at 0.7062. Although the 200-day SMA at 0.6884 provides support, the Australian dollar remains constructive overall, but the upward path has become more difficult. Holding above this level would maintain the broader bullish structure, but a convincing break above 0.7000 would likely require sustained declines in US inflation, a more dovish stance from the Federal Reserve, or a significant improvement in global risk appetite. On the upside, initial resistance lies at the 50-day moving average at 0.7053 and the 100-day simple moving average at 0.7062, forming a dense resistance zone slightly above the current price; higher resistance is seen at 0.7200 (psychological level) and 0.7198 (May 29-month simple moving average). Immediate support is at the horizontal support level of 0.6900 (psychological level), with the 200-day simple moving average at 0.6884 serving as broader trend support, while deeper support lies at the 0.6800 level.
Consider going long on the Australian dollar at 0.6970 today, with a stop loss at 0.6960 and targets at 0.7000 and 0.7010.
GBP/USD
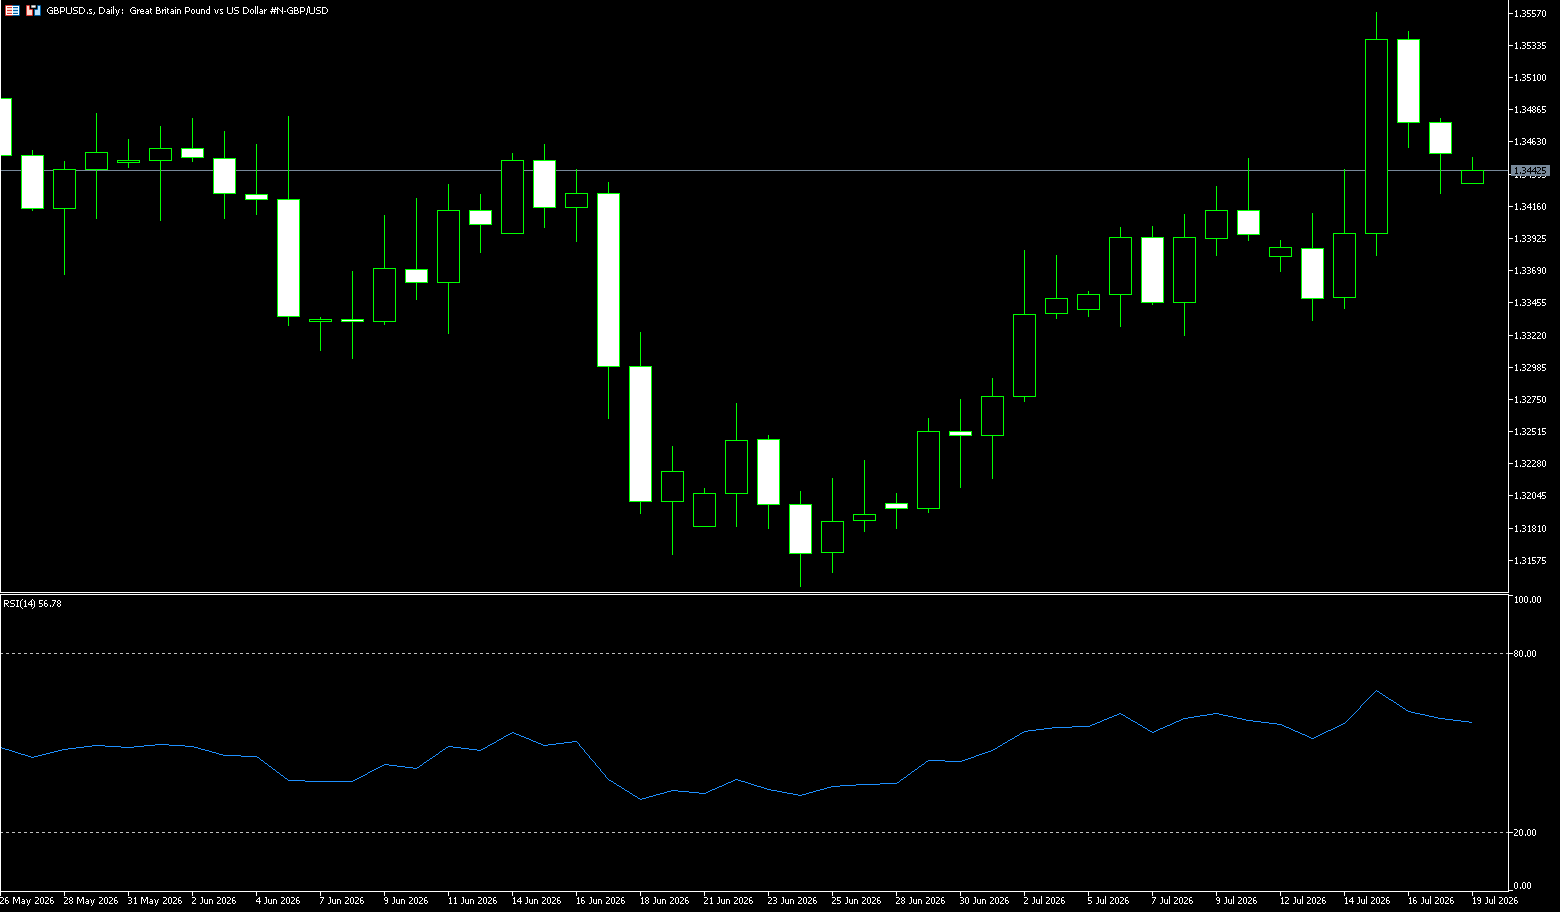
Last week, the pound retreated to around 1.3450 after reaching a two-month high of $1.3558 earlier this week, but is still poised for gains against the dollar this week. The market has largely priced in Andy Burnham's expected confirmation as Labour leader today, and attention is now focused on his chosen Chancellor. Reports that Mahmoud is the leading candidate have reassured investors, easing concerns about a more expansionary fiscal policy under Ed Miliband. Meanwhile, escalating tensions in the Middle East have pushed oil prices to a one-month high, reinforcing market expectations that the Bank of England will continue to tighten monetary policy. The market now fully anticipates a rate hike in November and expects another hike by March 2027. UK GDP grew 0.1% in May, after contracting 0.1% in April, bringing the three-month total to 0.7%, exceeding the expected 0.5%.
The UK is currently in a leadership transition phase, with Andy Burnham expected to succeed Keir Starmer. Markets are currently focused on the new Chancellor of the Exchequer and their policy stance, with some of the pound's gains stemming from expectations of continued fiscal discipline. Therefore, the pound currently faces two opposing fiscal transmission paths. If policy emphasizes spending constraints and the credibility of the medium-term budget, the pound may continue to benefit from reduced risk premiums; however, if fiscal expansion exacerbates inflation and debt pressures, even further tightening by the Bank of England may not necessarily benefit the exchange rate. In the coming weeks, fiscal credibility may gradually replace monthly economic growth as a key variable in pound pricing.
The pound/dollar exchange rate last week exhibited a three-stage pattern: initial low-level consolidation, a sharp mid-week rally, and a high-level pullback in the latter half of the week. The daily chart shows a generally bullish bias with short-term overbought conditions and potential downward pressure. Last week, the currency pair rallied and held above its medium- and long-term moving averages (including the 50-day moving average at 1.3380 and the 200-day moving average at 1.3399), maintaining its medium-term upward structure. The MACD indicator is above the zero line, with the fast and slow lines turning downwards and the red bars shortening, indicating a significant weakening of bullish momentum, but no death cross has formed. The RSI (14) previously surged to overbought 72, but has now fallen back to 55, placing it in a neutral range without extreme oversold conditions, suggesting further downside potential.
The daily technical chart shows that the GBP/USD pair has been recovering from 1.3140 (the low of June 24th), successively recovering the 20-day moving average of 1.3333 and the previous consolidation platform, with the latest recent high at 1.3558. The short-term deviation from the average has widened significantly. After the previous high of 1.3460 was broken, some trend-following funds and stop-loss orders may have been released in a concentrated manner, causing the upward speed to outpace the improvement in fundamentals. The current area between 1.3558 (last week's high) and 1.3600 (a psychological level) is not only a technical resistance zone but also a confluence of pricing factors including interest rate expectations, fiscal expectations, and a weakening dollar. A decisive break above this area would target 1.3653 (the May 11 high). Meanwhile, initial support lies at 1.3400 (the psychological level) and 1.3399 (the 200-day moving average). This level, previously trendline resistance, has now become support. A break below this level would see support at the 20-day moving average around 1.3333, followed by the 1.3300 level.
Today, consider going long on GBP at 1.3438, with a stop-loss at 1.3426 and targets at 1.3480 and 1.3490.
USD/JPY
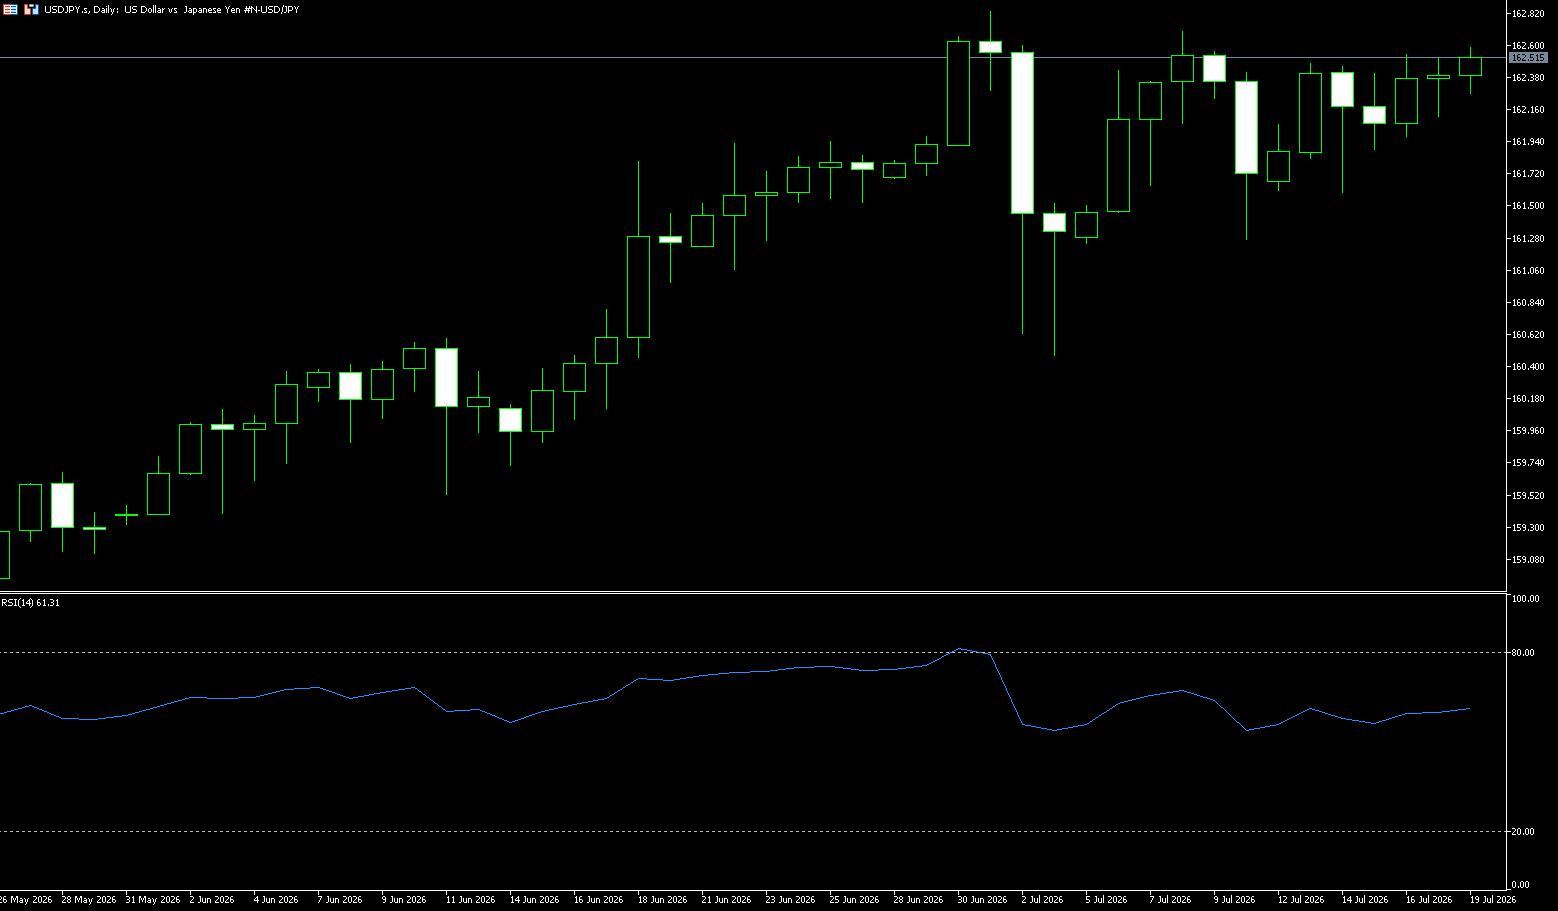
The USD/JPY pair traded in a narrow range around 162 per dollar last week, supported by a weaker dollar after lower-than-expected US inflation data eased concerns about an impending Fed rate hike. However, the outlook remains uncertain amid escalating geopolitical tensions in the Middle East, with oil prices rising following additional US strikes against Iran and the reinstatement of the blockade of Tehran in the Strait of Hormuz. In Japan, data showed a larger-than-expected decline in machinery orders in May, highlighting broad-based weakness in business investment. Despite a slight rebound, the yen remains near 40-year lows as Tokyo lacks concrete measures to bolster the currency. A recent report also noted that Japan has no immediate plans to adjust the asset allocation of its national pension fund, reducing expectations for short-term support for domestic assets.
The USD/JPY pair traded in a narrow range between 161.60 and 162.50 last week, with the latest price action showing a series of lower highs and higher lows, forming a triangle pattern. Last week's US data weakened market expectations for an immediate rate cut by the Federal Reserve, causing the dollar to weaken moderately against major currency pairs. The unexpected contraction in the US Producer Price Index (PPI) in June confirmed the deflationary trend reflected in Tuesday's consumer inflation data, almost confirming that the Fed will maintain its monetary policy unchanged at its July meeting. However, yen bulls remained subdued due to investor caution regarding the war with Iran, which pushed up oil prices, and growing doubts about the Japanese Ministry of Finance's plan to repatriate pension fund investments.
The current USD/JPY pair pattern is a high-level consolidation, with a healthy medium-term bullish structure but weakening short-term upward momentum. Bulls and bears are repeatedly battling around the 162 level; strong resistance is evident above, while moving averages provide support below, representing a technical consolidation within an uptrend. The pair tested the 162.70–162.84 level (near a 40-year high) during the week, but failed to break through effectively, subsequently fluctuating downwards, with prices continuing to oscillate within the 161.60–162.50 range. The USD/JPY pair saw a significant upper shadow on its weekly high, making it difficult for bulls to sustain the rally; continued verbal warnings from Japanese officials and profit-taking limited upside potential; the USD/JPY interest rate differential provided support, and a sharp decline lacked momentum, resulting in a volatile pattern with resistance above and support below. In terms of moving averages, the pair is steadily trading above the 20-day, 50-day, and 200-day moving averages, indicating no reversal signal in the medium- to long-term uptrend; the 20-day moving average (161.80–162.00) is the strongest support level this week.
The MACD indicator is showing initial signs of a weak death cross, indicating a slowdown in upward momentum and a period of consolidation for the bulls, not a trend reversal. The RSI (14): has fallen from the previous overbought zone to the 50-60 neutral-to-strong zone, releasing overbought pressure and lacking short-term upward momentum. Currently, the USD/JPY pair is lower around 162.10, holding above the 20-day exponential moving average (EMA) at 161.98, indicating a consolidation trend. The formation of an ascending triangle chart pattern also reflects a sharp contraction in volatility. The bottom of the triangle is at 161.90, with the next target below being the 161.30 area, where the July 10 low is located, and the bearish target of the triangle pattern at 160.49 (the July 3 low). On the upside, the top of the triangle and the highs of July 13 and 15, located between 162.40 and 162.50, are approaching the 40-year high of 162.84. Further up, the 127.2% Fibonacci retracement level of the early July pullback at 163.50 becomes a reasonable target.
Consider shorting the US dollar at 162.55 today, with a stop loss at 162.70 and targets at 161.70 and 161.60.
EUR/USD
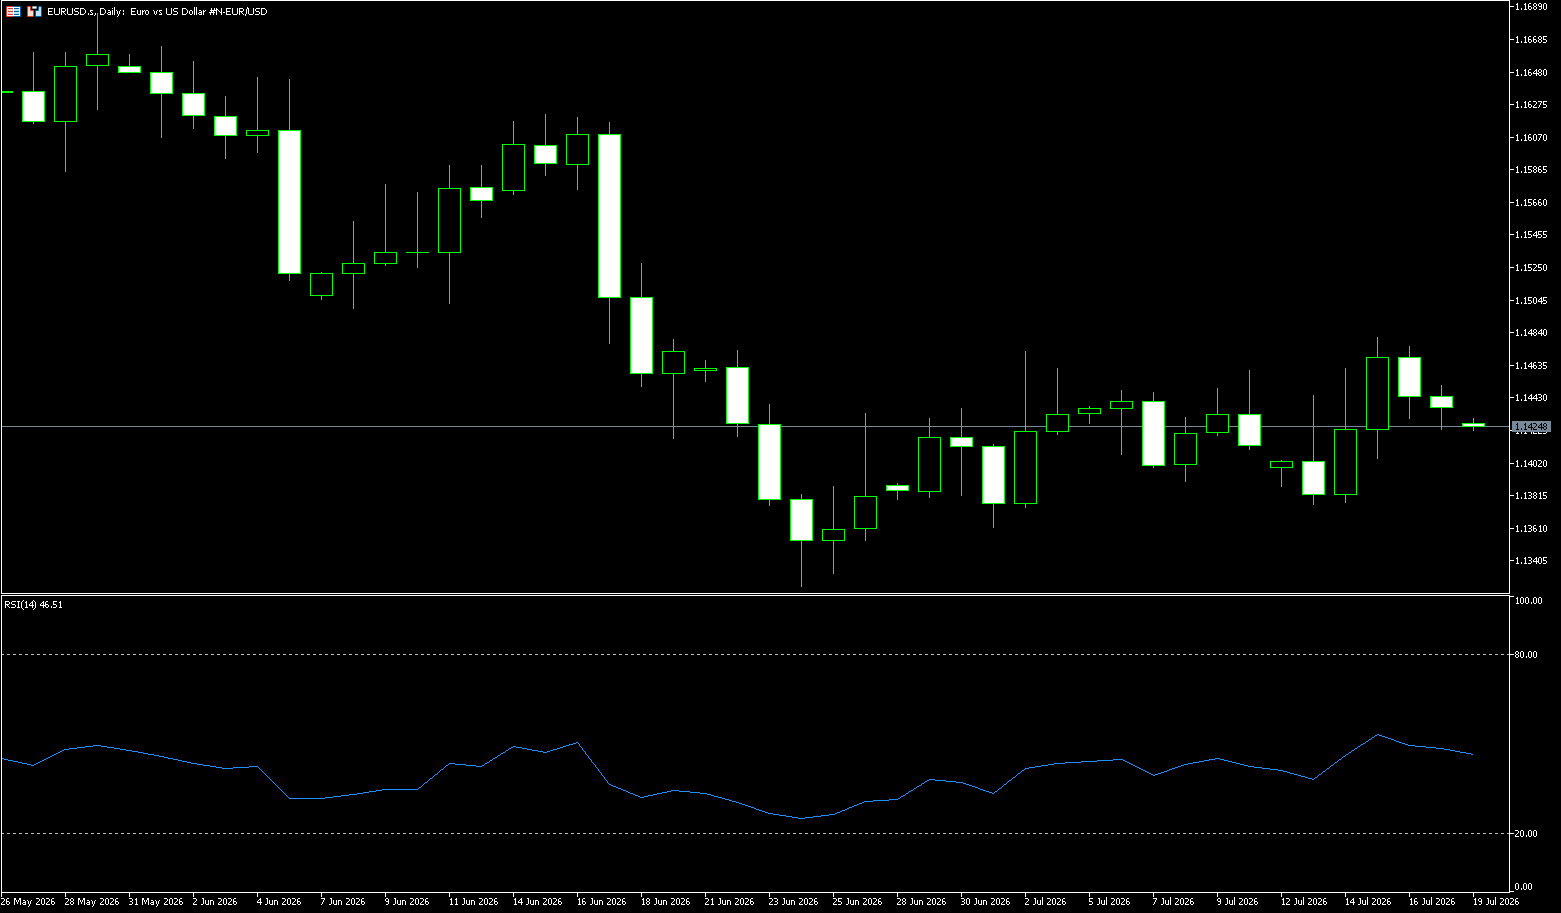
The euro traded largely flat against the dollar last week, hovering around $1.1440, near its strongest level since June 19, and is poised for gains against the dollar this week. Expectations of further tightening by the European Central Bank (ECB) continue to support the currency, while investors are also watching escalating tensions in the Middle East following additional US strikes against Iranian targets. The market fully expects the ECB to raise interest rates in September and anticipates another rate hike by the spring of 2027. However, recent comments from policymakers, including Piero Cipolone and Martin Koch, suggest a cautious approach, making a July rate hike unlikely. Meanwhile, the dollar weakened this week due to weaker-than-expected US inflation data, with producer prices unexpectedly falling in June and consumer prices experiencing their first monthly decline since 2020, reducing expectations for further tightening by the Federal Reserve this year.
Reuters reported that Iran earlier in the day demanded that the Houthi rebels in Yemen prepare to shut down Red Sea oil shipping routes if the US attacks Iranian power infrastructure. Iran's threat was a response to comments made by US President Donald Trump during an interview with Fox News. Trump stated that if Iran does not come to the negotiating table, military forces will be authorized to attack Iranian bridges and power plants. Further disruptions to global energy supplies will squeeze already low global oil supplies, potentially exacerbating concerns about high global inflation. Regarding monetary policy, given the Eurozone's concerns about a second round of inflation, the European Central Bank (ECB) is expected to raise interest rates further. ECB Governing Council member and Bundesbank President Joachim Nagel stated earlier this week that the central bank is closely monitoring the situation in the Middle East, while warning that policymakers will act decisively if necessary.
This week's technical movement of the euro against the US dollar clearly exhibits the characteristics of "the medium-term downtrend remains unchanged, while the short-term consolidation pattern continues"—from the long-term daily chart to the short-term technical chart. From a technical perspective, last week the exchange rate fluctuated within a range of 1.1370-1.1500, with the short-term equilibrium point around 1.1430; the key medium- to long-term resistance is anchored at 1.1500, and a decisive break above this level is needed to reverse the medium-term bearish trend. From a medium- to long-term perspective on the daily chart, the exchange rate continues to trade below key moving averages: on one hand, the price is significantly lower than the 200-day simple moving average at 1.1640, which serves as a watershed for the medium- to long-term trend, and the more sensitive 50-day exponential moving average (50-day), which is currently trading at 1.1530 and is a key resistance level for the exchange rate. On the daily chart, the MACD indicates that the underlying technical momentum of the medium-term downtrend has not been significantly weakened by the short-term rebound. The 14-period RSI reading has consistently fluctuated within the 45-50 range, indicating a typical neutral zone: there is still significant room before reaching the typical overbought zone below 70.
Considering the correlation between the full-cycle technical indicators and the actual price movement, the EUR/USD exchange rate this week exhibited typical "range-bound oscillation, balance between bulls and bears" technical characteristics. Its operating logic can be summarized as "repeatedly changing hands within a range formed by short-term support and resistance levels, while the medium-term trend awaits a new technical breakout signal." From a trend perspective, signals from multiple timeframe technical indicators are highly consistent: the continued bearish alignment of medium- and long-term moving averages clearly points to a medium-term downtrend; the exchange rate has experienced a short-term oversold rebound, but the rebound has been limited and has failed to break through key technical resistance levels. The first core resistance zone is 1.1480 (last week's high) - 1.1500 (psychological level). This zone is the core support platform for short-term price fluctuations. The second core resistance zone is 1.1574 (65-day simple moving average) - 1.1600 (psychological level). Key support levels are at 1.1400 and 1.1377 (last week's low); followed by 1.1325-1.1329. This range is a key observation level for the medium-term trend.
Consider going long on Euro at 1.1430 today, with a stop loss at 1.1420 and targets at 1.1490 and 1.1480.
Stock Analysis:
Australian ASX 200 Stock Index
Basic Market Overview:
The Australian ASX 200 index fell 58 points, or 0.7%, to close at 8,783 on Friday, pressured by a sharp decline in US stock index futures after chip stocks plunged on Wall Street on Thursday, ending a strong rally earlier this year. Escalating tensions in the Middle East and reduced shipping traffic in the Strait of Hormuz further fueled cautious sentiment. The local benchmark index rebounded from a lackluster performance in the previous session, ending the week down 0.3% and marking its second consecutive weekly decline. Traders are cautiously preparing for next week's Australian labor data, with the unemployment rate remaining near a four-year high despite May's employment growth hitting a five-month high.
Technology, non-energy minerals, manufacturing, and consumer non-durable goods led the decline. Mining stocks fell 2.9%, with BHP Billiton and Rio Tinto declining 2.9% and 2.5% respectively, while gold stocks Evolution Mining (-4.2%) and Northern Star (-4.0%) also exerted pressure. The four major bank stocks fell between 0.2% and 1.1%. Energy stocks bucked the trend, with Woodsside Energy rising 2.9% and Santos Energy rising 1.7%.
Sector Performance:
The market closed down approximately 0.1% to 0.3% for the week, weakening for the second consecutive week; defensive and oil and gas sectors strengthened across the board, while resource mining and technology sectors significantly dragged down the index.
Top Performing Sectors This Week (from strongest to weakest):
1. Utilities (+1.77%)
Core Logic: Safe-haven funds flocked to high-dividend defensive assets, and a slight decline in inflation expectations boosted utilities valuations; leading power and water companies continued to attract investment during the week.
Representative Stocks: AusNet Services, Spark Infrastructure.
2. Energy (+1.66%, strongest cyclical sector this week)
Core drivers: Tensions in the Middle East and shipping risks in the Strait of Hormuz pushed up international crude oil prices, leading to upward revisions in profit expectations for oil and gas companies.
Leading performers: Woodside Energy rose nearly 3% this week, while Santos and Karoon Energy also saw significant gains.
3. Communication Services (+1.62%)
High-dividend defensive attributes attracted funds, with Telstra and media real estate REA Group continuing to strengthen throughout the week, surging on Thursday and Friday.
4. Consumer Staples (+1.06%)
Supermarkets, food, and other essential defensive sectors rebounded after a decline; Coles and Woolworths outperformed the market, with easing inflation benefiting retail profit margins.
5. Real Estate REITs (+0.99%)
Rising expectations of interest rate cuts led to a slight increase in interest rate-sensitive REITs, with warehousing and industrial REITs outperforming retail real estate.
This Week's Leading Declining Sectors (from largest to smallest decline):
1. Raw Materials / Non-Energy Minerals (-2.91%, biggest drag for the week)
Multiple negative factors combined: weakening copper and gold prices; BHP lowered its copper production guidance; weak demand expectations for Chinese commodities.
• Iron ore leaders: BHP fell 2.9% this week, Rio Tinto fell 2.5%
• Gold mining companies plummeted: Evolution Mining -4.2%, Northern Star -4.0%, the gold index fell 5% in a single week.
2. Information Technology (-1.60%)
A sharp pullback in US tech stocks on Thursday dragged down Australian software stocks; Xero and WiseTech Global continued to be under pressure, and cloud services and data center stocks collectively weakened.
3. Healthcare (-0.34%)
Profit-taking occurred after significant gains in the previous period, with leading stocks such as CSL and Pro Medicus retreating, and biotechnology stocks underperforming the broader market.
4. Financials (-0.10%)
The four major banks weakened amid fluctuations, with expectations of interest rate cuts suppressing net interest margin expectations; only a few securities firms and credit stocks experienced periodic upward movements.
Technical Analysis:
ASX200 current closing benchmark: 8783 (closing price on Friday, July 17th); daily chart shows range-bound trading, weekly chart is neutral to slightly weak, volatility has increased slightly, and there is no overall unidirectional trend; the strategy is mainly to buy low and sell high. In terms of pattern, after two consecutive weeks of consolidation with closing lower, it is likely to continue range-bound trading next week, and a breakout is needed to establish a unidirectional trend; regarding volatility: next week's predicted volatility is 11.24%, with a slight increase in volatility, and stop-loss levels need to be appropriately widened. Technical indicators: RSI (daily chart, around 45): Neutral range, no overbought or oversold conditions; a break above 50 indicates bullish dominance, a break below 40 indicates bearish dominance; MACD: The green bars below the zero line are slightly converging, bearish momentum is weakening but has not yet turned bullish, and the upside potential is limited before a golden cross appears. In the short term, the 5-day and 20-day moving averages are turning downwards, with the price under pressure below these moving averages; the 50-day moving average at 8710 forms strong dynamic support; the 200-day moving average at 8400 is the long-term bull/bear dividing line, and the medium-term trend remains upward.
Trading Strategies:
The following are technical trading ideas only and do not constitute investment advice. Leveraged trading may result in losses exceeding the principal.
Practical Trading Strategies by Direction (Applicable to Short-Term Intraday/Swing Trading)
(I) Long Position Strategy (Buy on Dips, Only Participate in Support Zones)
1. First Long Range (Conservative)
Entry: 8750–8760, buy in batches after stabilization and a positive close
Stop Loss: Below 8730 (30-point stop loss, control risk)
First Take Profit: 8840 (Reduce position by 50%)
Second Take Profit: 8900–8920 (Exit all positions)
2. Extreme Dips (Playing the Deep Fall Rebound)
Entry: 8700–8720, a bottoming candlestick pattern (long lower shadow, bullish engulfing) appears at the support zone
Stop Loss: 8680
Target: 8820–8860 Additional Rules for Long Positions
• If the opening price directly rises above... • At 8860, do not chase the price higher; consider entering with a small position after a pullback to around 8840.
• If the price rises rapidly to above 8900 in a single day, do not linger; take profits and exit the market, being wary of a pullback after the initial surge.
(II) Short Selling Strategy (Sell after encountering resistance at the resistance zone, do not chase the decline)
1. First Short Selling Range (Conservative)
Entry: 8840–8860. Enter short positions in batches after encountering resistance and a bearish candlestick.
Stop Loss: Above 8885 (25–30 points stop loss)
First Take Profit: 8760 (Reduce position by half)
Second Take Profit: 8720 (Exit all positions)
2. Breakout Shorting (Extreme Market Conditions)
If a confirmed break below 8700 and the closing price is below it, enter short positions on a rebound to around 8720.
Stop Loss: 8755
Target: 8660 → 8640
(III) Dealing with a Directional Market (Applicable Most of the Time)
1. Short-term, quick entry and exit within the range; do not hold overnight positions with heavy leverage.
2. Only go long below 8730; only go short above 8860.
3. Enter near the middle of 8800. Remain on the sidelines and do not open new positions.
Key Risk Warning:
ASX200 Comprehensive Risk Warning for Next Week (July 20-27)
Data is for reference only and does not constitute investment advice; the ASX200 Financials + Resources sectors account for over 50% of the index, resulting in a strong amplification effect on volatility. Next week, multiple negative factors will converge, with downside risks outweighing upside opportunities.
Key Overseas Macroeconomic Risks (Determining the Overall Direction of the Index)
Fed July Interest Rate Decision (Wednesday morning)
Simultaneous release of US Q2 GDP and core PCE inflation: Stronger-than-expected data will reinforce the narrative of continued high interest rates, putting pressure on global risk assets.
Middle East Geopolitical Black Swan (Persistent High Risk)
The Strait of Hormuz conflict remains unresolved, and the US-Iran standoff continues.
Impact of Chinese Economic Data (Australia's Largest Trading Partner): Next week, China's Q2 GDP and June industrial/real estate/trade data will be released.
Dow Jones Industrial Average
Basic Market Overview:
US stock indices closed lower on Friday due to a new round of sell-offs by chipmakers and renewed geopolitical tensions. The S&P 500 fell 1%, the Nasdaq fell 1.5%, and the Dow Jones fell 407 points. Semiconductor manufacturers plunged on concerns that AI hyperscale companies might scale back investment in AI infrastructure, partially reversing this year's gains. Concerns about weak capital spending were also exacerbated by improvements in Chinese AI models, including the release of Moonshot's latest Kimi. Nvidia fell 2.2%, Broadcom fell 1%, AMD fell 1%, and Intel fell 2%.
Meanwhile, inflation risks intensified as the Middle East war continued and fuel prices rose. Economic headwinds were also amplified by US President Trump's claim that China interfered in the 2020 US presidential election, raising concerns about the sustainability of the trade truce reached after last year's tariff swaps. On the earnings front, Netflix fell 7.3% after forecasting another quarter of slowing sales.
Sector Performance:
Leading Sectors for Next Week + Dow Jones Component Stocks
Market funds continued to shift between high and low valuations, moving from overvalued AI technology stocks to low-volatility, high-dividend, and high-earnings blue-chip stocks. Defensive and pro-cyclical financial and industrial stocks strengthened.
1. Healthcare (Strongest Leading Sector)
Logic: Defensive attributes, stable healthcare spending, and generally better-than-expected Q2 pharmaceutical/medical device earnings; a top choice for safe-haven allocation.
Dow Jones Core Stocks:
• Johnson & Johnson (JNJ): High dividend yield, stable medical device business, high index weighting, strong support.
• UnitedHealth Group (UNH): Leading healthcare provider, upward revision of earnings guidance.
• Merck (MRK): New drug pipeline materializing, low valuation.
2. Large Financial Banks (Second Strongest Performer)
Logic: Moderate interest rate cut expectations, high net interest margins, generally better-than-expected bank earnings, high dividends attracting institutional funds.
Dow Jones Core Stocks:
• JPMorgan Chase (JPM), Goldman Sachs (GS): Stable investment banking and retail banking, high stock weighting, driving the index upward.
• Visa, American Express (AXP): Strong resilience in payment and consumption sectors, unaffected by significant interest rate fluctuations.
3. Consumer Staples (Resilient to Volatility, Buy on Dips)
Logic: Slowly cooling inflation, stable cash flow from essential consumer goods, safe-haven allocation.
Dow Jones Core Stocks: Coca-Cola (KO), Procter & Gamble (PG), Walmart (WMT)
4. Energy (Pulsating Strength)
Logic: Geopolitical conflicts support oil prices; Chevron, a single energy stock, experiences short-term surges in the index when oil prices rise.
Dow Jones Core Stock: Chevron (CVX)
Next Week's Leading Declining Sectors + Corresponding Dow Jones Component Stocks
1. Information Technology / Semiconductors (Core Leading Decline, Continued Pressure)
Logic: Lowered expectations for AI hardware capital expenditure; the Philadelphia Semiconductor Index has entered a technical bear market; valuation digestion continues; high-level tech stocks face significant selling pressure.
Dow Jones Industrial Average dragged down heavyweight stocks:
• Nvidia (NVDA): AI leader, high valuation, profit-taking by major players significantly dragged down the index.
• Microsoft (MSFT), Apple (AAPL): Divergent; Apple was relatively resilient, while Microsoft's cloud business growth slowed, putting pressure on the index.
• IBM, Cisco (CSCO): Weakening enterprise IT spending, weak elasticity, and continued weakening.
2. Consumer Discretionary (Weakening)
Logic: Pressure on disposable income, slowing demand for high-end consumption.
Dow Jones Core Stocks: Disney (DIS), Home Depot (HD), Nike (NKE)
3. Aviation Industry (Phase-wise Correction)
Logic: Marginal weakening of travel demand, fuel cost fluctuations suppressing profits.
Dow Jones Core Stock: Boeing (BA), the weakest stock in the industrial sector, negative for the index.
Technical Analysis:
Dow Jones Industrial Average Mid-Term Main Trend: The medium-to-long-term bullish trend remains intact. Since the low of 45063 in April, it has entered a standard upward channel. The weekly chart has continued to show higher highs and lower lows. The 5/20/50/200-week moving averages are all trending upwards, and the large-scale upward trend has not been broken. After touching a historical high of 53294 in early July, it entered a high-level consolidation. It has been fluctuating with decreasing volume for several weeks, which is a continuation adjustment in the upward trend, not a top and fall. Trading volume: The volume has been decreasing in the past week, and the selling pressure is limited. If the rebound increases and stands above 52800, the bullish funds will flow back. If the decline increases and breaks below 51860, the short-term correction will be deeper. Technical indicator MACD: The red bars above the zero axis on the daily chart are narrowing, and the bullish momentum is weakening. Next week will be mainly a period of consolidation and repair, and it is difficult for a one-sided big rise. As for RSI (14): It is currently at 56, in the neutral range. It touched 70 and encountered resistance and fell back. It fell to 45 and formed a short-term oversold rebound signal. Next week, the Dow Jones Industrial Average is expected to fluctuate with a slightly bullish bias and increased volatility. While the overall upward trend remains intact, short-term profit-taking pressure exists. The strategy is to prioritize buying on dips near support levels, and shorting at resistance levels with quick entries and exits, using strict moving average stop-loss orders. Key levels to watch are the 51860 level (a key support/resistance level) and the 53294 level (a previous high breakout signal). Earnings reports and US Treasury yields will be crucial catalysts for whether new highs can be reached.
Trading Strategy:
This information is for market analysis and reference only and does not constitute any trading or investment advice.
Swing Trading Long Position Strategy (Suitable for holding positions for 3-5 trading days)
Entry Conditions
1. Conservative Buy-on-Dips: Enter long positions in batches when the price retraces to the 51800-51420 support range, with a positive daily close and shrinking trading volume.
2. Aggressive Buy-on-Dips: Enter long positions on a breakout above 52800 with a small position if the price retraces to 52700 and holds.
Profit Targets
• First Profit Target: 53050-53100 (Reduce position by 50%)
• Second Profit Target: Previous high of 53294 (Reduce all position)
• Breakout Add-on Target: 53600
Stop-Loss Rules
• Unified Stop-Loss for Buy-on-Dips: Exit if the price breaks below 51400 (closing price/daily candlestick body breaks below this level).
• Short-Term Stop-Loss for Buy-on-Dips: Exit if the price breaks below 52450. Exit Strategy
Short-Term Short Selling Strategy (Short selling only within the trading range, not attempting to predict major tops)
Entry Conditions
Price rebounds to the 53000-53294 resistance zone, RSI rises to 70, a long upper shadow candlestick appears, and volume shrinks; consider a small short position.
Profit Targets
Take profit in two batches at 52450 / 51860.
Stop-Loss Rules
Unconditional stop-loss if the closing price breaks through 53400. Short selling is a short-term strategy; long-term holding of short positions is prohibited.
Risk Warnings:
A hawkish signal from the Federal Reserve and a significant rise in US Treasury yields will directly suppress blue-chip valuations;
Leading technology companies' earnings reports falling short of expectations may trigger a rapid index correction;
Sudden changes in geopolitical conflicts may disrupt oil prices and market risk appetite;
The Dow Jones is a price-weighted index; fluctuations in a single high-priced stock have a far greater impact on the index than those of a market capitalization-weighted index, making volatility prone to distortion.
Disclaimer: The information contained herein (1) is proprietary to BCR and/or its content providers; (2) may not be copied or distributed; (3) is not warranted to be accurate, complete or timely; and, (4) does not constitute advice or a recommendation by BCR or its content providers in respect of the investment in financial instruments. Neither BCR or its content providers are responsible for any damages or losses arising from any use of this information. Past performance is no guarantee of future results.
More Coverage





2026 © - All Rights Reserved by BCR Co Pty Ltd
Risk Disclosure:Derivatives are traded over-the-counter on margin, which means they carry a high level of risk and there is a possibility you could lose all of your investment. These products are not suitable for all investors. Please ensure you fully understand the risks and carefully consider your financial situation and trading experience before trading. Seek independent financial advice if necessary before opening an account with BCR.
BCR Co Pty Ltd (Company No. 1975046) is a company incorporated under the laws of the British Virgin Islands, with its registered office at Trident Chambers, Wickham’s Cay 1, Road Town, Tortola, British Virgin Islands, and is licensed and regulated by the British Virgin Islands Financial Services Commission under License No. SIBA/L/19/1122.
Open Bridge Limited (Company No. 16701394) is a company incorporated under the Companies Act 2006 and registered in England and Wales, with its registered address at Kemp House, 160 City Road, London, England, EC1V 2NX. Open Bridge Limited acts solely as a payment processor for BCR Co Pty Ltd and does not provide any financial, trading, or investment services on its behalf. Open Bridge Limited's role is limited to payment processing.


 English
 简体中文
简体中文
 繁體中文
繁體中文
 Bahasa
Melayu
Bahasa
Melayu
 Tiếng
Việt
Tiếng
Việt
 ไทย
ไทย
 日本語
日本語
 한국어
한국어
 ភាសាខ្មែរ
 español