


0
Currency & Commodity Analysis:
US Dollar Index
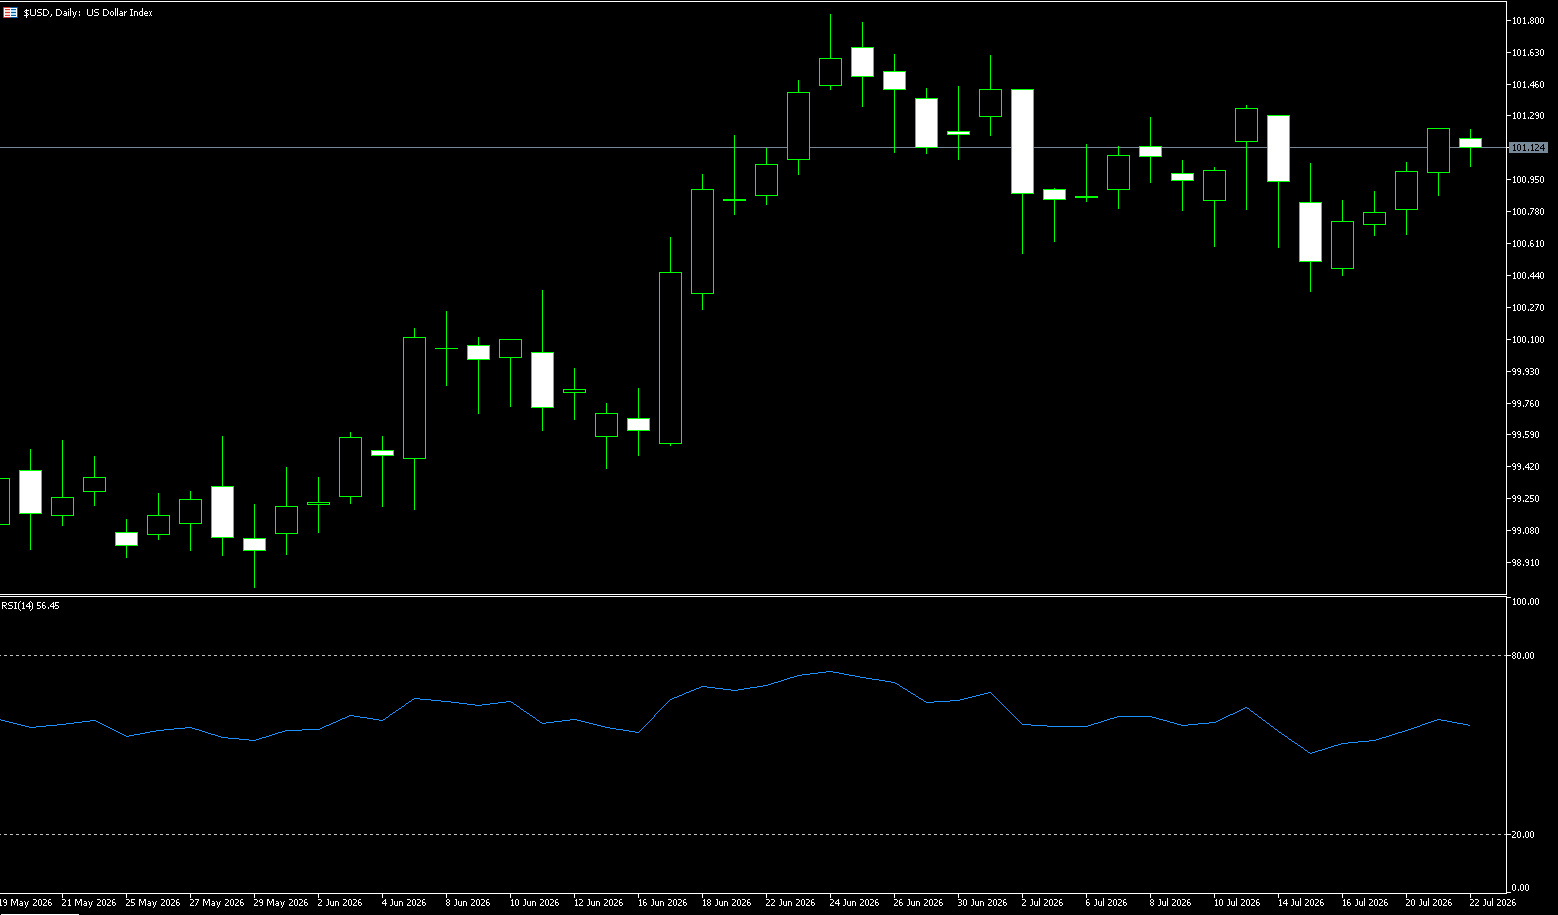
The US dollar index held above 101 on Wednesday, rising for the fourth consecutive trading day, supported by higher Treasury yields and rising oil prices, as the US conducted its eleventh consecutive night of airstrikes on Iranian targets. President Trump also downplayed the possibility of near-term talks with Tehran, while Iranian-backed Houthi rebels in Yemen disrupted shipping in the Red Sea. Meanwhile, a series of attacks on the Caspian Pipeline consortium terminal on Russia's Black Sea coast exacerbated supply concerns. On the economic front, ADP data showed that in the four weeks ending July 4, US private companies added an average of 16,500 jobs per week, down from an average of 19,250 jobs per week in the previous four weeks, marking the fourth consecutive slowdown in hiring. The market expects the Federal Reserve to keep interest rates unchanged at its meeting next week, while projecting a greater than 55% chance of a rate hike in September.
Currently, the dollar has not formed a typical one-sided safe-haven rally because several macroeconomic factors are offsetting each other. Escalating conflicts typically lead to increased liquidity demand, boosting the dollar's short-term safe-haven appeal. However, if oil prices continue to rise, US import costs and inflation expectations will also increase, further pushing up long-term interest rates and fiscal financing pressures. In this scenario, the dollar may initially be supported by yields, but subsequently constrained by real growth expectations and asset valuation adjustments. The dollar index is currently around 101.20, indicating that the market temporarily views geopolitical risks as a manageable disturbance rather than a global liquidity crisis. The Bollinger Bands in the chart are located at 101.06, representing that the trend direction has not yet been confirmed. The upper Bollinger Band at 101.51 is the recent rebound high, while 101.80 (the high on June 24th) corresponds to a stronger previous resistance area. Below, 100.75 (the 34-day moving average) and 100.36 (the recent monthly low) constitute a temporary low point. The price structure is closer to event-driven range compression than the start of a trend.
Today, consider shorting the US Dollar Index at 101.23, with a stop-loss at 101.35 and targets at 100.80 and 100.70.
WTI Spot Crude Oil
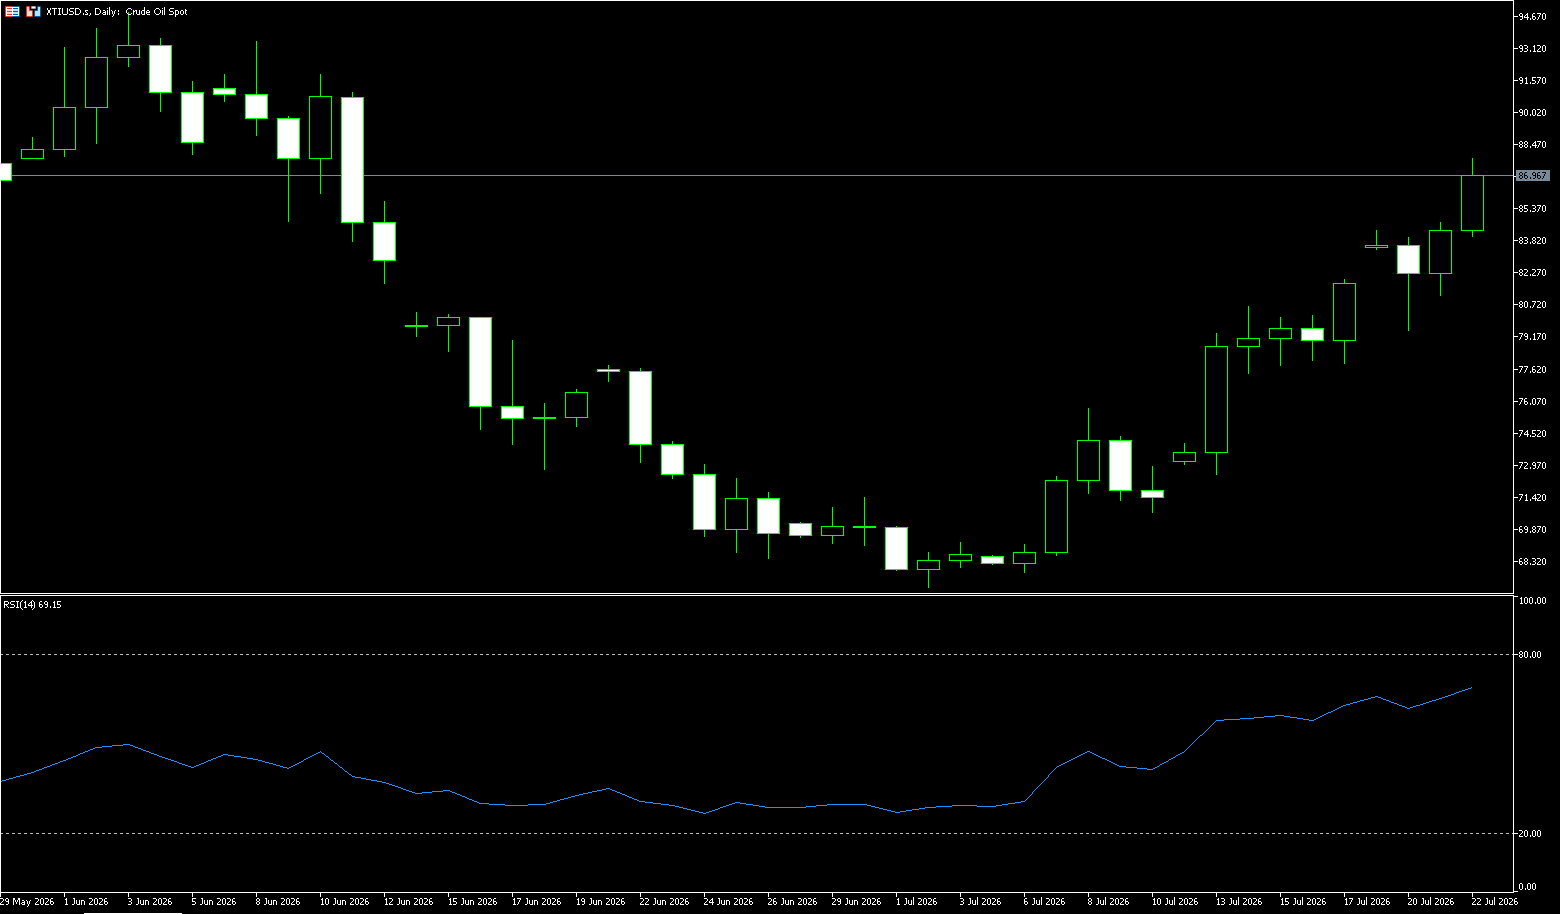
On Wednesday, US crude oil traded near $86.00 per barrel, after a nearly 3% rebound on Tuesday, as geopolitical tensions in the Middle East escalated sharply. A new round of mutual military strikes between the US and Iran, coupled with the Houthi rebels' declaration of a maritime embargo against Saudi Arabia in Yemen, fueled intense market anxiety about supply disruptions through the Strait of Hormuz and the Red Sea, vital global energy arteries. Brent crude also remained in technically overbought territory for the seventh consecutive trading day, the first time since June 2025, indicating extremely bullish sentiment, but not driven by existing spot shortages, but rather by anticipated panic. Attacks on Kuwaiti power generation and desalination facilities violently pushed WTI crude back above $84, completely shattering any brief glimmer of hope for a ceasefire. US long-term Treasury yields jumped, steepening the yield curve dramatically, reigniting inflation fears. The conflict is spilling over from military targets to civilian infrastructure in the Gulf, amplifying the tail risk of supply disruptions.
In the short term, oil prices will remain highly sensitive and asymmetric to geopolitical news. Any further attacks on civilian infrastructure could push Brent crude to higher levels, while ceasefire rumors will only trigger a brief sharp drop, with bullish sentiment dominating. Looking at the daily chart, WTI crude has rebounded steadily from around $67/barrel (the low on July 2nd), with the latest price around $85/barrel. Oil prices have reached the Bollinger Band at $84.90, indicating that the short-term upward slope exceeds the normal fluctuation range of the past month. The MACD indicator shows a strong trend correction, but the moving average system has not yet fully digested the previous low range. The $90.00 to $91.50/barrel area has become the short-term risk pricing center. On the downside, watch the 50-day moving average at $82.51. And the $80.00 (psychological level) area.
Consider going long on crude oil today at $86.00, with a stop loss at $85.80 and a target of $87.60. 88.00
Spot Gold
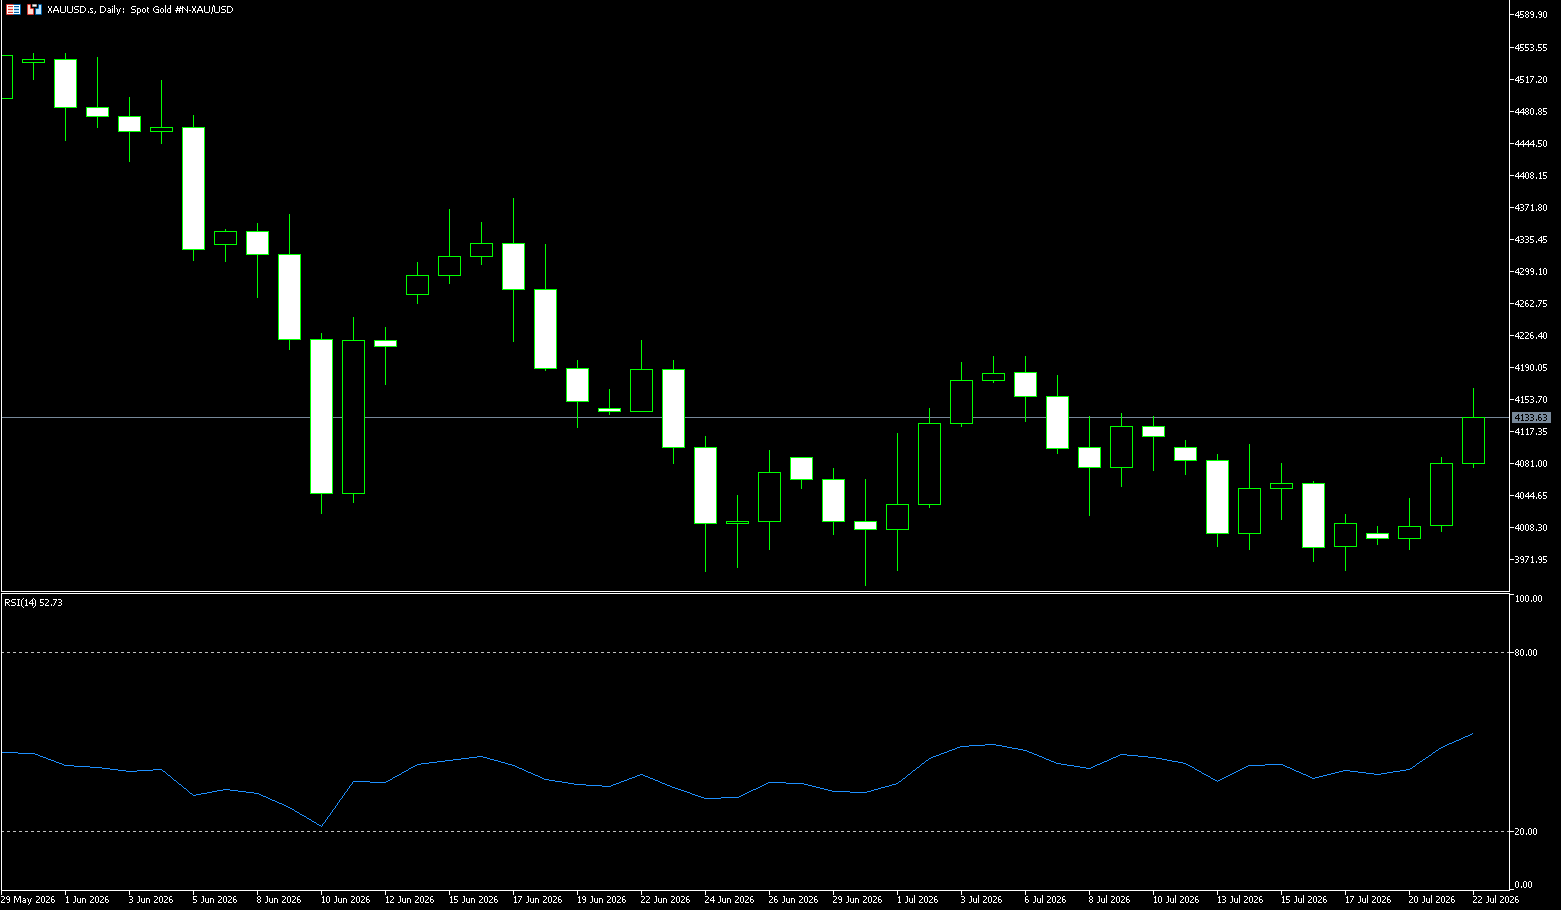
On July 22nd in early Asian trading, spot gold was trading around $4,130 per ounce, boosted by hawkish expectations from Federal Reserve officials and a resurgence in tariff-related safe-haven demand. Gold prices surged on Tuesday (July 21st), successfully breaking through the psychological level of $4,000, demonstrating a strong rebound, buoyed by expectations of diplomatic easing in the Middle East conflict. This rise not only reflects market optimism about a short-term easing of geopolitical risks but also highlights gold's unique appeal as a safe-haven asset in a complex macroeconomic environment. However, deep-seated uncertainties surrounding the conflict, inflationary pressures from rising oil prices, and the upcoming Federal Reserve policy meeting all add layers of uncertainty to gold's price movement. This surge in gold prices is mainly attributed to positive signals of a potential ceasefire in the Middle East. A possible ceasefire agreement in the Middle East has injected optimism into the commodity market, and gold, after breaking through the short-term downtrend line since July 6th, has further gained strong technical buying support.
For investors, the current gold market is characterized by "rising risk premiums but persistent policy pressure." Amidst escalating global uncertainty, gold will remain an indispensable part of portfolio allocation. Spot gold prices held above the $4000-$4021 support range, regaining above the 9-day moving average of $4046.50 and the 14-day moving average of $4075.30, with bulls regaining short-term technical advantage. The next upside target for bulls is to push gold prices above $4150; a successful break above this level would target $4181.50 (the 40-day moving average), with further upside potential at $4200.00 (the psychological level). The short-term downside target for bears is to push gold prices below $4021.28; a break below this level would target $4000 (a psychological level), followed by $3982 (Monday's low).
Consider going long on gold at $4130 today. Stop loss at 4,125; Target: 4,170; 4,180
AUD/USD
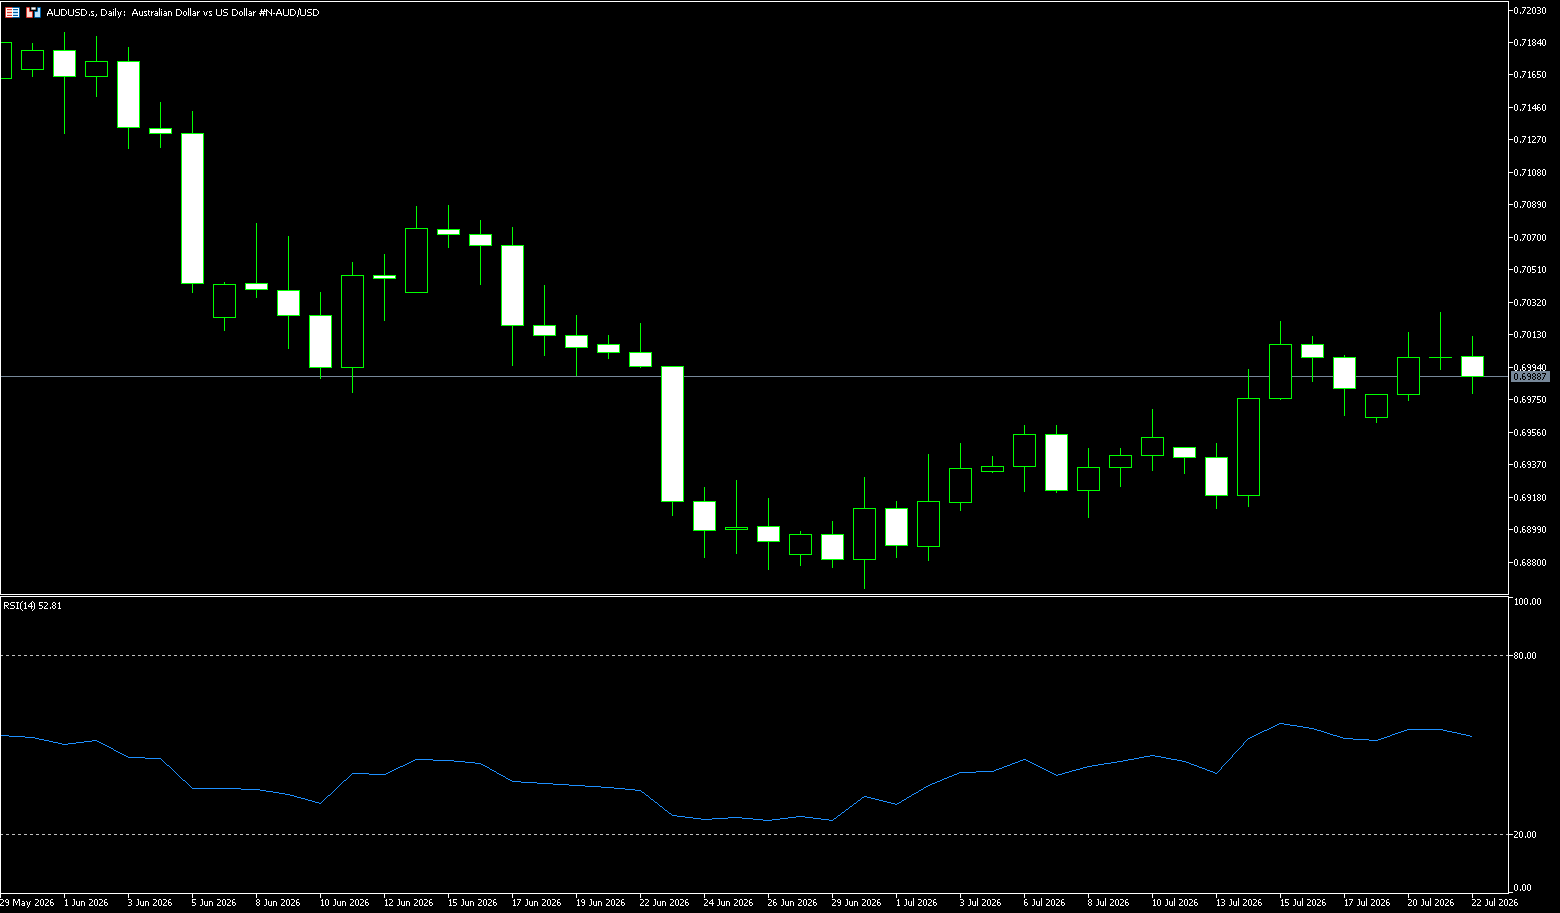
The Australian dollar climbed to around 0.7000 in early Asian trading on Wednesday. The Australian dollar strengthened against the US dollar as the likelihood of a rate hike by the Reserve Bank of Australia (RBA) increased. Australia's June employment report will be in focus later on Thursday. After three consecutive rate hikes totaling 25 basis points (bps) earlier this year, the RBA decided to keep the Official Cash Rate (OCR) unchanged at 4.35% at its June policy meeting. Nevertheless, the ongoing US-Iran conflict has raised concerns about energy-driven inflation. This has further fueled market speculation that the RBA will tighten policy further, providing support for the Australian dollar. Traders are awaiting the Australian June employment data to be released on Thursday. The market expects an increase of 15,000 jobs, while the unemployment rate is expected to remain stable at 4.4% for the second consecutive month. A stronger-than-expected report could push the Australian dollar higher against the US dollar. (Xinhua News Agency report) Escalating tensions in the Middle East could boost safe-haven flows, providing short-term support for the US dollar.
On the daily chart, the Australian dollar is trading at 0.6998 against the US dollar, continuing to trade below its 50-day and 100-day simple moving averages at 0.7033 and 0.7058 respectively. While momentum has improved somewhat, it still limits the pair's upside in the short term. The 14-day Relative Strength Index (RSI) is at 54, having risen back into neutral to positive territory, while the Average Directional Index (ADX) has fallen to around 24, suggesting a slight easing of the trend but still maintaining correlation. On the upside, immediate resistance is concentrated below the short-term 50-day and 100-day simple moving averages at the 0.7033 and 0.7058 levels, with further resistance at the 0.7100 level. Initial support is seen at the 0.6947 level (the 20-day simple moving average) and the 0.6888 level (the 200-day simple moving average), where strong support is expected.
Today, consider going long on the Australian dollar at 0.6985, with a stop-loss at 0.6975 and targets at 0.7030 and 0.7040.
GBP/USD
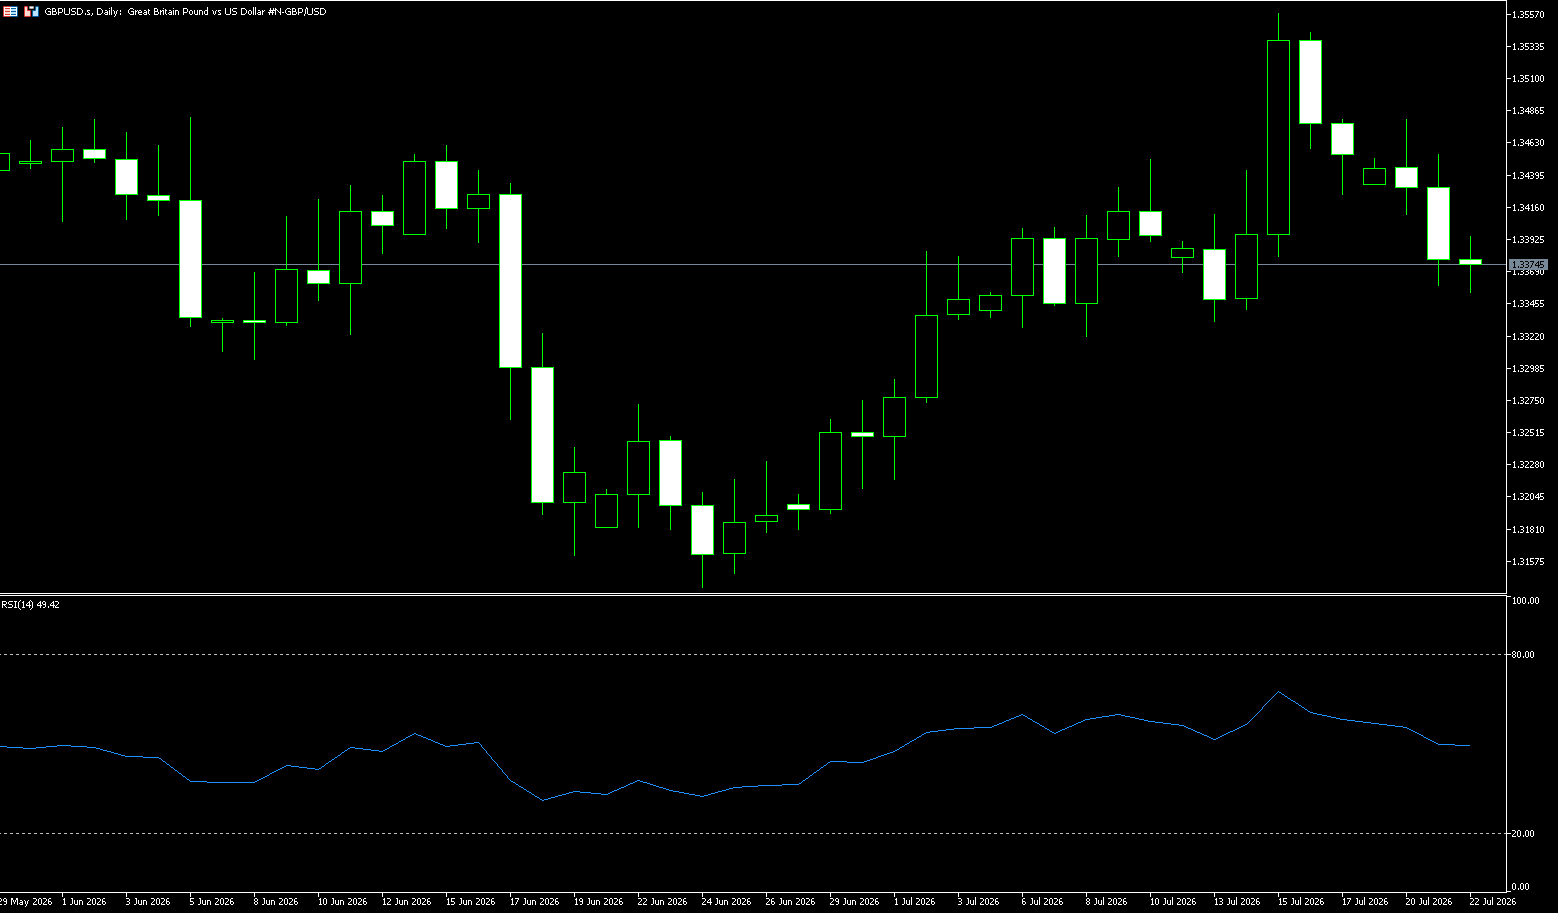
Data shows that the UK unemployment rate fell slightly to 4.9% from March to May this year, while the employment rate rose slightly to 75.1%. Overall, slower wage growth and weak job market expansion further confirm the continued easing of inflationary pressures in the UK, which will alleviate concerns about interest rate hikes by the Bank of England. However, it is worth noting that there are discrepancies in various employment survey data, and recent UK employment statistics have been flawed in quality. Therefore, the market should not rely solely on single-month data to make definitive judgments about the labor market and inflation trends. Newly appointed UK Prime Minister Andy Burnham recently launched his first batch of policy measures and appointed John Healy as Chancellor of the Exchequer yesterday. From a macroeconomic perspective, while this tax cut policy can slightly lower overall inflation and reduce the burden on residents, its scope and intensity are limited, and its effect on boosting the overall economy is relatively weak. The market will closely monitor the policy statements of the new UK government, with the November budget being a key event influencing the pound's performance.
The capital markets have shown a clear wait-and-see attitude and skepticism towards the new British government. Since the announcement of the appointments, the yield on the benchmark 10-year UK government bond has risen by 6 basis points, breaking through the key psychological level of 5% again. In terms of exchange rates, the pound sterling weakened during the day, ranking first among major global currencies in terms of decline. The pound fell by approximately 50 points against the dollar, officially breaking below the one-month-long uptrend line, indicating significant short-term pressure. Regarding support levels, the first short-term support for the pound against the dollar is the weekly low of 1.3350, with the core support level at the psychological level of 1.3300. Only a rebound and stabilization above 1.3455 (Tuesday's high) and a break above 1.3500 (the psychological level) can completely reverse the short-term bearish trend.
Today, consider going long on GBP at 1.3360, with a stop-loss at 1.3350 and targets at 1.3420 and 1.3430.
USD/JPY
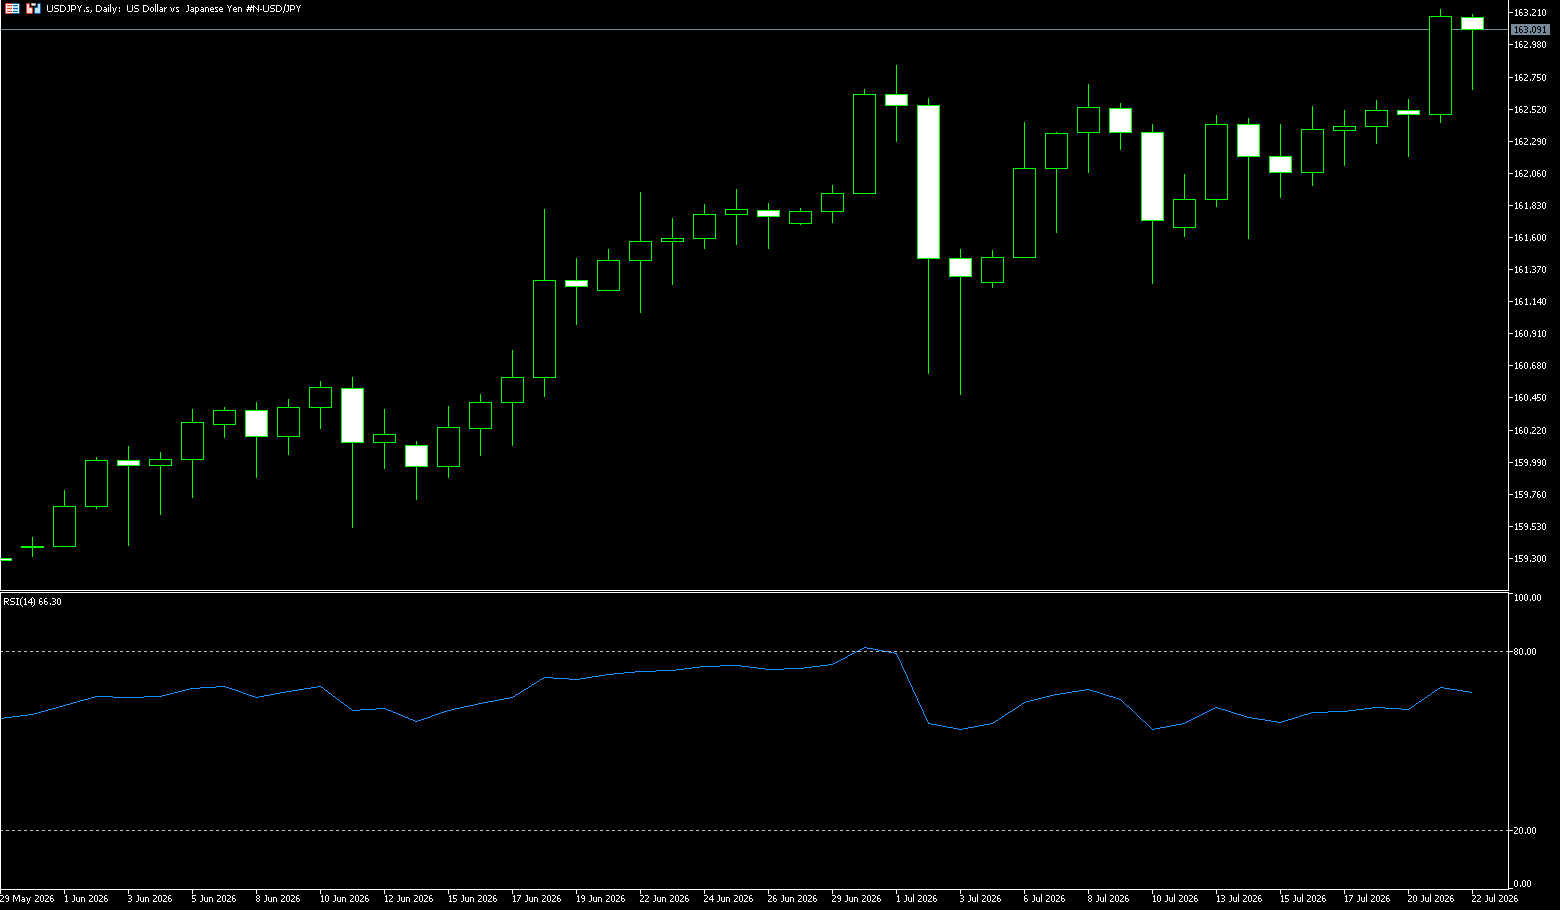
During Wednesday's Asian session, USD/JPY entered a bullish consolidation phase, holding steady above the 163.00 level, close to the previous day's high since 1986. However, traders remain highly cautious due to market speculation that Japanese authorities might intervene to support the currency. This, in turn, is seen as resistance for spot prices, although favorable fundamentals support the continuation of the recently established uptrend. Investors remain highly focused on the large interest rate differential between Japan and the US, which keeps so-called carry trades active and has been a key factor in the yen's relative underperformance. In addition, the economic risks from the ongoing conflict in the Middle East are also weakening the yen. On the other hand, the US dollar extended its gains from the past four trading days, providing additional support for the USD/JPY pair and validating its positive bias. Given that Japan relies on this crucial waterway for over 90% of its crude oil imports, developments related to the US and Iran have exacerbated concerns about the Japanese economy and benefited yen bears. Furthermore, energy-driven inflation risks have reinforced bets on a Fed rate hike, supporting the dollar and the USD/JPY pair.
No major US economic data is scheduled for Wednesday, and the dollar will be subject to speeches from influential FOMC members. In addition, further developments surrounding the US-Iran situation could continue to inject volatility into financial markets and drive the dollar's movement, providing some momentum for the USD/JPY pair. However, these factors suggest that the path of least resistance for spot prices remains upward.
The USD/JPY pair is trading at 163.20, holding a mildly bullish bias. The 14-day Relative Strength Index (RSI) median of 65 indicates robust but not excessive buying pressure. On the upside, the 127.2% Fibonacci retracement level from the early July pullback at 163.50 is immediate resistance; a break above this level would allow the pair to potentially test further upside, with 154.50 being a reasonable target. On the downside, the immediate support level is near the 162.71 (5-day moving average). A sustained break below this area would expose a deeper risk of a pullback, targeting the current uptrend starting point at 162.33 (14-day moving average).
Consider shorting the US dollar today at 163.30, with a stop-loss at 163.45 and targets at 162.70 and 162.60.
EUR/USD
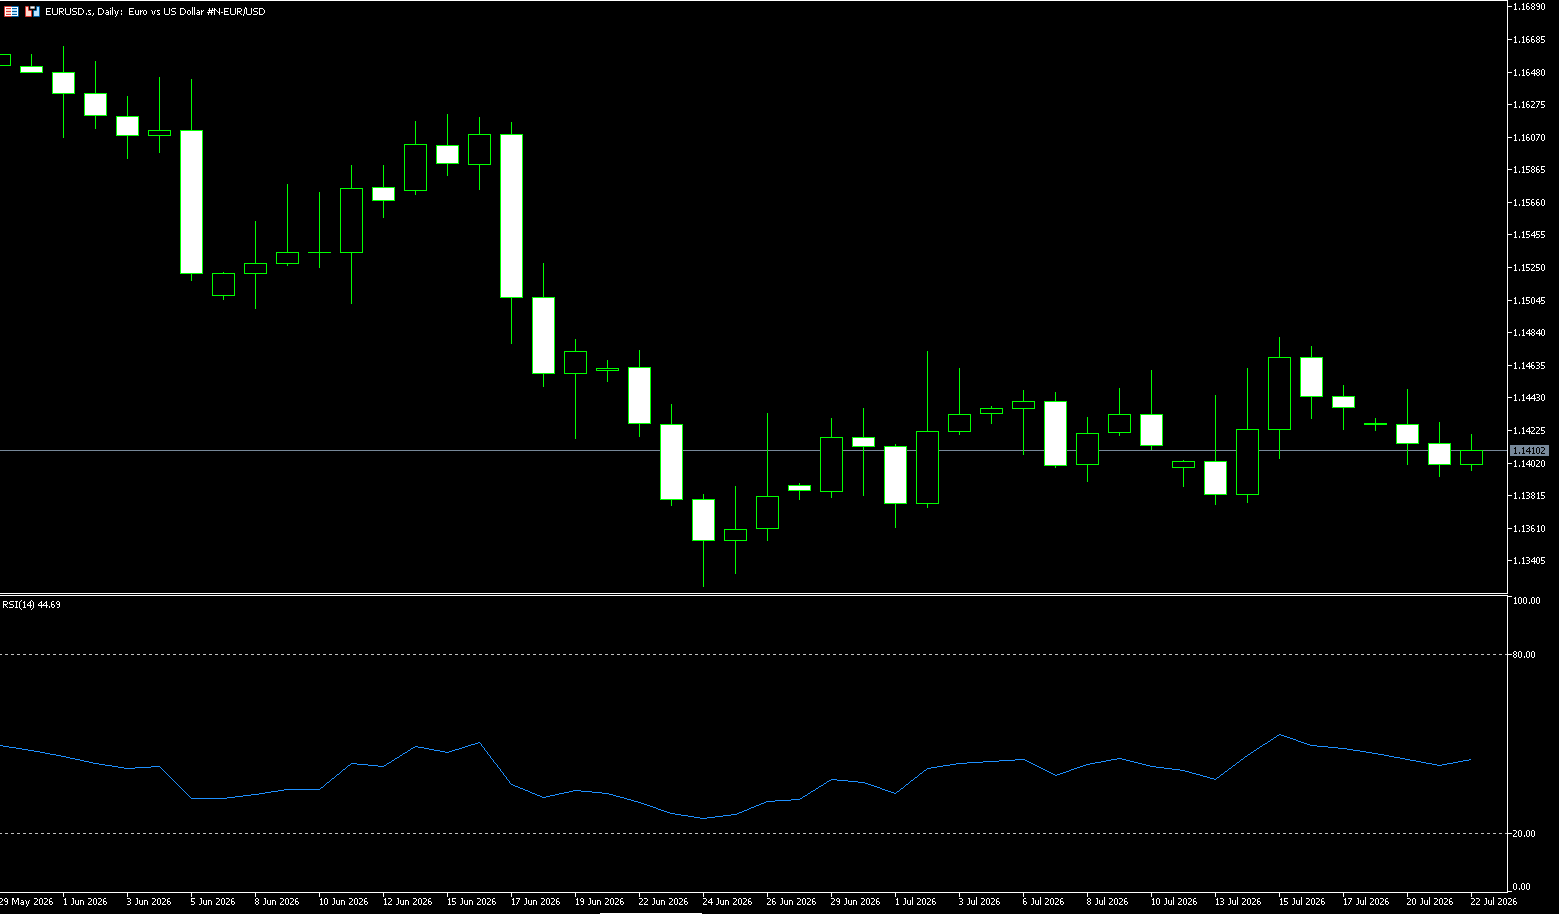
The euro/dollar pair rose slightly in early Asian trading on Wednesday, near 1.1410. The European Central Bank's hawkish tone provided some support for the euro against the dollar. Traders are awaiting the ECB's interest rate decision on Thursday. Earlier this week, European government bonds rose across the board as continued geopolitical oil shocks and lingering inflation threats prompted investors to price in a more hawkish path for ECB monetary policy. Meanwhile, US President Trump downplayed the possibility of immediate negotiations with Iran amid mutual attacks and Houthi threats to Red Sea shipping in Yemen. According to Xinhua News Agency, Iran's Supreme Joint Military Command stated that if the United States attacks Iranian nuclear facilities, Tehran will expand its strike range and target US and allied interests in the region. Escalating tensions in the Middle East could boost safe-haven currencies such as the US dollar, creating headwinds for this major currency pair in the short term.
Short-term interest rate markets showed signs of stabilization ahead of Thursday's European Central Bank decision, reinforcing the recent hawkish repricing, which provided fundamental support for the euro through yield spreads. From a technical perspective, the bank's stance remains "neutral"—the euro's technicals offer little momentum, as the 14-day Relative Strength Index (RSI) shows signs of stabilizing not far below the neutral 50 level. Recent price action has been confined to a narrow range of roughly 1.1380 to 1.1480, and the neutral stance is maintained unless there is a significant upward move towards 1.1500 and the 50-day moving average at 1.1516. A break below 1.1380 would target the 1.1325 area from June 24th and the psychological level of 1.1300.
Consider going long on the euro today at 1.1400, with a stop-loss at 1.1390 and targets at 1.1450 and 1.1460.
Stock Analysis:
Australian ASX 200 Stock Index
Basic Market Overview:
The ASX 200 rose 30 points, or 0.3%, to close at 8,823, driven by gains in mining, energy, and consumer stocks. Traders attempted to reverse recent weakness as market sentiment stabilized despite weaker U.S. stock index futures due to escalating tensions in the Middle East. President Trump downplayed the prospects for near-term negotiations following the U.S. military's 11th night of airstrikes against Iran on Tuesday. Locally, focus shifted to Australian labor data and the preliminary July Purchasing Managers' Index, scheduled for release on Thursday and Friday, respectively. Mining stocks rose 2.5%, supported by firm copper prices, strong Chinese demand, and declining inventories.
BHP Billiton rose 2.3%, and Rio Tinto rose 2.5%. Meanwhile, energy stocks rose 1.7%, led by Woodsside (1.3%) and St. Toth (1.0%). In addition, Evolution Mining surged 4.3%, and Northern Star rose 3.5%. Conversely, Lynas Rare Earth's share price fell 3.6%, hitting a five-month low, due to cost overruns in its Malaysian expansion project and lower-than-expected quarterly revenue.
Sector Performance:
The broader market closed down approximately 0.1% to 0.3% for the week, marking its second consecutive week of weakness. Defensive and oil & gas sectors performed strongly across the board, while resource mining and technology sectors significantly dragged down the index.
This Week's Leading Sectors (from strongest to weakest)
Leading Sectors
1. Materials (Strongest performer overall)
Gained approximately +2.5%
Driven by: Copper prices hitting a six-week high, stronger gold prices, and expectations of a recovery in Chinese metal demand.
Key Stocks:
• South32 +3.3%~3.6%
• Rio Tinto +2.5%
• BHP +2.3%~2.9% Gold-related stocks: Evolution Mining +4.3%, Northern Star +3.5%
2. Energy
Gained approximately +1.7%
Driven by: Middle East geopolitical conflicts pushing up oil risk premiums.
Key Stocks:
• Woodside Energy +1.3%
• Santos +1.0%
• Paladin Energy (uranium mining) surged nearly 5%
Lagging Sectors
1. Information Technology (Weakest performer of the day)
Funds rotated out of growth stocks.
Representative Stocks by Decline:
• Xero -3.5%~-4.1%
• TechnologyOne -3.4%~-3.9%
• WiseTech Global -2.7%
2. Healthcare: Investment banks lowered target prices, suppressing the market and leading pharmaceutical stocks.
• CSL -3.3%
• Pro Medicus -4.0%
3. Financials (Weak and Volatile): The four major banks generally closed slightly lower, lacking buying support.
Technical Analysis:
The ASX200 closed at 8823 on Wednesday, up 29.7 points (+0.34%) for the day. It rose to around 8842 in the morning but encountered resistance, fluctuated downwards in the middle, and stabilized again at the close, finishing above the intraday high. The closing price held above the 20-day moving average. The index maintained a range-bound pattern, representing a rebound and correction, and has not yet established a one-sided trend. Market divergence was evident: only materials and energy sectors performed well, while technology, consumer goods, and most financial sectors weakened. The index's rise relied on heavyweight mining stocks, indicating weak market breadth. Technical indicators: The daily RSI has rebounded from a low to around 52, moving out of the oversold zone but not yet into overbought territory; bullish momentum is moderate, with no explosive buying. The MACD lines are flat, and the green bars continue to converge, awaiting confirmation of a golden cross; overall, the market is in a neutral-to-bullish consolidation phase, with the rebound being a correction within the range and not yet a significant breakout of the resistance zone.
Trading Strategies:
The following are technical trading ideas only and do not constitute investment advice. Leveraged trading may result in losses exceeding the principal.
**Trend-Following Long Position (Conservative, Await Confirmation)**
• Entry Conditions: Pullback to the 8790-8800 range, stabilization and a positive close, or a breakout with volume above 8845 before entering a long position.
• Stop Loss: 40 points below the entry point.
• Target: First take-profit at 8870; hold if it breaks through, targeting 8915-8930.
**Short Position at the High of the Range (Playing the Market Downward Pressure)**
• Entry Conditions: Rebound to the 8840-8860 range, encountering resistance, and showing a stalling candlestick pattern.
• Stop Loss: Above 8895.
• Target: 8800, a break below could target 8760.
Key Risk Warnings:
1. Overnight US stock market performance, copper, crude oil, and gold commodity fluctuations (materials and energy are the core drivers of the ASX200).
2. Thursday's Australian employment data: Strong data will suppress expectations of interest rate cuts, negatively impacting Australian stocks;
3. Middle East geopolitical tensions disrupt risk appetite;
4. Structural weaknesses in the market: The technology sector continues to weaken, and the rotation of funds across the market is uneven, casting doubt on the sustainability of the index's rise.
Hong Kong Hang Seng Index
Basic Market Overview:
The Hong Kong Hang Seng Index fell 0.4%, or 100 points, to 25,029 on Wednesday, after closing flat in the previous session, as renewed geopolitical tensions weakened investor sentiment and offset support from a strong rebound in semiconductor stocks following Wall Street. Oil prices rose slightly as the US military continued strikes on Iranian military targets for the 11th consecutive night. Significant laggards included Tencent (-3.6%), ZANO (-3.0%), Xiaomi (-3.9%), Meituan (-3.5%), and AIA (-1.2%).
Investors are also focused on InnoLight Technology's planned Hong Kong IPO, aiming to raise up to HK$55.05 billion, potentially becoming the largest Hong Kong listing this year. Meanwhile, reports indicate that Moonshot AI plans to begin negotiations for its final funding round in August, targeting a valuation of up to US$50 billion, driven by strong demand for its latest AI models.
Sector Performance:
Leading Sectors (Strong Against the Trend)
1. Non-ferrous Metals/Precious Metals (Strongest Theme) Rising gold prices fueled a surge in gold stocks; Lingbao Gold and Chifeng Gold jumped over 15%, while Zijin Mining and Laopu Gold also rose.
2. Coal and Oil & Gas Energy Safe-haven commodities followed resource stocks higher.
3. Semiconductors and Memory Chips (Divergent Market) Upstream chip stocks such as SMIC and Montage Technology maintained their strength, but downstream PCB copper-clad laminates saw a sharp drop in the afternoon.
Leading Declining Sectors (Drag Down the Overall Market)
1. Internet Platforms / Large-Scale Tech Stocks (Biggest Drag)
Tencent Holdings and NetEase both fell by over 7%; Kuaishou, Bilibili, Alibaba, and AI application stocks (MINIMAX-W) saw significant pullbacks.
2. PCB / Copper Clad Laminates, Optical Communication Supply Chain
Kingboard Laminates plunged by over 15%, and Yangtze Optical Fibre and Cable fell by over 10%, reflecting market concerns about industry supply expansion.
3. Automobiles, Sports Retail, and Consumer Discretionary
New energy vehicle stocks such as Leapmotor and NIO weakened; Topsports' single-day plunge of over 24% impacted sentiment in the retail sector.
Technical Analysis:
The Hong Kong Hang Seng Index closed at 24892.66 points on Wednesday, down 0.95% for the day, with an intraday range of 24802-25040. Wednesday's close was a medium-sized bearish candlestick. The index rebounded in the morning but met resistance at 25040 and fell back, failing to recover the psychological level of 25000 throughout the day. The high of 25250-25260 on Tuesday formed a double top resistance level, indicating a clear weakening of the rebound momentum. The short-term trend has shifted from a slightly bullish to a slightly bearish pattern. The Hang Seng Index's rebound has shown signs of topping out and has entered a period of consolidation and correction. If it breaks below 24800, the downside target is 24680; if it holds above 24800, it will maintain range-bound trading (24800-25000), and a direct challenge to 25250 is unlikely. Technical Indicators: MACD: After a bearish crossover at a high level, the green bars continue to expand, indicating increasing bearish momentum; no bullish divergence has yet appeared. RSI: It has fallen from the overbought zone to around 42, still with room to decline, but has not yet entered severely oversold territory. Market Structure: The Hang Seng Tech Index fell more sharply (-3.04%), with internet and electronics manufacturing leading the decline; only safe-haven sectors such as oil and gas and gold showed resilience, while growth stocks faced heavy selling pressure, dragging down the index.
Trading Strategy:
This information is for market analysis and reference only and does not constitute any trading or investment advice.
Low-buy strategy (only suitable for entry after support levels stabilize; do not attempt to buy the dip against the trend)
Do not attempt to buy the dip prematurely; wait for confirmation signals.
Two entry conditions for long positions:
1. A pullback to the 24680-24700 range finds support, and the hourly chart shows a bullish candlestick pattern;
2. A sustained close above 25000 with increased volume.
Target: 25130 → 25200; Stop loss below 24620
Bearish bias (current main technical direction)
1. Entry conditions: If the rebound fails to hold above the 24980–25000 range and the intraday chart continues to weaken, a small short position can be attempted.
2. First target: 24800; Second target: 24685
3. Stop loss: Exit if the price holds above 25060.
Risk warning:
The key support level of 24685, if broken with significant volume, will trigger a new round of decline, opening up further downside potential;
If there are sudden positive policy developments or improved US-China relations tonight, the index could rebound quickly and break through the resistance, potentially triggering stop-loss orders for short positions;
The Hang Seng Tech index is highly volatile; a sharp drop in a single large-cap tech stock could cause a rapid decline in the index.
Disclaimer: The information contained herein (1) is proprietary to BCR and/or its content providers; (2) may not be copied or distributed; (3) is not warranted to be accurate, complete or timely; and, (4) does not constitute advice or a recommendation by BCR or its content providers in respect of the investment in financial instruments. Neither BCR or its content providers are responsible for any damages or losses arising from any use of this information. Past performance is no guarantee of future results.
More Coverage



Risk Disclosure:Derivatives are traded over-the-counter on margin, which means they carry a high level of risk and there is a possibility you could lose all of your investment. These products are not suitable for all investors. Please ensure you fully understand the risks and carefully consider your financial situation and trading experience before trading. Seek independent financial advice if necessary before opening an account with BCR.
BCR Co Pty Ltd (Company No. 1975046) is a company incorporated under the laws of the British Virgin Islands, with its registered office at Trident Chambers, Wickham’s Cay 1, Road Town, Tortola, British Virgin Islands, and is licensed and regulated by the British Virgin Islands Financial Services Commission under License No. SIBA/L/19/1122.
Open Bridge Limited (Company No. 16701394) is a company incorporated under the Companies Act 2006 and registered in England and Wales, with its registered address at Kemp House, 160 City Road, London, England, EC1V 2NX. Open Bridge Limited acts solely as a payment processor for BCR Co Pty Ltd and does not provide any financial, trading, or investment services on its behalf. Open Bridge Limited's role is limited to payment processing.


 English
 简体中文
简体中文
 繁體中文
繁體中文
 Bahasa
Melayu
Bahasa
Melayu
 Tiếng
Việt
Tiếng
Việt
 ไทย
ไทย
 日本語
日本語
 한국어
한국어
 ភាសាខ្មែរ
 español