


0
US Dollar Index
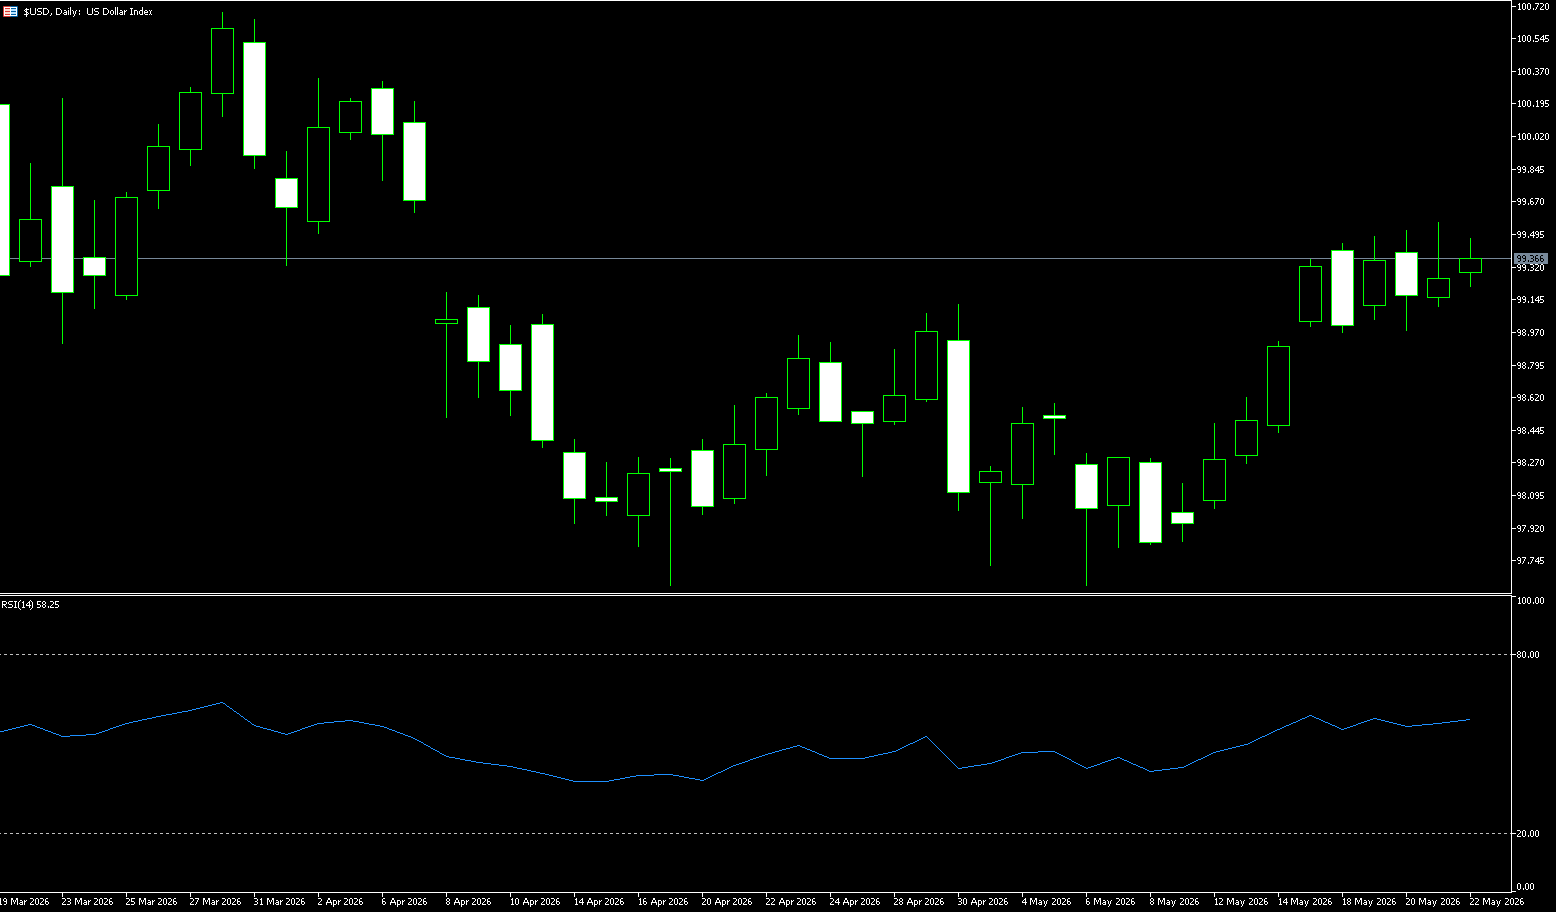
The US dollar index hovered near 99, a six-week high, last week as mixed signals surrounding US-Iran peace talks kept investors cautious about inflation risks and the interest rate outlook. Tehran stated that the latest US proposals had narrowed the differences between the two sides to some extent, although comments from Iran's supreme leader regarding the country's uranium reserves and disagreements over passage fees in the Strait of Hormuz still cast a shadow over hopes for a breakthrough agreement. Meanwhile, the latest Federal Open Market Committee minutes showed that most policymakers believed further interest rate hikes would still be appropriate if inflation remained persistently above the Fed's 2% target.
The Strait of Hormuz carries approximately 20% of global seaborne crude oil, making the region's situation highly sensitive. Further disruptions to transport through the Strait of Hormuz could create new shocks to the global energy supply chain, potentially pushing up international oil prices and global inflationary pressures. Against this backdrop, the US dollar continues to receive funding support as the world's primary safe-haven currency. Markets are concerned that an escalation of tensions in the Middle East could not only disrupt global energy supplies but also further impact global economic growth and financial market stability. Meanwhile, the latest FOMC meeting minutes released by the Federal Reserve in April further strengthened the support for the US dollar. At the same time, the Fed's concerns about inflation risks are clearly intensifying. Against the backdrop of unstable energy prices, the high-interest-rate environment in the US may persist for a longer period, which will continue to provide medium- to long-term support for the dollar. Overall, given that global risk aversion has not yet significantly subsided and the Fed maintains a hawkish stance, the US dollar index is expected to maintain a slightly bullish and volatile pattern in the short term.
Last week, the US dollar index generally showed a pattern of initial rise followed by a high-level consolidation and decline, with the center of gravity remaining above 99.00. The bullish structure remains intact, but short-term upward momentum has weakened marginally, entering a high-level consolidation phase. The medium-term bullish pattern of the US dollar index remains unchanged, but short-term upward momentum has weakened, encountering resistance at high levels and entering a consolidation phase. Affected by the rise and fall of US Treasury yields and the marginal cooling of inflation expectations, the price has slightly retreated from its highs, which is a healthy adjustment after the rise, not a trend reversal.
From a technical perspective, the daily chart of the US dollar index still maintains an overall slightly bullish and volatile structure. The US dollar index rebounded after finding support around 98.20 and is currently trading above the 200-day moving average of 98.54. While the MACD indicator has shown some overbought conditions, it hasn't formed a clear death cross, indicating the medium-term bullish trend is not yet over. The RSI indicator remains around 56, suggesting a slight slowdown in bullish momentum, but the overall bias remains strong.
If the situation in the Middle East escalates further or the Federal Reserve continues to release hawkish signals, the US dollar index could have further upside potential. From a resistance and support perspective, the initial resistance level is around 99.56 (the upper Bollinger Band). A break above this level could lead to a further challenge of the psychological level of 100 and the 100.29 area (the high of April 6th). Key support levels are at 98.62 (the middle Bollinger Band), 98.54 (the 200-day moving average), and around 98.20. A break below these levels could lead to a correction in the US dollar index, potentially falling below the 98.00 level.
Today, consider shorting the US Dollar Index at 99.45, with a stop-loss at 99.57 and targets at 99.00 and 98.90.
WTI Crude Oil
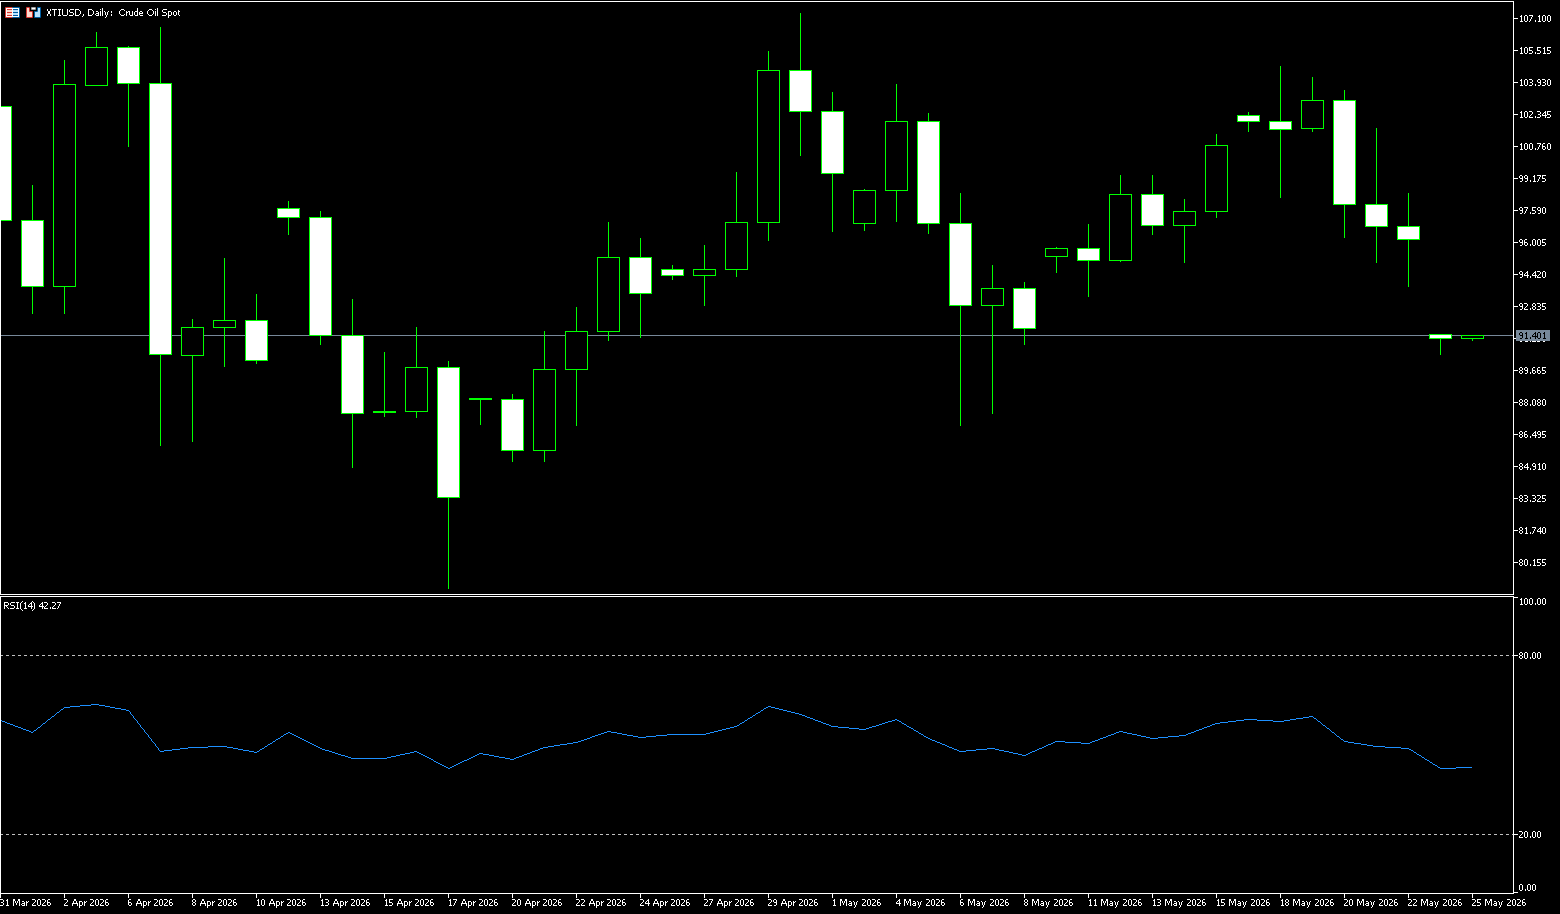
Despite a rebound before last week, WTI crude oil prices still fell by nearly 5% due to optimism that the conflicting parties could eventually reach an agreement. US Secretary of State Marco Rubio stated that there were "some encouraging signs" surrounding a possible agreement with Iran, adding that Pakistani mediators are expected to visit Tehran as Iranian officials review Washington's latest proposals. Media reports, citing Al Arabiya, indicated that with Pakistani mediation, the US and Iran have finalized a draft agreement, which may be officially announced soon. This breaking news quickly swept through the global energy market, completely reversing short-term oil price trends. Both major international crude oil futures markets experienced a sharp drop, and geopolitical risk premiums fell rapidly.
Short-term market sentiment shifted rapidly from a safe-haven surge to risk digestion. According to the final draft framework of the agreement disclosed by Al Arabiya, the core terms of the proposed US-Iran agreement focus on three key areas: ceasefire and conflict cessation, ensuring smooth air transport, and easing sanctions. This aims to comprehensively alleviate geopolitical supply risks in the Middle East, which is also the core logic triggering the sharp drop in oil prices. On the other hand, even if the rumored draft is officially confirmed and formally implemented, the implementation of the US-Iran agreement will still face multiple thorny difficulties. Further back-and-forth negotiations and reversals are almost inevitable, and geopolitical risks will be difficult to completely eliminate. Looking at past experiences with US-Iran negotiations and the implementation of Middle East ceasefire agreements, many core differences cannot be resolved completely in one go, which will constrain the effectiveness of the agreement in the long term.
Last week's WTI crude oil price movement: a surge to high levels in the first half of the week, a sudden plunge on Wednesday, and a low-level consolidation in the second half. The daily chart is at a critical juncture at the end of a "symmetrical triangle," with geopolitical sentiment severely disrupting the technical structure and the battle between bulls and bears extremely intense. Overall, the current US-Iran conflict is still characterized by "negotiations and competition simultaneously, constant verbal sparring, and controllable conflict," and the premise for a unilateral surge in oil prices has not yet been established. The crude oil market is unlikely to break out of its current consolidation pattern in the short term. Last week, easing tensions between the US and Iran and the resumption of shipping in the Strait of Hormuz led to a rapid decline in risk aversion, causing oil prices to plummet nearly 6% in a single day.
Currently, oil prices are weakly consolidating at low levels, repeatedly testing the $97-$100 range. While bulls have seen slight rebounds, they are facing significant pressure, and bearish momentum has been released in stages, entering a testing phase of the key support level of the lower trendline of a triangle pattern. WTI is testing the 50-day moving average (approximately $95.59), which also serves as a crucial support level for the lower trendline of the triangle. If this level holds effectively, the consolidation with a slightly bullish bias can be maintained; however, a decisive break below this level would confirm a downward breakout, opening up further downside potential.
Today, consider going long on crude oil at $95.85, with a stop-loss at $95.60 and targets at $98.00 and $99.00.
Spot Gold
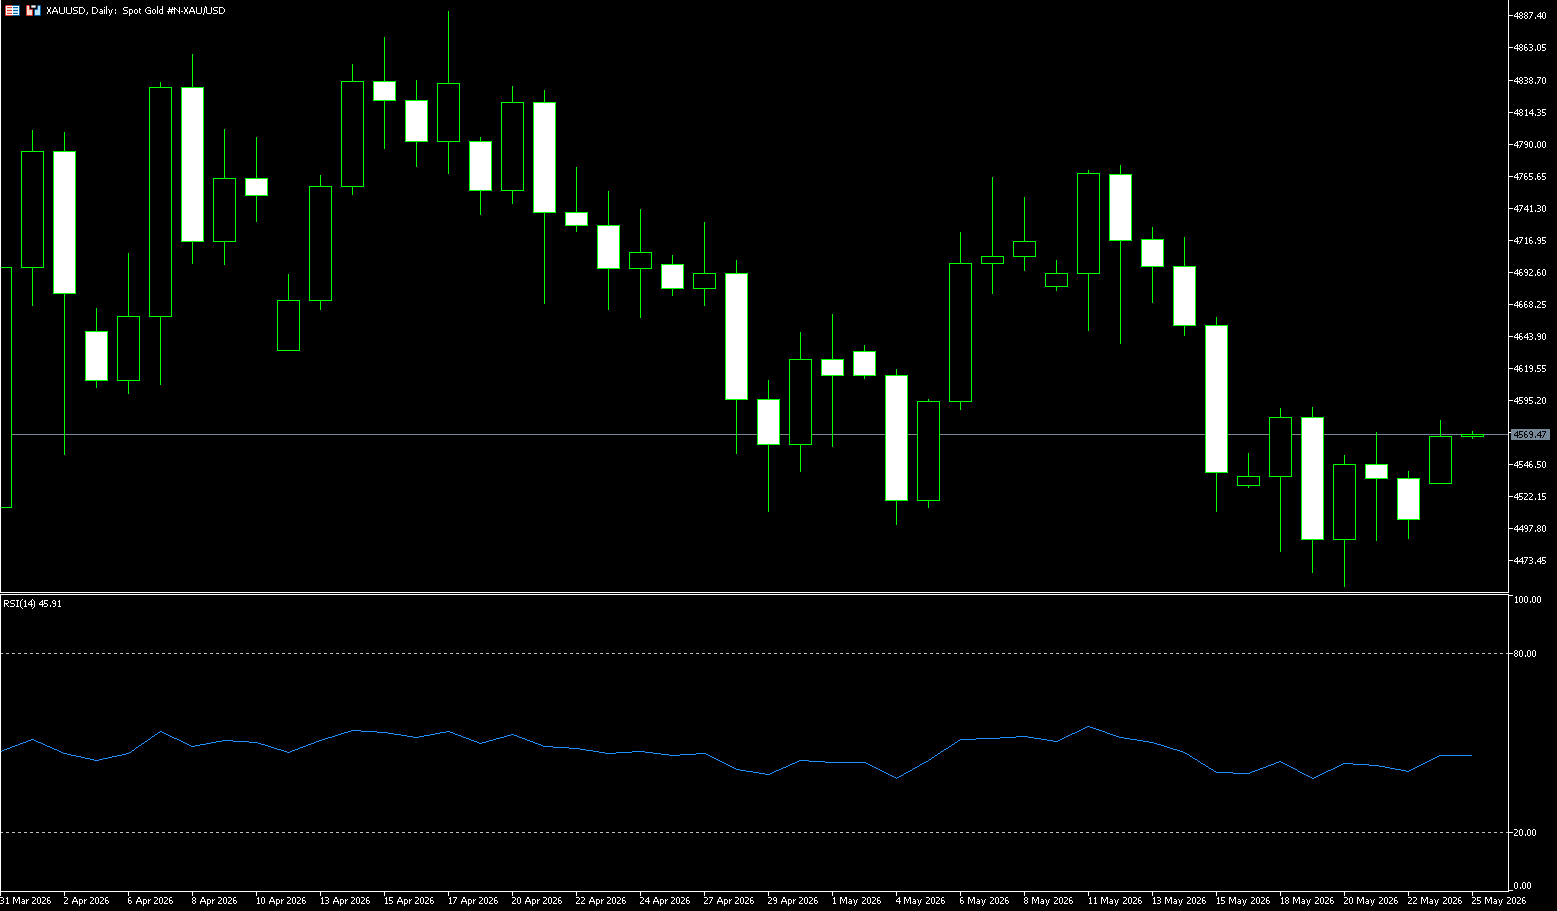
Gold remained above $4,500 per ounce for most of last week, and little change is expected by the end of this week, as conflicting signals surrounding the US-Iran peace talks have kept investors cautious about inflation risks and the interest rate outlook. Tehran stated that the latest US proposal has partially narrowed the gap between the two sides. However, reports that Iran's Supreme Leader ordered the country's enriched uranium stockpile to remain within its borders complicate negotiations, as dismantling Iran's nuclear program remains a key US objective. Iran is also negotiating with Oman to establish a permanent toll system to formally control shipping traffic in the Strait of Hormuz, although President Trump rejected the idea. Despite recent stability, gold prices have fallen by about 14% since the start of the conflict, due to concerns that an energy-driven inflationary shock could prompt central banks to tighten monetary policy.
If the drop in oil prices was the trigger for gold's stabilization, then the simultaneous surge and subsequent decline in the US dollar index and US Treasury yields provided real support for gold prices. The dollar initially surged to a six-week high after Iran's Supreme Leader ordered that enriched uranium must remain in Iran. However, subsequent unconfirmed reports that Washington and Tehran had reached a final draft agreement to end the war caused the dollar to quickly give back its gains. A weaker dollar means that dollar-denominated gold becomes cheaper for investors holding other currencies, providing direct demand support for gold prices. Meanwhile, US Treasury yields finally found some respite after a fierce sell-off. The decline in yields directly reduced the opportunity cost of holding gold, a non-interest-bearing asset, enhancing its appeal to investors. It's worth noting that this yield correction was largely driven by progress in US-Iran negotiations. After US President Trump stated that negotiations to end the war with Iran were entering their final stage, the sentiment in the bond market began to subtly shift.
Last week, gold fluctuated at high levels with intensified battles between bulls and bears. The short-term bias is towards a volatile upward trend, with key support and resistance levels to watch, driven by the US dollar, US Treasury yields, and safe-haven demand. Last week's overall performance showed a slight pullback after a surge, representing a consolidation phase within an uptrend, without any reversal signals. The weekly chart maintains an uptrend, with gold prices holding above the medium-term moving average, and the overall upward structure remains intact. Technically, the daily chart shows the price below the Bollinger Band midline at $4,583.70, and the short-term rebound has not yet regained the midline. The MACD remains in weak territory, indicating that the current market is more likely to be consolidating at low levels after a decline than a trend reversal. The Relative Strength Index (RSI) (14) is around 40, slightly bearish, suggesting that sellers still have the upper hand, even though the downward momentum is not extreme at present.
The lower Bollinger Band around $4,455 and the psychological level of $4,500 form a short-term observation zone, while the area around $4,765 is a resistance zone near the upper Bollinger Band. Technical signals are consistent with macroeconomic logic; gold needs to see a decline in yields or a cooling of the dollar before it can recover its upside potential.
Currently, gold is trading around $4,510, showing a limited movement as it lies below short- and medium-term moving averages while also relying on longer-term support. The 21-day simple moving average at $4,615.50 and the 50-day at $4,666.80 form the first upper supply band, while the 100-day simple moving average is near the higher $4,798.60, reinforcing the market's still-downward bias, although the 200-day simple moving average at $4,375.90 below the price suggests an overall bullish trend. On the upside, a daily close above the 21-day simple moving average at $4,615.50 would be the first signal of renewed bullish momentum. Next resistance lies at the 50-day simple moving average around $4,666.80, followed by the psychological level near $4,700. On the downside, the short-term focus remains on the larger support zone formed by the $4,415 area (now support) and the 200-day simple moving average at $4,375.90. A decisive break below this zone could trigger a deeper decline, while holding above it could allow for an upward rebound to challenge the cluster of short-term moving average resistance.
Today, consider going long on gold at 4,504, with a stop loss at 4,500 and targets at 4,550 and 4,560.
AUD/USD
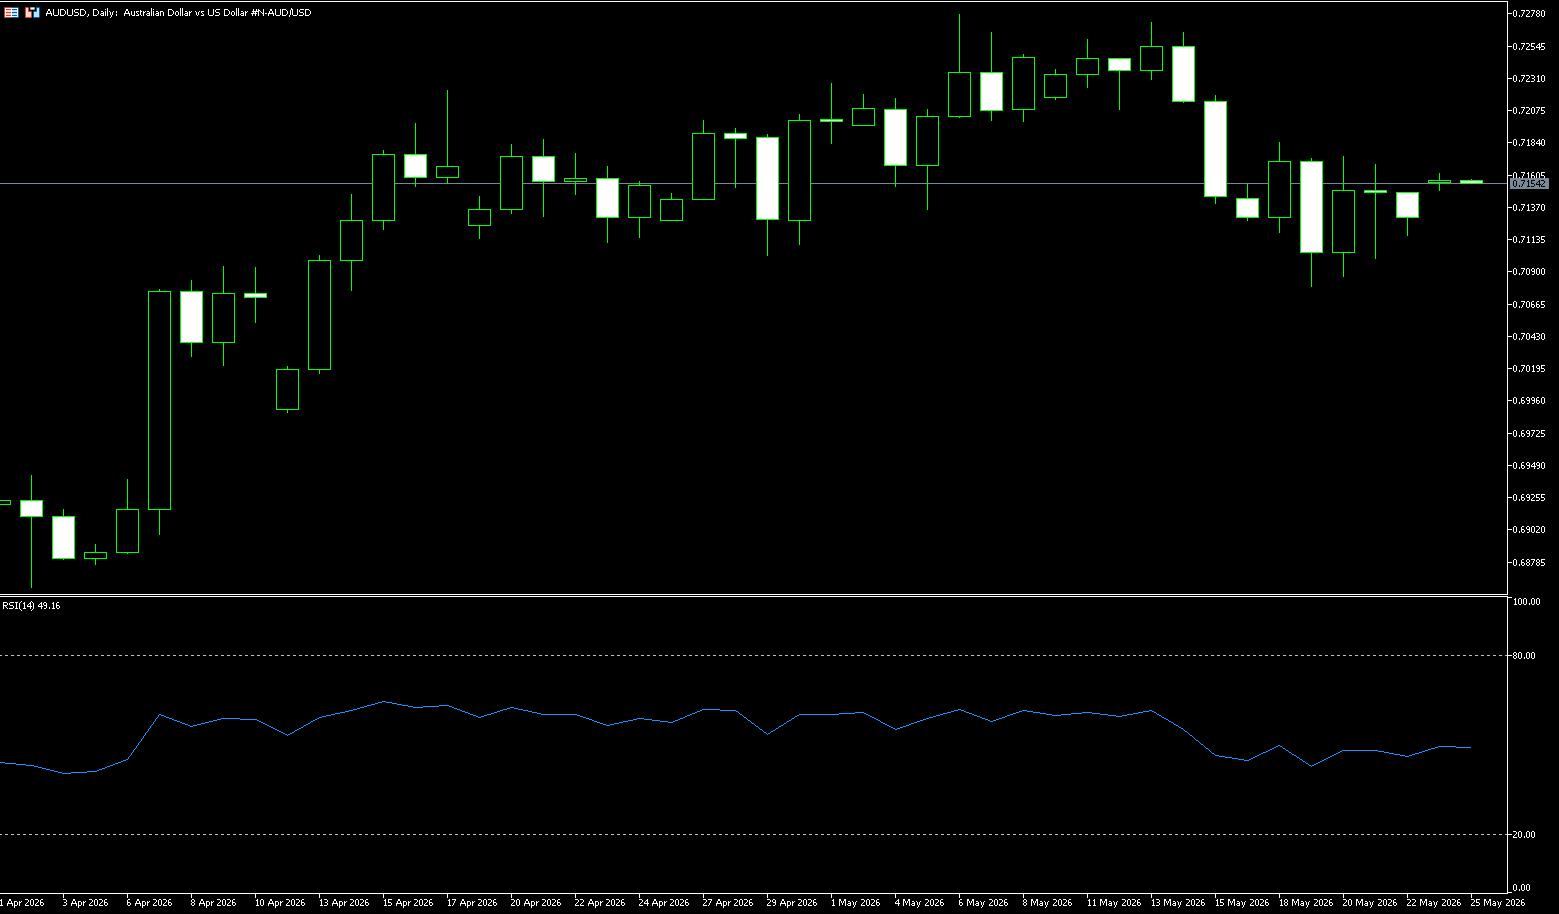
The Australian dollar closed at 0.7128 before depreciating to around US$0.71 on Friday. Earlier, it remained stable above the 85-day moving average of 0.7079, with an unexpected rise in the unemployment rate dampening expectations for further interest rate hikes. In April 2026, Australia's seasonally adjusted unemployment rate rose to 4.5%, exceeding the March figure and market expectations of 4.3%, marking the highest level since November 2021. Employment unexpectedly fell by 18,600 to 14.74 million, marking the first decline since November 2025. Australian economic data has been weakening recently, with the unemployment rate rising to a near three-year high, the services PMI falling into contraction territory, and wage growth slowing accordingly. The Reserve Bank of Australia's current cash rate of 4.35% has likely peaked. Against the backdrop of weakening economic growth momentum and more restrained fiscal spending, market expectations for further interest rate hikes have cooled significantly.
From a policy perspective, the situation facing the Reserve Bank of Australia (RBA) is changing. Previously, the market worried that high inflation might force the RBA to continue raising interest rates, but as economic activity gradually slows, the policy focus has shifted towards "avoiding a hard landing." The global market environment also impacts Australia's economic prospects. Current global energy price volatility, tensions in the Middle East, and the global high-interest-rate environment are all putting pressure on Australian exports, consumption, and investment. From the currency market perspective, the Australian dollar has recently shown a generally weak trend. As market bets on further RBA rate hikes have decreased, while the Federal Reserve maintains a hawkish stance, the interest rate advantage between the Australian dollar and the US dollar is diminishing.
Last week's core logic: the resonance of US dollar index fluctuations, commodity sentiment, risk appetite, and RBA policy expectations resulted in the Australian dollar exhibiting a range-bound, weak rebound, and significant upward pressure. After the previous decline, it entered a low-level consolidation phase, with weak bullish rebound strength, a typical weak rebound followed by a decline under pressure, without forming a reversal signal, and still under pressure from the strong US dollar. With clear support and resistance levels, bulls and bears are locked in a tug-of-war, leaning towards a downward trend. Technically, the Australian dollar and related assets are currently exhibiting a generally weak and volatile structure. The AUD/USD daily chart shows that the price has been consistently pressured below the 20-day moving average at 0.7187, indicating a shift towards consolidation in the medium term. The MACD indicator is gradually falling towards the zero line, showing weakening upward momentum; the RSI indicator has fallen back to around 47, suggesting a more cautious market sentiment.
From a support and resistance perspective, the key resistance level for AUD/USD is around 0.7200. Failure to break through this level could lead to continued weak and volatile trading in the short term. Important support levels are located at 0.7100 and 0.6950. The 4-hour chart shows the Australian dollar's short-term trend remains weak and consolidating. Short-term moving averages are providing resistance, and the MACD indicator remains below the zero line, indicating that bears currently have the upper hand. The first target is the 85-day moving average at 0.7085; a break above this level would target the psychological level of 0.7000. However, if subsequent US economic data weakens, or the market re-bets on a Fed rate cut, the Australian dollar may see a period of recovery. The next key level to watch is 0.7200 (a psychological level), and a retest of the 0.7270 (the highest point since June 2022) resistance zone; even the 0.7300 level.
Today, consider going long on the Australian dollar at 0.7118, with a stop loss at 0.7106 and targets at 0.7170 and 0.7190.
GBP/USD
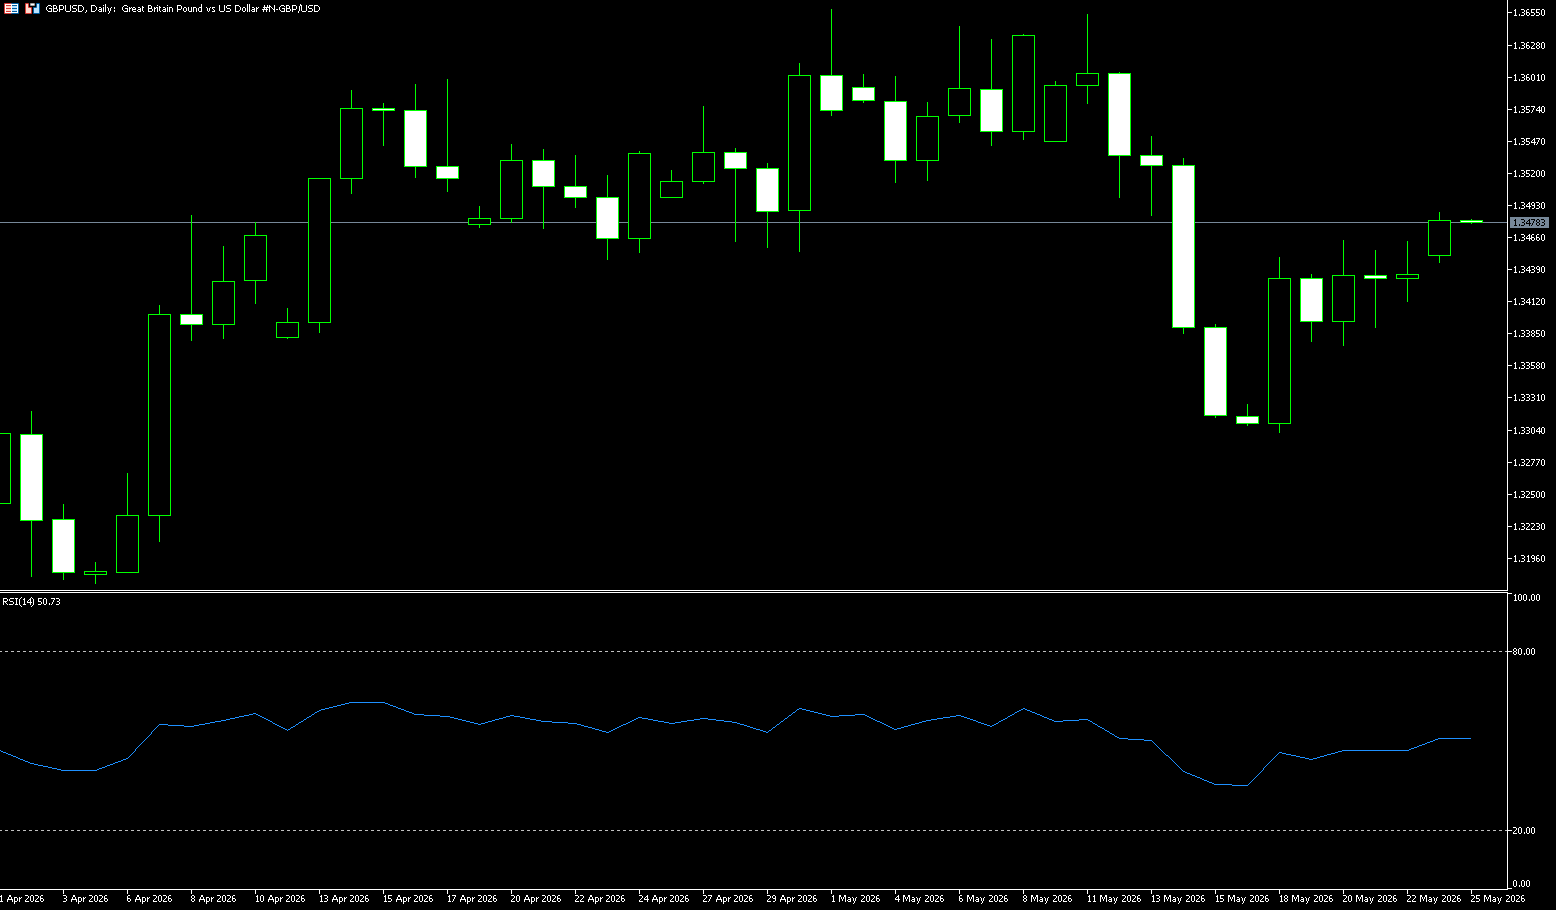
The GBP/USD pair traded within a narrow range last week, though it is still on track for a modest weekly gain. It is currently fluctuating slightly below 1.3450, with little change on the day. The pound has struggled to attract substantial buying due to mixed signals from the Bank of England's policy outlook and UK political uncertainty. Meanwhile, Bank of England Governor Andrew Bailey stated last week that rising market interest rates since the start of the Iran-Iraq war have given the central bank more time to assess the economic impact of the conflict. Nevertheless, the market is still pricing in the possibility of at least one more rate hike by the Bank of England in 2026.
However, pound bulls appear hesitant given the serious leadership challenges facing UK Prime Minister Keir Starmer. This, coupled with the bullish stance of the US dollar, has limited the upside potential for GBP/USD. Despite positive news, investors remain skeptical of a US-Iran peace agreement due to significant disagreements over Tehran's nuclear program and the standoff in the Strait of Hormuz. Indeed, Iranian Supreme Leader Mojataba Khamenei stated that Iran's uranium enrichment activities and control of the strategic waterway remain major obstacles to negotiations. This, coupled with hawkish expectations from the Federal Reserve, supported the dollar and limited the rise of GBP/USD.
Last week, GBP/USD generally exhibited a high-level consolidation pattern, with a slightly bullish bias but slowing upward momentum. It repeatedly tested the upper resistance level, relying on key support zones. Driven by both dollar index fluctuations, UK economic data, and Fed policy expectations, it showed clear short-term volatility with weak unilateral trends. Daily candlesticks showed alternating small gains and losses, a typical high-level consolidation pattern, with selling pressure gradually emerging above and buying support below remaining adequate, and no clear breakout signal yet. The exchange rate has stabilized above the short-term 5/20-day moving averages, and the medium-term moving averages are upward, indicating a healthy medium-term bullish structure. However, the short-term moving averages are flattening, reflecting a slowdown in the upward pace and a consolidation phase. Technical indicators: MACD: The red bars are slightly narrowing, and the fast and slow lines are converging at high levels, indicating weakening bullish momentum and a potential short-term pullback; while RSI: It remains in the 45-50 range, continuing its upward trend with no extreme overbought or oversold risk. The price is oscillating within a channel, with the upper band acting as resistance and the middle band providing support. Short-term trading is expected to be range-bound.
Looking at the daily chart, the GBP/USD pair formed a high near 1.3658 (the high of May 1st) before quickly falling back, subsequently breaking through the psychological support level of 1.3500 and reaching a low of 1.3302 (the low of May 18th) before a slight recovery. The current price is slightly above 1.34, indicating that the rebound is more of a technical correction after an oversold condition than a trend reversal. On the upside, initial resistance is defined by the 89-day moving average at 1.3481; a sustained break above this resistance to 1.3500 (the psychological level) and 1.3532 (the high of May 14th) would provide a more constructive tone for the short-term trend. On the downside, 1.3375 (the low of May 20th) forms the first line of support; a significant break below this level would expose further weakness, potentially pushing towards the psychological low of 1.3300.
Today, consider going long on GBP at 1.3420, with a stop-loss at 1.3410 and targets at 1.3460 and 1.3480.
USD/JPY
The yen fell to around 159 per dollar, heading towards its second consecutive week of declines, as slowing domestic inflation eased pressure on the Bank of Japan to tighten monetary policy recently. Japan's core inflation rate fell to 1.4% in April from 1.8% in March, the lowest level in four years and below the central bank's 2% target for the third consecutive month. At its April meeting, the Bank of Japan sharply raised its core inflation forecast to 2.8% from 1.9%, citing high oil prices linked to the Middle East conflict and the continued passing on of costs to consumers by businesses. The latest data also followed reports that Prime Minister Sanae Takaichi indicated a willingness to consider a supplementary budget aimed at addressing rising energy costs. Meanwhile, traders remained wary of possible currency intervention as the yen continued to trade around 160 per dollar, a level that reportedly triggered intervention efforts in Tokyo in late April and early May.
The latest USD/JPY exchange rate is above 159. Amidst some volatility in the Japanese government bond market, a Bank of Japan investor survey revealed that some market participants are calling for a pause or slowdown in bond reduction, directly impacting the yen's exchange rate. Long-term government bond yields have fallen, the yield curve has flattened, and coupled with expectations of potential policy adjustments, market focus is on the normalization process of bond holdings and exchange rate stability. Simultaneously, investor surveys have included calls for emergency bond purchases in the event of market instability, reflecting the current bond market's demand for policy buffers. While discussions regarding yield control have not become mainstream, volatility in long-term yields has prompted the market to assess the Bank of Japan's potential flexible responses. The impact of these policy signals on the yen is clear.
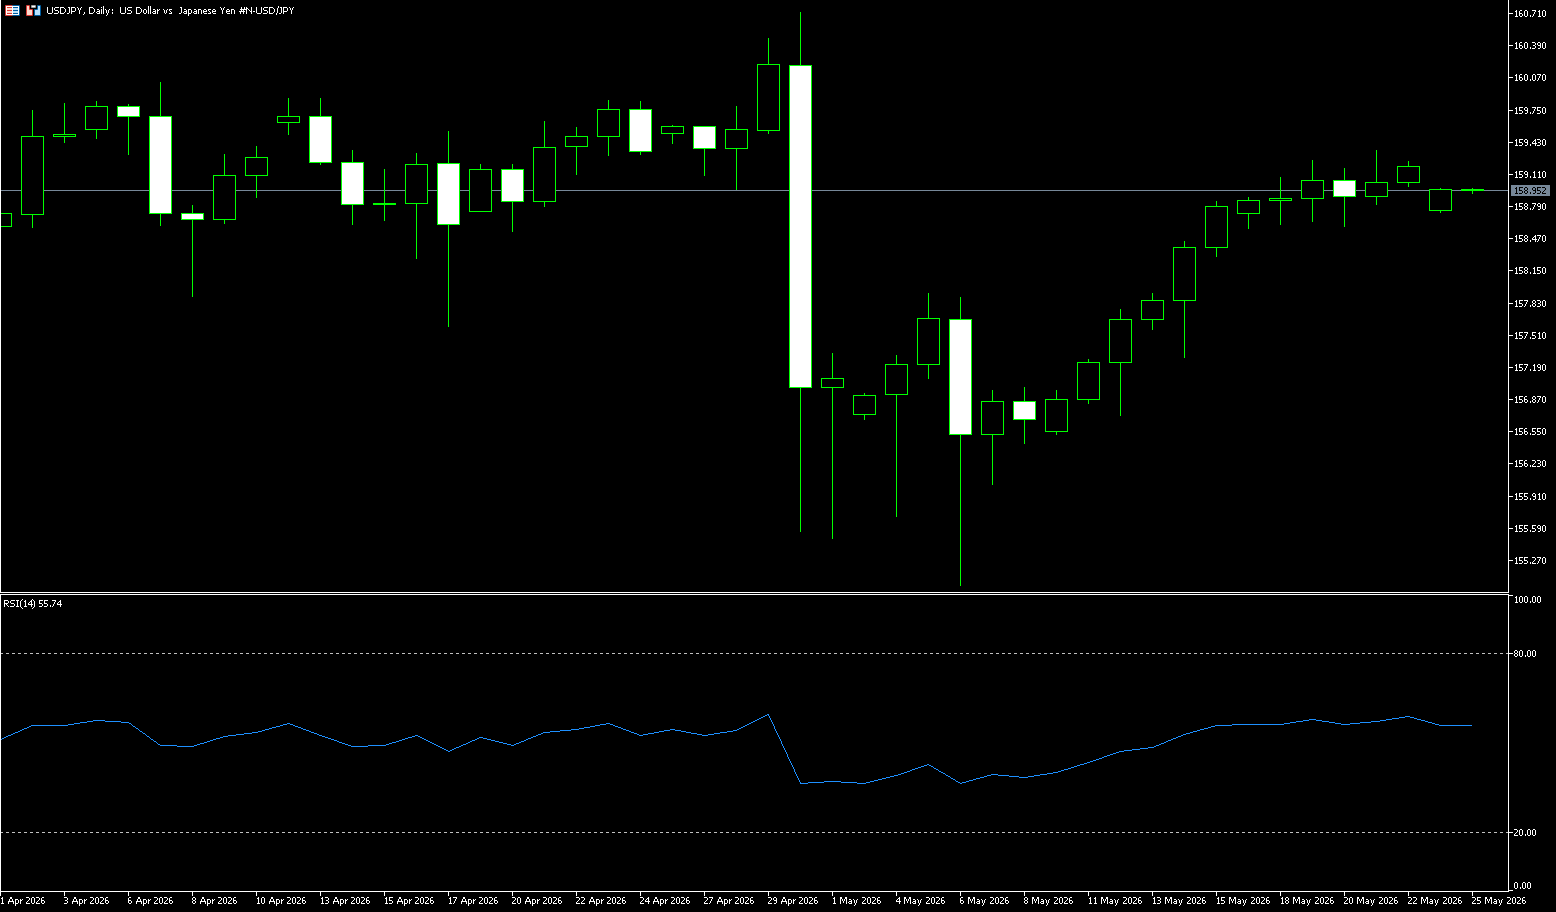
Last week, the USD/JPY pair exhibited a pattern of high-level consolidation, with bulls dominating but momentum weakening, and the risk of an overbought correction increasing. The core battleground was the 159 level, with the upside approaching the key level of 160.00, a potential point for Japanese intervention. The weekly chart continues the long-term upward trend, with the price stabilizing above the 50-week and 200-week moving averages. The USD/JPY interest rate differential continues to support the strength of the US dollar, and the passive depreciation trend of the Japanese yen remains unchanged. Regarding the short-term structure: the daily chart shows seven consecutive days of gains, reaching above 159 this week; the RSI (14) has risen to the 57 range, the MACD red bars are narrowing, and a top divergence is emerging, indicating a marginal weakening of bullish momentum, making a short-term pullback likely. In terms of morphological characteristics, it is at the end of an ascending wedge pattern and has broken through the upper rail of a descending channel. 159 is the dividing line between strength and weakness; stabilizing above this level will continue the bullish trend, while resistance will trigger a phased pullback.
Historically, the price reached a high of 160.73 at the end of April, followed by a rapid decline to a low of 155.05 in early May. Recently, it has rebounded from this low, approaching the 159.2-159.5 area. The previous consolidation platform was located in the 157.50-160.45 range, and the current price is in the later stages of a rebound, facing resistance from the previous high. Support and resistance range prediction based on USD/JPY main contract: Short-term support levels to watch are 158.16 (70-day moving average) and 158.00 (psychological level). A break below these levels could test 157.57 (historical low and 100-day moving average). Key resistance levels to watch are 160 (psychological level) and 160.42 (Bollinger Band upper line). A break above these levels could lead to a further test of 160.73 (April high).
Consider shorting USD at 159.40 today, with a stop loss at 159.55 and targets at 158.90 and 158.80.
EUR/USD
EUR/USD fluctuated around 1.1600 last week as investors assessed weak S&P Global PMI data and the situation in the Middle East. A survey showed that the eurozone economy unexpectedly contracted in May at its fastest pace since the end of 2023, as war-induced surges in the cost of living dampened demand for services and pushed imported price inflation to a three-year high. S&P Global also warned that data suggests inflation will approach 4% in the coming months. Meanwhile, oil prices remained near four-year highs due to doubts about a swift US-Iran deal and the full restoration of traffic in the Strait of Hormuz. The European Central Bank kept interest rates unchanged last month but discussed a potential rate hike, signaling both publicly and privately that a rate increase could come as early as June.
Influenced by market expectations of a potential US-Iran agreement in the coming weeks or months, international oil prices fell and US Treasury yields declined, causing volatility in the euro/dollar exchange rate. The rate briefly fell to 1.1593, its lowest level since April 7, before recovering slightly. Furthermore, the recently released minutes of the Federal Reserve meeting also slightly impacted the euro/dollar exchange rate. The minutes revealed the core views of the latest Federal Reserve meeting. Some Fed officials believed that given the weak US economic growth, conditions were ripe for a rate cut this year. However, two officials disagreed, citing persistently high and sticky US inflation as the main reason.
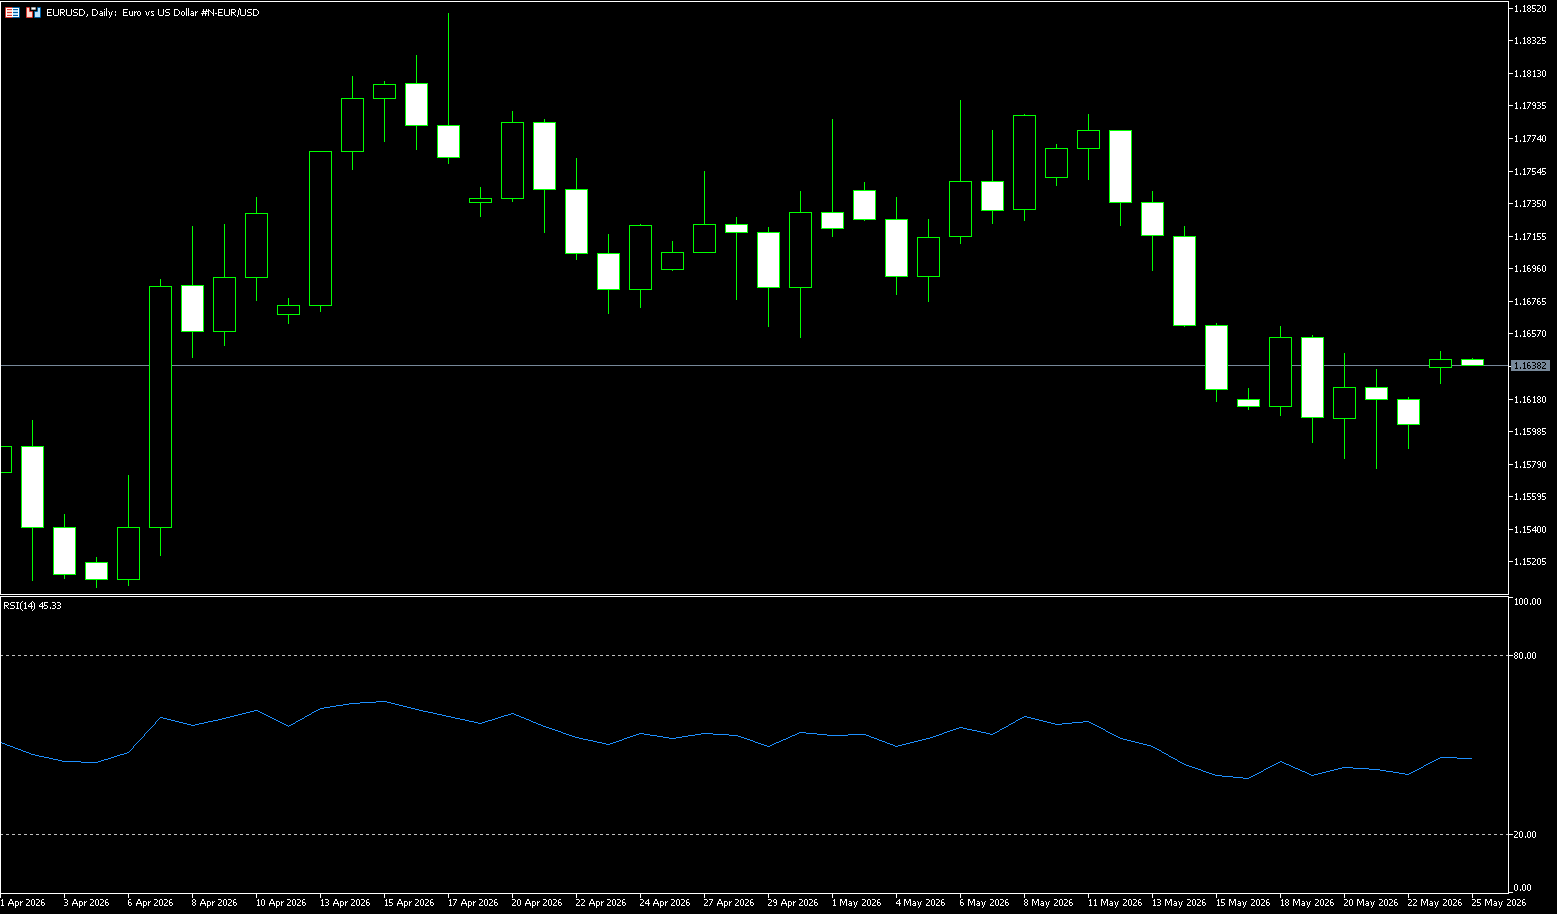
Last week, the euro/dollar exchange rate generally showed a pattern of rising and then falling back, with a weak and volatile downward trend. The strong dollar dominated the market, while the euro's rebound was weak, and the bears were in control, mainly trading within the 1.1560-1.1660 range. The weekly chart is likely to close negative. Last week, the exchange rate continued its previous downward trend, with higher highs. Weekly rebounds failed to hold above the key resistance level of 1.1655 (65-day moving average), strengthening the bearish structure. The weekly moving averages are in a bearish alignment, and the price is trading below the 5/10-week moving averages, indicating that the medium-term downtrend remains intact. The MACD indicator shows a death cross, with bearish momentum continuing slightly and no signs of a golden cross reversal. The RSI (14) has slightly rebounded from the oversold zone to around 40.56, currently in a weak neutral zone. While the rebound momentum is insufficient, the downward momentum has eased somewhat, but no clear bullish reversal signal has yet appeared. The currency pair holds a slight intraday bearish bias as it trades slightly below the weekly high of 1.1660, indicating that upward attempts remain limited as the market digests earlier selling pressure.
From the daily chart, the EUR/USD exchange rate has continued to decline recently. A double-top pattern formed at 1.1795, with the corresponding neckline support at 1.1657. The exchange rate has now broken below this neckline, confirming a short-term downtrend. Simultaneously, the exchange rate has slightly broken below the 50-day moving average, clearly indicating a downward technical signal. Based on a comprehensive technical analysis, the EUR/USD pair is likely to continue its downward trend in the short term, potentially testing the 1.1582 (lower Bollinger Band) and the turning point around 1.1550, followed by the psychological level of 1.1500. If the exchange rate rebounds and breaks through the resistance level of 1.1660 (last week's high), the current bearish technical logic will become invalid, and the market will reverse, initially targeting the 1.1700 (psychological level). A break below this level would target 1.1787 (May 12th high).
Today, consider going long on the EUR/USD at 1.1590, with a stop-loss at 1.1580 and targets at 1.1640 and 1.1650.
Disclaimer: The information contained herein (1) is proprietary to BCR and/or its content providers; (2) may not be copied or distributed; (3) is not warranted to be accurate, complete or timely; and, (4) does not constitute advice or a recommendation by BCR or its content providers in respect of the investment in financial instruments. Neither BCR or its content providers are responsible for any damages or losses arising from any use of this information. Past performance is no guarantee of future results.
More Coverage






Risk Disclosure:Derivatives are traded over-the-counter on margin, which means they carry a high level of risk and there is a possibility you could lose all of your investment. These products are not suitable for all investors. Please ensure you fully understand the risks and carefully consider your financial situation and trading experience before trading. Seek independent financial advice if necessary before opening an account with BCR.
BCR Co Pty Ltd (Company No. 1975046) is a company incorporated under the laws of the British Virgin Islands, with its registered office at Trident Chambers, Wickham’s Cay 1, Road Town, Tortola, British Virgin Islands, and is licensed and regulated by the British Virgin Islands Financial Services Commission under License No. SIBA/L/19/1122.
Open Bridge Limited (Company No. 16701394) is a company incorporated under the Companies Act 2006 and registered in England and Wales, with its registered address at Kemp House, 160 City Road, London, City Road, London, England, EC1V 2NX. This entity acts solely as a payment processor and does not provide any trading or investment services.


 English
 简体中文
简体中文
 繁體中文
繁體中文
 Bahasa
Melayu
Bahasa
Melayu
 Tiếng
Việt
Tiếng
Việt
 ไทย
ไทย
 日本語
日本語
 한국어
한국어
 ភាសាខ្មែរ
 español