


0
Currency and Commodity Analysis:
US Dollar Index
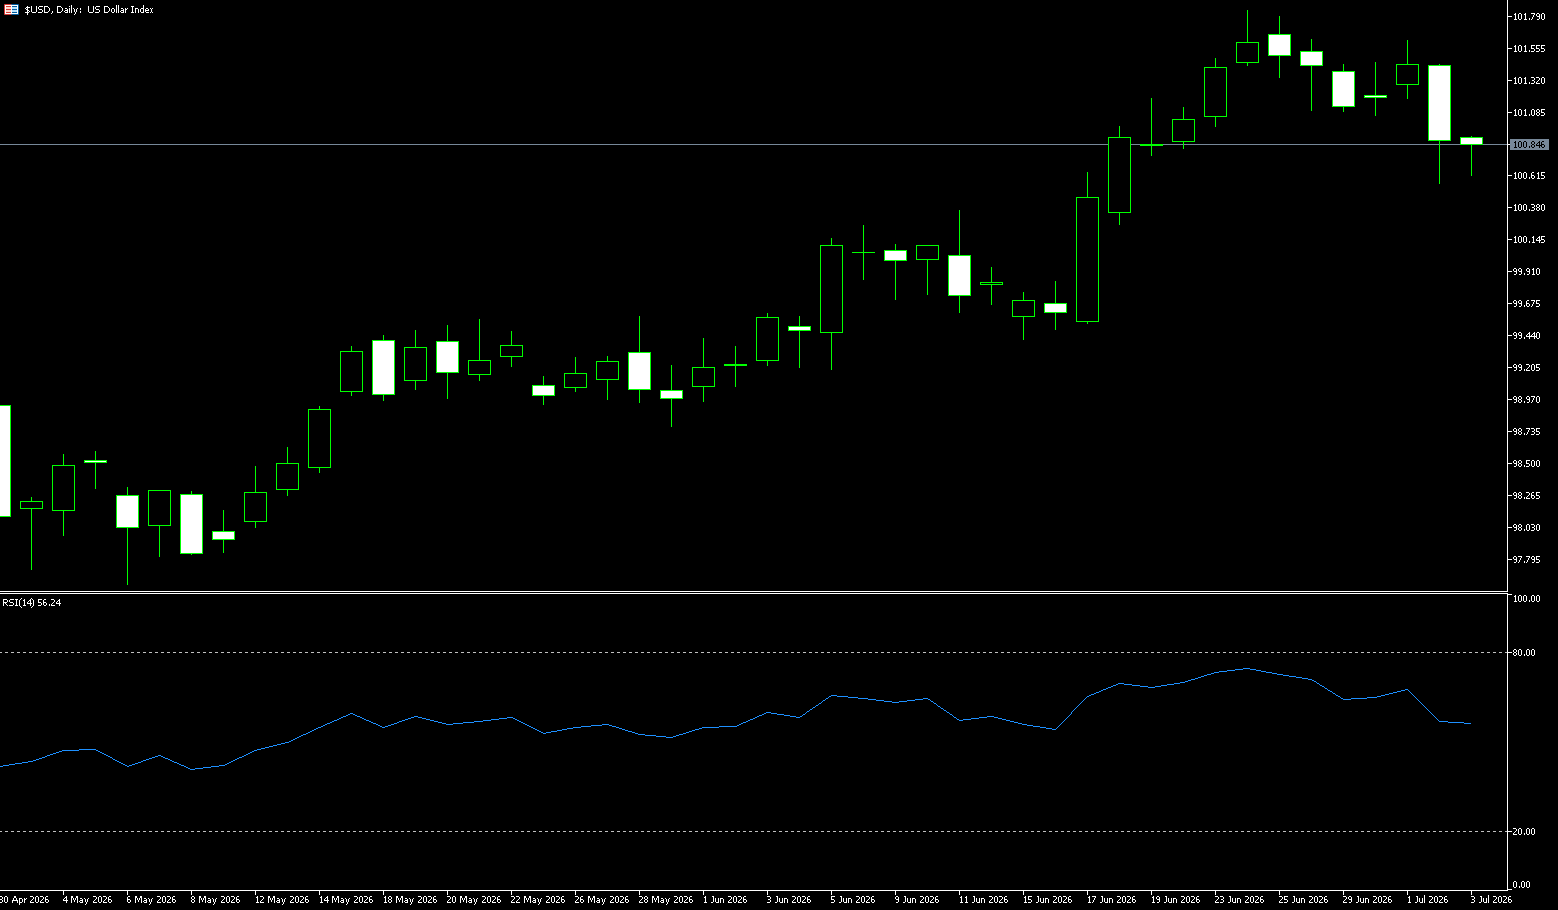
The dollar index fell below 101 last week, after a sharp drop in the previous trading day, as weaker-than-expected U.S. labor market data lowered traders' expectations for a Federal Reserve rate hike this year. The U.S. economy added only 57,000 jobs in June, the lowest level in four months and well below the forecast of 110,000, while the unemployment rate was 4.2%. This echoed a report on Wednesday showing that private sector job growth also missed expectations. Fed funds futures now imply about a 50% probability of a September rate hike, down from 67% before the latest jobs report. Fed Chairman Kevin Warsh also said this week that inflation expectations are weakening, while reiterating the central bank's commitment to maintaining price stability. The dollar index is expected to end the week at a lower level, ending a two-week winning streak.
The dollar index fell 0.48% last week to close at 100.87, marking its biggest weekly drop since early April and its worst weekly performance in 12 weeks. The employment data aligned with the assessment that "policy will eventually shift and the dollar will weaken," and the dollar is expected to face further downside potential. Notably, the US Treasury market was closed on Friday for the Independence Day holiday, which amplified volatility in the thin trading of the foreign exchange market. Meanwhile, investors are seeking new signals to determine whether the dollar will continue to be under pressure next week. Following Thursday's weaker-than-expected US non-farm payroll report, the dollar is unlikely to enter a sustained downtrend. These data alone are insufficient to trigger a significant repricing of expectations for a Fed rate hike. The dollar index is expected to stabilize within the 100.0-101.500 range in the coming weeks.
Last week, the dollar experienced a surge followed by a pullback, closing the week with a long lower shadow and a decline of approximately 0.5%, marking its largest weekly drop since early April, closing near 100.87. At the beginning of the week, the price rebounded slightly due to the previous bullish momentum, but was pressured by the resistance at 101.60. The upward momentum of the bulls continued to weaken. The US June non-farm payrolls were disappointing, with only 57,000 new jobs added (expected 113,000). The data for the previous two months were revised down significantly, and the market significantly lowered the probability of the Fed raising interest rates in September. The dollar fell sharply to a short-term low of 100.56. Last week, the price closed with a solid bearish candlestick with upper and lower shadows. The price broke below the short-term moving average MA20, ending the three-week period of oscillating and slightly stronger pattern. The bullish trend showed a short-term top signal. The dollar index is currently below the 10-day moving average of 101.22, and the 5-day moving average of 101.09 has turned downward to form short-term resistance. The 25-day moving average of 100.42 is the strong support range for this week. The MACD indicator shows that the fast line has turned down and crossed the slow line. The red bars are shrinking rapidly and are about to turn green, indicating that the medium-term bullish momentum is exhausted. The RSI (14) has fallen from 65 to 57, out of the strong range, neutral to weak, not yet oversold, still has room to fall.
Last Thursday, gold prices broke down with a large bearish candlestick, and Friday closed with a long lower shadow inverted hammer candlestick, a typical weak oscillating structure of "support on dips, weak rebounds"; the price traded below the MA5 and MA10 throughout the day, with bears dominating the intraday rhythm. The weekly chart has topped out and weakened, the bullish trend has temporarily ended, and the market is expected to be mainly oscillating with a weak bias in the future. The watershed between bulls and bears is in the 100.98 {14-day simple moving average} to 101.00 {psychological level} range. Only by holding above this level can the downward structure of this week be repaired; the first target is 101.59 {last week's high}; a break below this level will target 101.80 (June 24 high) and the 102.00 {psychological level} area. Conversely, if the US dollar index breaks below 100.56 (the recent low), it will open up downside potential to the 100.08 (34-day simple moving average) and 100.00 (a psychological level). A break below this level would target 99.49 (the June 17 low) and 99.46 (the 55-day simple moving average).
Today, consider shorting the US dollar index at 100.98, with a stop-loss at 101.10 and targets at 100.50 and 100.40.
WTI Crude Oil
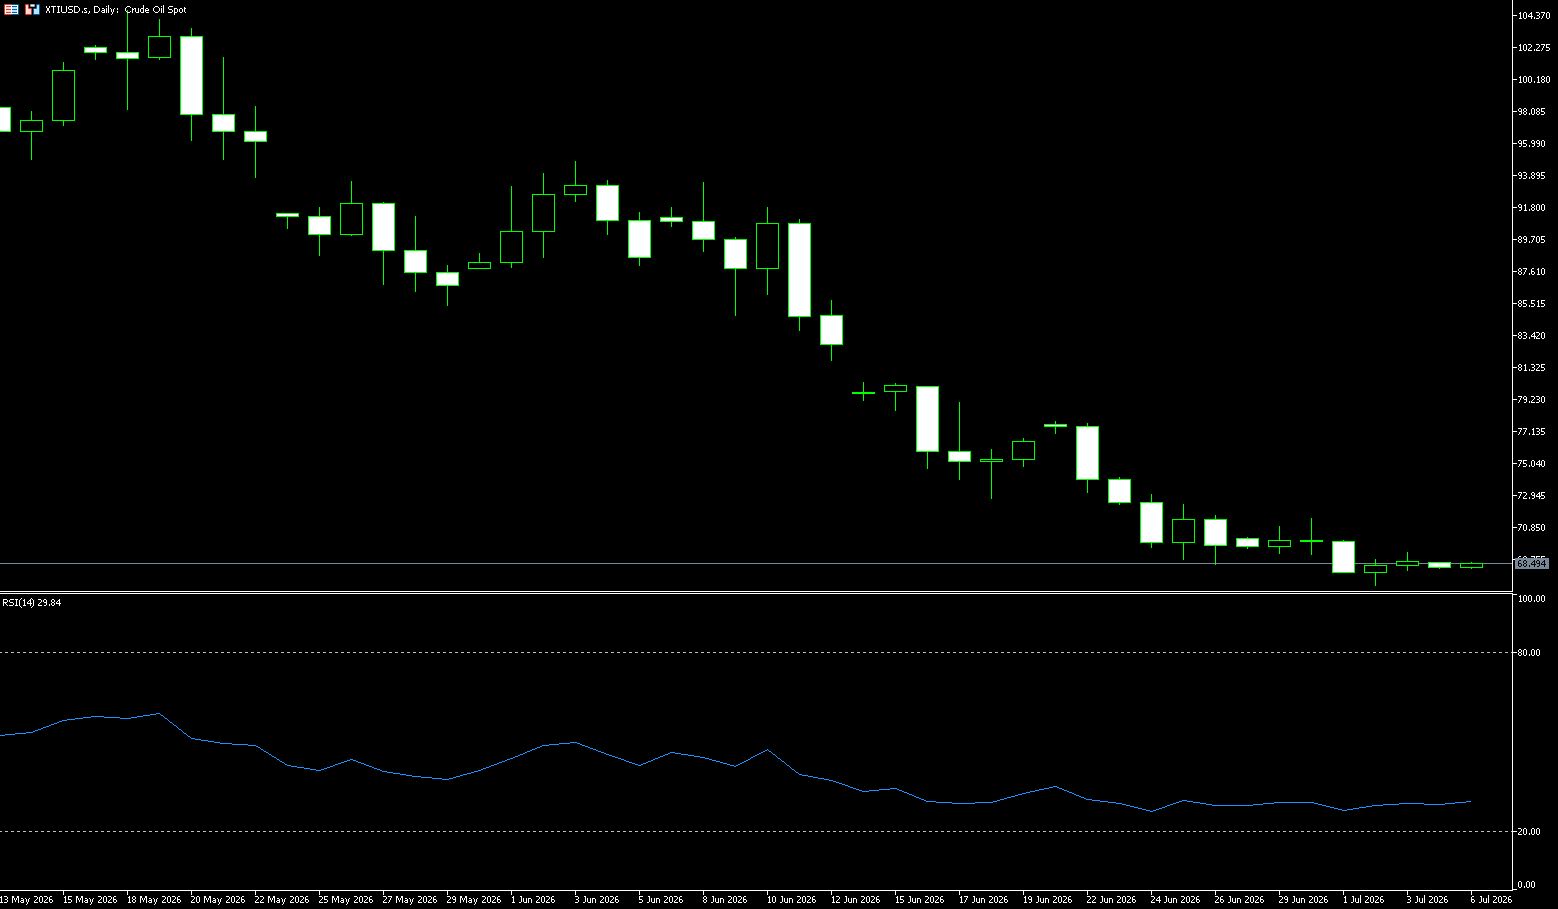
Before the end of last week, WTI crude oil traded above $68.00 per barrel. Prices rebounded after hitting a four-month low of $67.05 mid-week, supported by short covering ahead of the US Independence Day holiday and safe-haven buying ahead of the long weekend. During the Doha talks, the US and Iran made progress on a permanent peace agreement, but the pricing scheme for the Strait of Hormuz became a new point of contention: Oman proposed a voluntary payment mechanism (similar to the Strait of Malacca model), but Iranian officials insisted that the fees would be mandatory, indicating a clear difference in opinion. Meanwhile, negotiations on the US unfreezing Iranian overseas assets stalled, and the Iranian military stated it would respond "resolutely and swiftly" to any interference, meaning the geopolitical risk premium has not completely subsided. Currently, the struggle between the US and Iran over control of the Strait of Hormuz continues to escalate, presenting a complex situation of intertwined tension and easing in the regional geopolitical landscape. This game, concerning the global energy lifeline, continues to dominate the sentiment and trends of the international oil market.
Besides the negative impact of easing geopolitical tensions, the latest US non-farm payroll data showed a significant weakness, further amplifying market pessimism about a weakening global economy and insufficient oil demand, further suppressing the upside potential of oil prices. The current situation of a weak economy coupled with lagging wage growth and high prices suppressing consumption has raised market concerns about a slowdown in US economic growth and its spillover effects, leading to a continued contraction in global aggregate demand. This demand-side weakness directly reshapes the pricing logic of the oil market, with traders postponing their expectations for a Fed rate hike to December. Behind this delayed easing expectations lies rising concerns about an economic recession. As a highly cyclical commodity, the continued dilution of geopolitical supply premiums by pessimistic demand expectations for crude oil puts sustained downward pressure on prices.
Last week, WTI crude oil prices trended downwards, dominated by bears. The EIA data and easing tensions between the US and Iran were both negative factors, leading to a sharp drop that broke below the $70 mark in a single day. Throughout the week, highs gradually declined and lows continued to be refreshed, reaching a low of $67.05 on Thursday. A slight recovery occurred before the weekend, and the weekly chart is likely to close with a medium-sized bearish candlestick, decisively breaking below the $70 psychological level, the mid-term consolidation range. The complete fading of geopolitical risk premiums, coupled with record-high US crude oil production of 13.93 million barrels per day and expectations of increased OPEC production, have weakened the technical picture, mirroring the weakening fundamentals. Any rebounds are merely technical corrections, lacking reversal signals. On the daily chart, the MACD remains below the zero line, with both the DIFF and DEA values negative, indicating that the trend correction is not yet complete. However, after the Relative Strength Index (RSI) fell below 30 on the 14th, short-term oversold signals are accumulating, potentially leading to technical fluctuations. However, this does not change the overall trend of the fundamentals shifting from tight to loose.
From a technical perspective, WTI crude oil prices entered a high-level consolidation and pullback phase after an initial surge. After repeatedly encountering resistance above $70, prices fell back to the $68 area, and the overall trend remains within a wide-range consolidation structure. Key support levels to watch are $67.05 (Thursday's low) and $66.80 (a previous area of dense trading and short-term moving average support). A break below these levels could open up downside potential to the $65.80 area (the previous bottom of the consolidation phase and a significant weekly support zone); a further downside target after a break below this level is $64 (the 61.8% Fibonacci retracement level, a medium-term bearish target). Resistance is concentrated around the $70.00 level, which also corresponds to a previous high and a psychological level. A successful break and hold above this level could reignite upward momentum towards the $73.19 level (the 200-day simple moving average).
Today, consider going long on crude oil at 68.56, with a stop loss at 68.40 and targets at 70.00 and 71.00.
Spot Gold
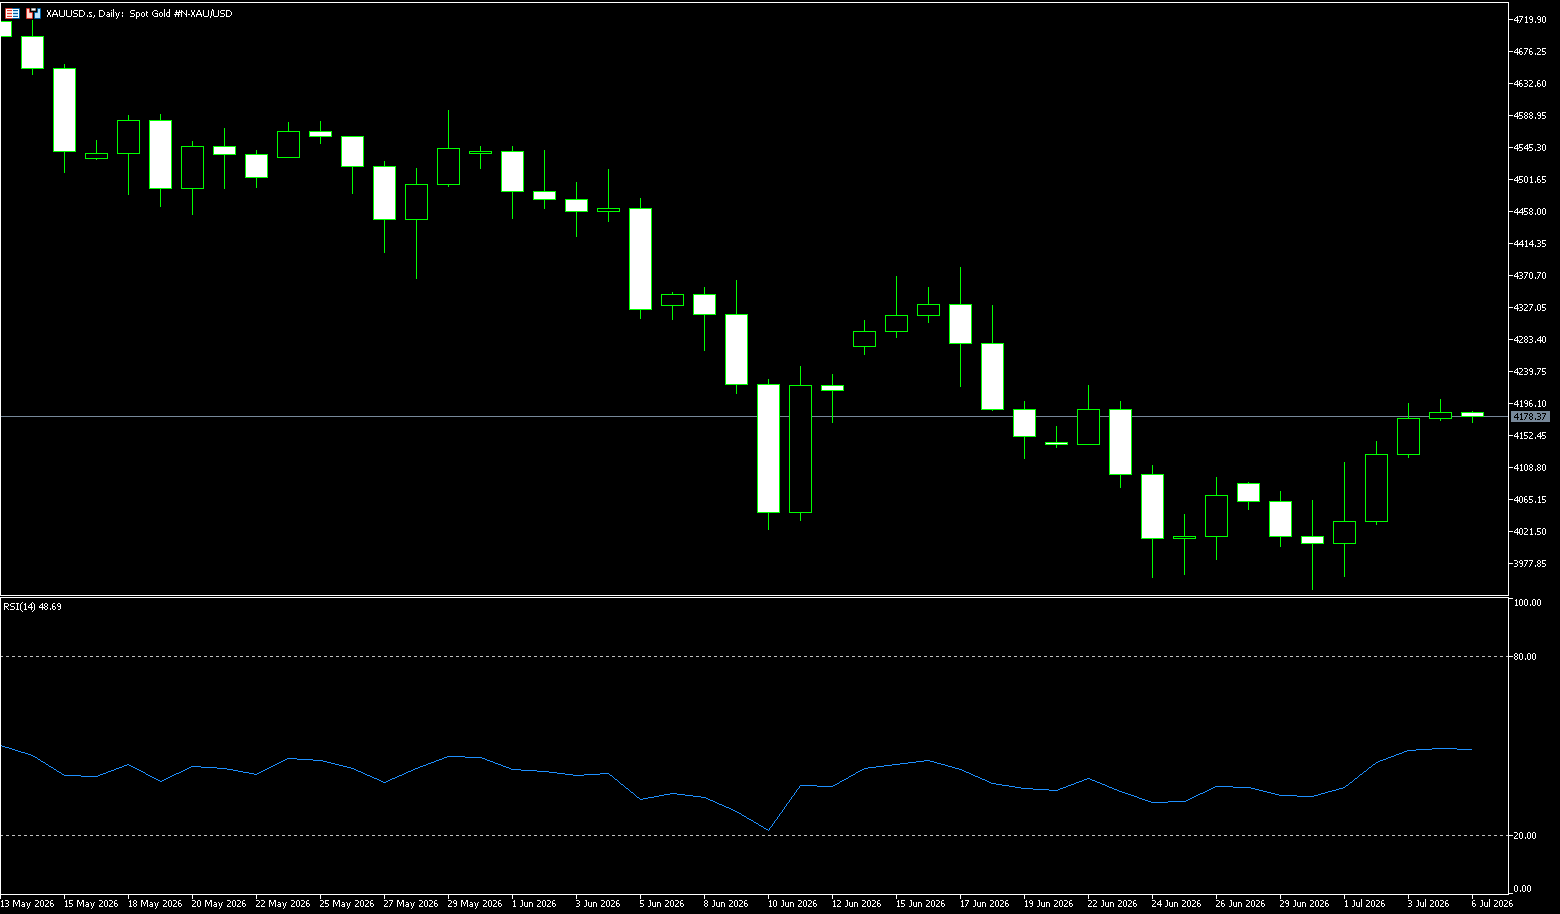
Before the end of last week, gold prices rose to just below $4,200 per ounce, trading at $4,194.50, extending gains from the previous trading day, as weaker-than-expected US jobs data prompted traders to reduce their bets on a Federal Reserve rate hike. The US economy added only 57,000 jobs in June, the lowest in four months and well below the expected 110,000, while the unemployment rate was 4.2%. Following this, Wednesday's report showed that private sector job growth also fell short of expectations. Fed funds futures now imply about a 50% probability of a September rate hike, down from 67% before the latest jobs data release. Fed Chairman Kevin Warsh also stated this week that inflation expectations are weakening, while reiterating the central bank's commitment to maintaining price stability. Meanwhile, gold received additional support from low oil prices and easing inflation concerns, as commercial shipping in the Strait of Hormuz continued to recover amid progress in US-Iran negotiations.
Nevertheless, these key data points indicate a softening labor market, and the recent drop in oil prices has eased inflation concerns, dampening expectations of persistently high interest rates. In fact, traders have revised their expectations for the number of Fed rate hikes in 2026 from one to two to zero to one. This, in turn, has kept the dollar weak near its two-week low hit on Thursday, further supporting buying interest in gold. However, uncertainty surrounding US-Iran negotiations may limit the dollar's decline. Furthermore, Iranian military headquarters warned that any US intervention in the Strait of Hormuz would be met with a "decisive and swift response." This perpetuates a geopolitical risk premium, potentially supporting the safe-haven dollar and limiting further gains in gold prices.
Last week, gold prices experienced a V-shaped reversal, rebounding sharply from the June 30 low of $3,941.70 to $4,194.50 by the end of the week, a weekly gain of 2.9%. The daily chart showed a three-day winning streak at the bottom, along with a MACD golden cross signal. The 4-hour chart showed a bullish alignment, but the weekly downtrend has not fully reversed. The 65-day moving average ($4,482) crossed below the 200-day moving average ($4,486), forming a "death cross" that could trigger algorithmic selling. From another technical perspective, the week's break above the 9-day simple moving average at $4,064 and the 23.6% Fibonacci retracement level of the May-July decline from $4,773.60 to $3,941.70 at $4,137 validated the short-term bullish outlook for gold prices. The Relative Strength Index (RSI) hovered around 48 on the 14th, near the midpoint of the 50 range. Meanwhile, the MACD remained positive and trended upward. Momentum indicators collectively suggest solid but potentially slightly overheated bullish momentum.
Therefore, further gains are likely to encounter resistance near $4,264.50 (38.2% Fibonacci retracement). Subsequent resistance lies at the upper Bollinger Band around $4,371 and $4,366.80 (50.0% Fibonacci retracement). Higher resistance lies at the 200-day simple moving average around $4,486 and the cycle high of $4,500. Immediate support is seen at the psychological level of around $4,100, with $4,032 (last Thursday's low) further solidifying the support level. A deeper pullback could reach the broader structural bottom area of last week's low of $3,941.70 and the lower Bollinger Band at $3,941.90.
Today, consider going long on gold at 4,170, with a stop-loss at 4,165 and targets at 4,230 and 4,250.
AUD/USD
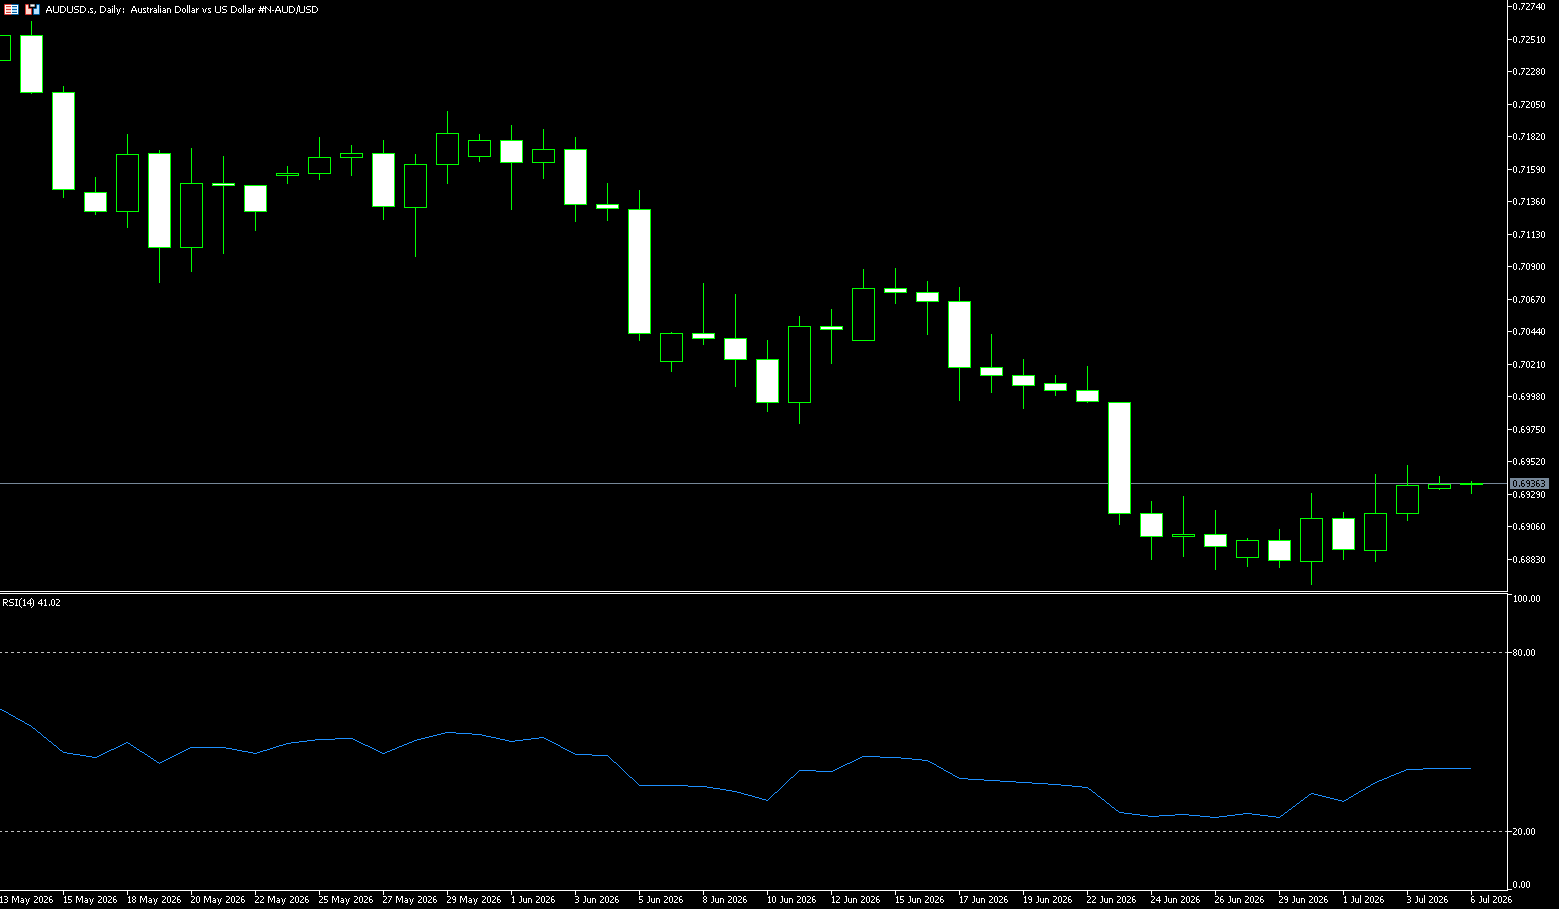
Last week, the AUD/USD pair rebounded after the first half of the week, reaching a high of 0.6940 before the weekend, driven by a renewed sell-off in the US dollar. Following the release of the RatingDog China Services PMI, spot prices maintained their upward trend and are currently trading around 0.6930, slightly below the one-and-a-half-week high reached on Wednesday. This indicator shows continued expansion in China's service sector, providing some support for the Australian dollar, China's representative currency. On the other hand, the US dollar hovered near a two-week low reached on Thursday as bets on a Fed rate hike weakened. This became another factor driving buying sentiment in the AUD/USD pair. The highly anticipated US non-farm payrolls (NFP) report, released on Wednesday, showed 57,000 new jobs added in June, far below the expected 110,000. Furthermore, last month's data was revised from 172,000 to 129,000, reflecting a softening labor market and offsetting the positive impact of the June unemployment rate falling to 4.2%. However, the data led the market to adjust its expectations for the number of Fed rate hikes in 2026 from one to two to zero to one.
However, continued geopolitical uncertainty dampened aggressive short-selling of the US dollar, limiting the upside potential for the AUD/USD pair. The New York Times reported that US officials are concerned that Israel may be planning to assassinate a senior Iranian negotiator, potentially leading to a breakdown in negotiations and triggering a new round of conflict. In addition, Iranian military headquarters warned that any US intervention in the Strait of Hormuz would be met with a "decisive and swift response." Furthermore, due to relatively scarce liquidity caused by the US holiday, investors are cautiously awaiting strong follow-through buying before positioning for the Australian dollar/US dollar pair to extend its rebound from its three-month low earlier this week. Nevertheless, spot prices appear poised for their first modest gain in three weeks, and remain influenced by the US dollar's price action.
According to the daily chart, the Australian dollar/US dollar pair is generally in a medium-term downtrend. After peaking at 0.7270, it has been trending downwards, with moving averages forming a bearish resistance pattern: the 20-day moving average (MA20) (0.6977), 50-day moving average (MA50) (0.7095), and 100-day moving average (MA100) (0.7072) are all trading above the price, with only the long-term 200-day moving average (MA200) providing support below. The price has tested this moving average multiple times, and the recent low of 0.6864 is a key short-term support/resistance level. From a technical perspective, the MACD lines are running below the zero line, with the DIFF at -0.0060 consistently lower than the DEA at -0.0053. The bearish histogram continues to expand, and while the downward momentum has slightly weakened, no golden cross reversal signal has appeared. The RSI is at 41.30, indicating a short-term technical rebound is possible.
On the upside, initial resistance is concentrated at 0.7000 (a psychological level), the 100-day simple moving average at 0.7072, and the nearby horizontal resistance at 0.7075 (the high of June 17th). Next is the 50-day simple moving average at 0.7095, and the 0.7100 (a psychological level). Following that is the previous high resistance at 0.7270. Immediate support is seen at the 0.6900 level, followed by the 0.6867 (the 200-day simple moving average) and the 0.6864 (Tuesday's low). A continued break below these support levels would expose a deeper bearish target at 0.6800.
Consider going long on the Australian dollar today at 0.6930, with a stop-loss at 0.6920 and targets at 0.6990 and 0.6995.
GBP/USD
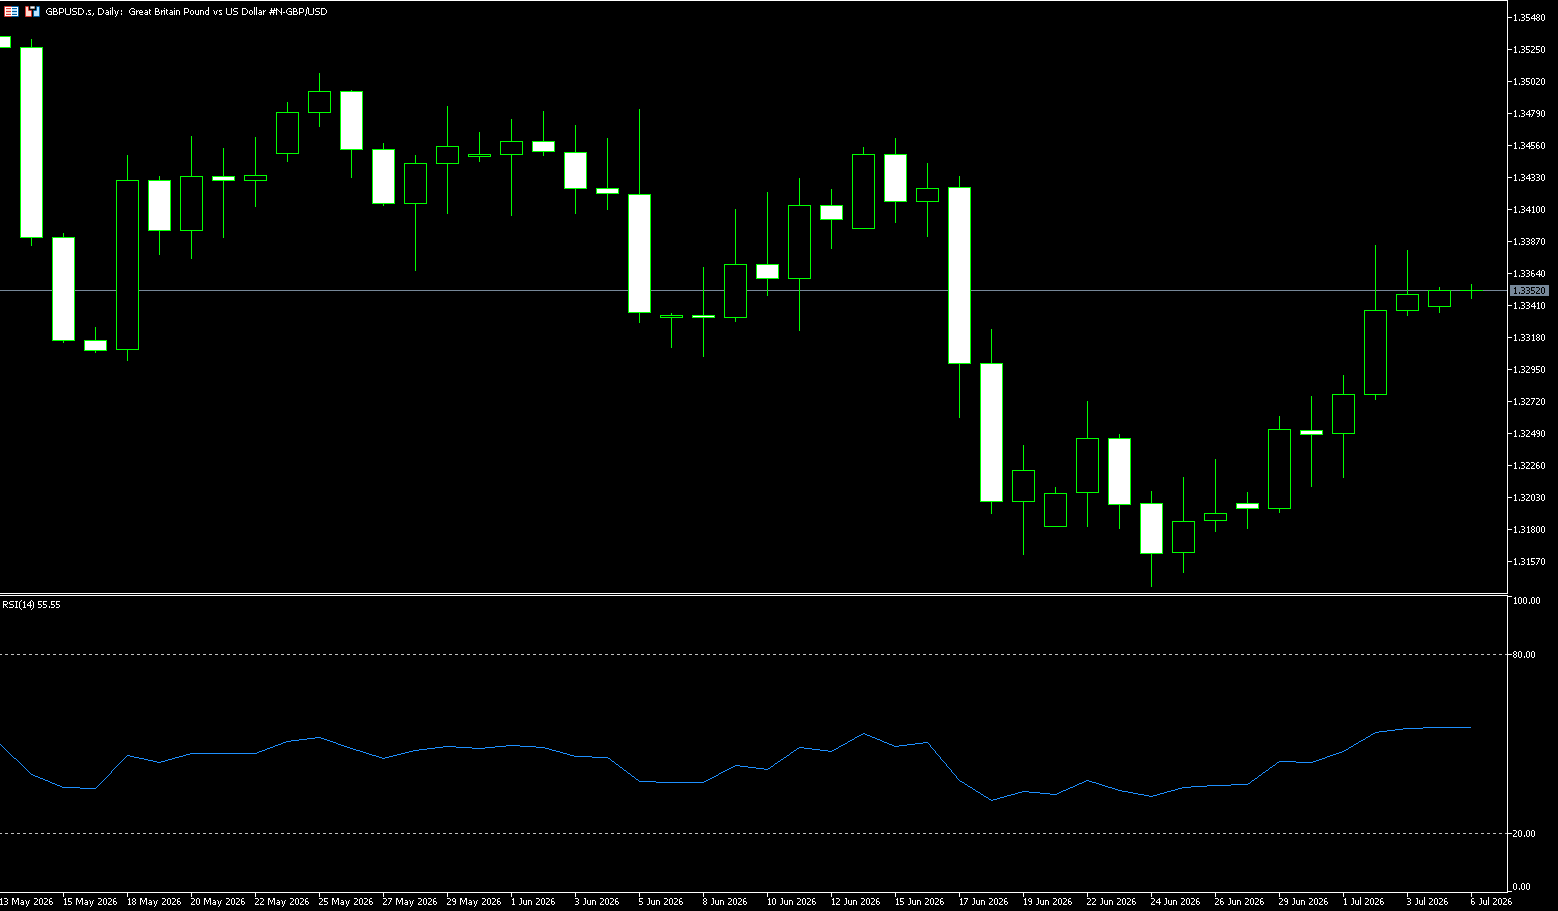
Last week, the pound rose to $1.3385, its highest level in two weeks, as the dollar weakened amid a much weaker-than-expected US jobs report and indirect signs of progress in US-Iran negotiations. The US economy added only 57,000 jobs, far below expectations, while the unemployment rate fell to 4.2% as many people left the labor market. Elsewhere, Qatar announced that the next round of US-Iran talks would be arranged as soon as possible, and oil prices continued to fall as shipping in the Strait of Hormuz was largely unaffected. Regarding monetary policy, Bank of England Governor Bailey maintained a dovish tone at the ECB's Sintra Forum, noting signs of a slowdown in the UK economy but emphasizing that persistent inflation risks ruled out an imminent rate cut. Meanwhile, Federal Reserve Chairman Warsh pointed out that recent inflation expectations have eased somewhat, while reiterating the Fed's commitment to restoring inflation to its target level.
From a fundamental perspective, the pound's movement exhibits a typical structure of "interest rate support and political risk hedging." The Bank of England has recently maintained a relatively hawkish stance, providing some interest rate differential support for the pound, but rising domestic political uncertainty has weakened market confidence in pound assets, limiting the sustainability of the rebound. Investors, faced with a combination of macroeconomic and political factors, tend to reduce their long pound positions on rallies. At the same time, the dollar remains relatively stable ahead of the release of US non-farm payroll data. The market is generally watching the employment data results to judge the Fed's subsequent policy path. The lack of a clear directional breakout in the dollar makes the pound more passively volatile. Current exchange rate movements are more driven by technical factors than by a single fundamental factor.
Overall, the current pound/dollar exchange rate movement presents a typical pattern of "technical rebound stalled + fundamental divergence." From a market structure perspective, the current pound rebound is closer to a technical correction than a trend reversal. The bearish structure formed by the previous decline has not been completely broken, and the moving average system remains under pressure. If the rebound fails to effectively break through the 1.3385 (last week's high) to 1.3400 (psychological level) area, the overall trend will remain weak and volatile. Technically, after the non-farm payrolls data release, the daily RSI rose to the neutral zone of 55, and the MACD histogram showed a significant contraction in the green bars, but the DIFF line remains below the DEA line, indicating only a correction and not a reversal to bullishness, suggesting a short-term pullback is likely. The 50-day moving average resistance at 1.3409 and the 1.3400 (psychological level) area (where this week's high was just before encountering resistance) represent the first major hurdle for the bulls in the short term.
Meanwhile, last week's US June non-farm payrolls data significantly missed expectations, causing the US dollar index to plummet and the British pound to surge violently, reaching a high of 1.3385. Before the weekend, it consolidated at the high end of the 1.3340-1.3370 range, with the weekly chart showing a medium-sized bullish candle with a lower shadow, indicating a corrective rebound after an oversold condition, but the medium-term downtrend has not reversed. On the daily chart, GBP/USD is maintaining a moderate support tone above the 25-day simple moving average at 1.3324, while immediate support lies at the Bollinger Band midline and psychological support level. Further support is seen around 1.3250 (the 9-day moving average). A deeper pullback could attract bargain hunting interest at the broader 1.3200 level. Initial resistance is located near the psychological level of 1.3400 and the 50-day moving average area at 1.3409. A daily close above this resistance would open the door to the Bollinger Band at around 1.3468.
Consider going long GBP at 1.3340 today, with a stop loss at 1.3330 and targets at 1.3385 and 1.3400.
USD/JPY
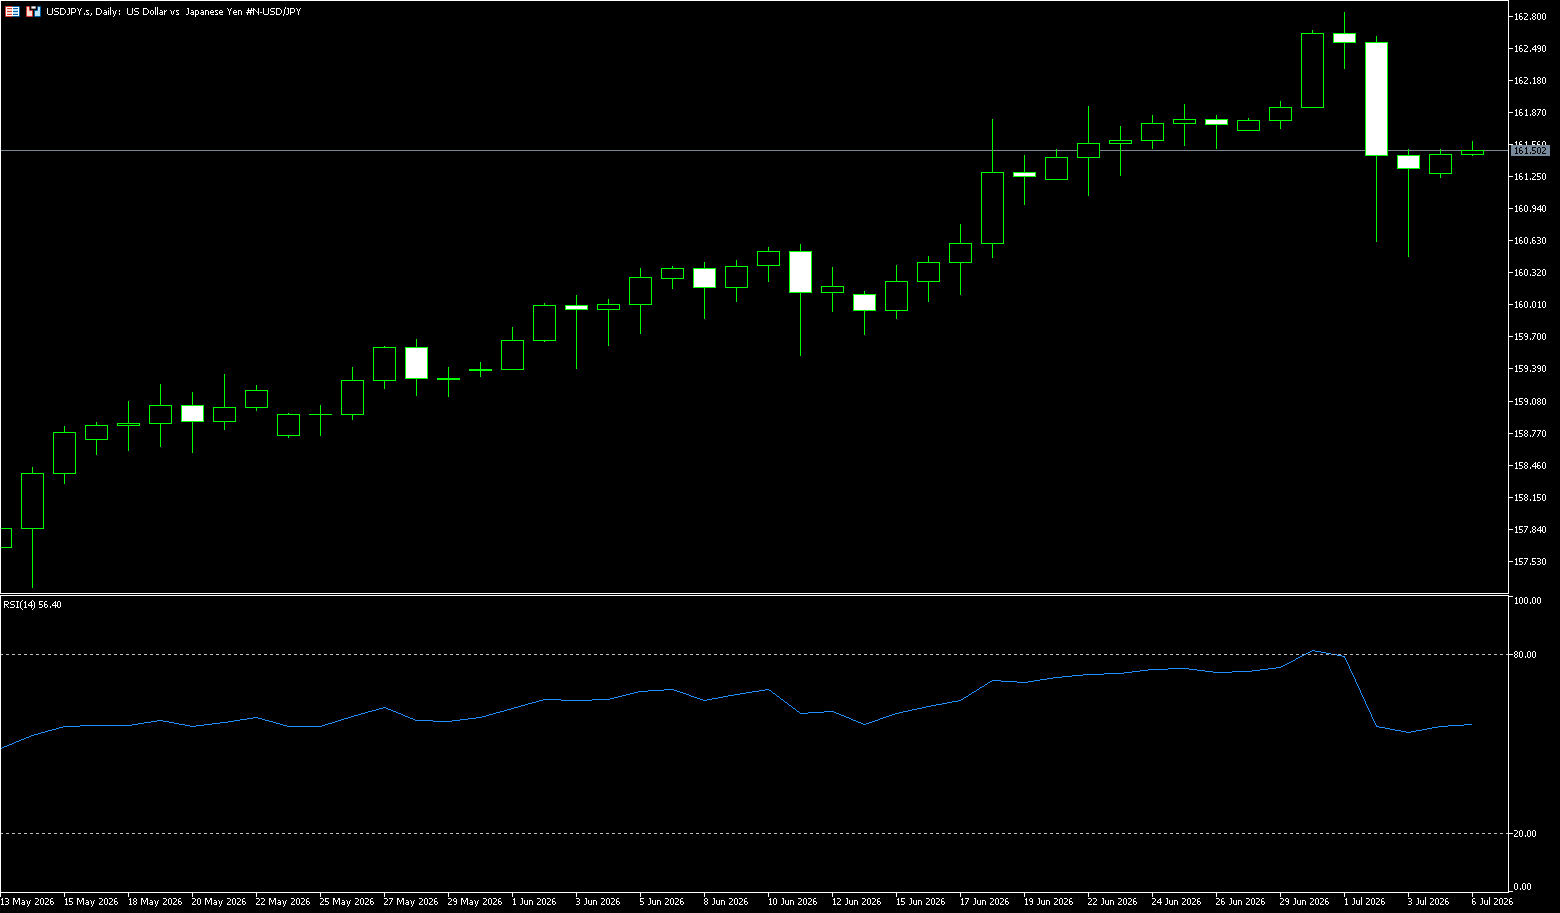
USD/JPY attracted new selling pressure ahead of the weekend as the pair fell for several consecutive days. Spot prices are currently trading around 161.00 and appear poised to extend their corrective decline from the highest level since 1986 reached last week. As investors digest weak June US jobs data, ongoing geopolitical uncertainty has helped the safe-haven dollar rebound from its lowest level since June 18th, a key factor supporting USD/JPY. Meanwhile, the yen may continue to benefit from a significant shift in Japan's intervention strategy. Japanese officials are abandoning their previous practice of announcing intervention risks in advance, instead taking more targeted actions to suppress speculators and increase the cost of betting on yen depreciation. This injects new uncertainty into the market and could prompt further adjustments to yen speculative positions, validating the short-term bearish outlook for USD/JPY against the backdrop of liquidity scarcity due to the US holiday.
Last Friday was the US Independence Day holiday, with scarce liquidity and increased volatility, providing the Bank of Japan with a window for intervention, as previously preferred. Therefore, the pair's movement will depend on US data and whether Tokyo ultimately takes action. The yen rose nearly 1% in the latter part of last week, approaching 160 yen per dollar, before retreating from a 40-year low as traders remained highly vigilant about potential currency intervention. This new approach, unlike the intervention on April 30th, may be more effective in catching traders off guard and unwinding speculative bets on the yen, as Japan may stop signaling intervention plans in advance. Meanwhile, investors remain skeptical about whether the Bank of Japan will accelerate policy tightening, as it remains on a path of gradual normalization. Persistent carry trades and the still significant interest rate differential between Japan and the US continue to put pressure on the currency.
Last week's overall pattern showed a rise followed by a fall, indicating weakening bullish momentum. Technically, last week's long upper shadow doji candlestick is a typical high-level stagnation signal, suggesting a high probability of a pullback this week, making a direct new high unlikely. Currently, the path of least resistance for USD/JPY has shifted to the downside. After eight consecutive weeks of gains, it recorded its first weekly decline. The Stochastic Relative Strength Index (Stoch RSI) has fallen from above 90, and while the MACD is above the zero line, the fast and slow lines show signs of a death cross, indicating increased short-covering pressure. Furthermore, the asymmetric risk of no announced intervention makes new bullish sentiment unfavorable. A return to 162.50 is needed to restore the carry trade trend, while 160.00 will determine whether this is a pullback or a true trend reversal. In terms of moving averages, the 5-day moving average has turned downwards, and the price breaking below it indicates weakening short-term bullish momentum; the 20-day moving average at 160.20 provides strong medium-term support.
Due to the weaker-than-expected June non-farm payrolls, expectations for a Fed rate hike in the near term have cooled, and declining US Treasury yields are putting downward pressure on USD/JPY. Therefore, the psychological level of 160.00 is crucial. The 65-day simple moving average at 159.54, slightly below this level, also serves as a psychological barrier, a level that Tokyo has previously defended. Then there's the area around 158.91 (the 100-day simple moving average), which was the previous consolidation zone, with the 200-day simple moving average near 156.80 providing deeper support. Meanwhile, on the resistance side, consider 161.81 (the 9-day simple moving average) first, and the psychological level of 162.00, which limited the initial attempt to rebuild the uptrend, with the 40-year high near 163.00 above it. If the daily close returns above this range, it will indicate that the intervention panic has subsided, and carry trades will continue.
Today, consider shorting the US dollar at 161.55, with a stop loss at 161.70 and targets at 160.50 and 160.30.
EUR/USD
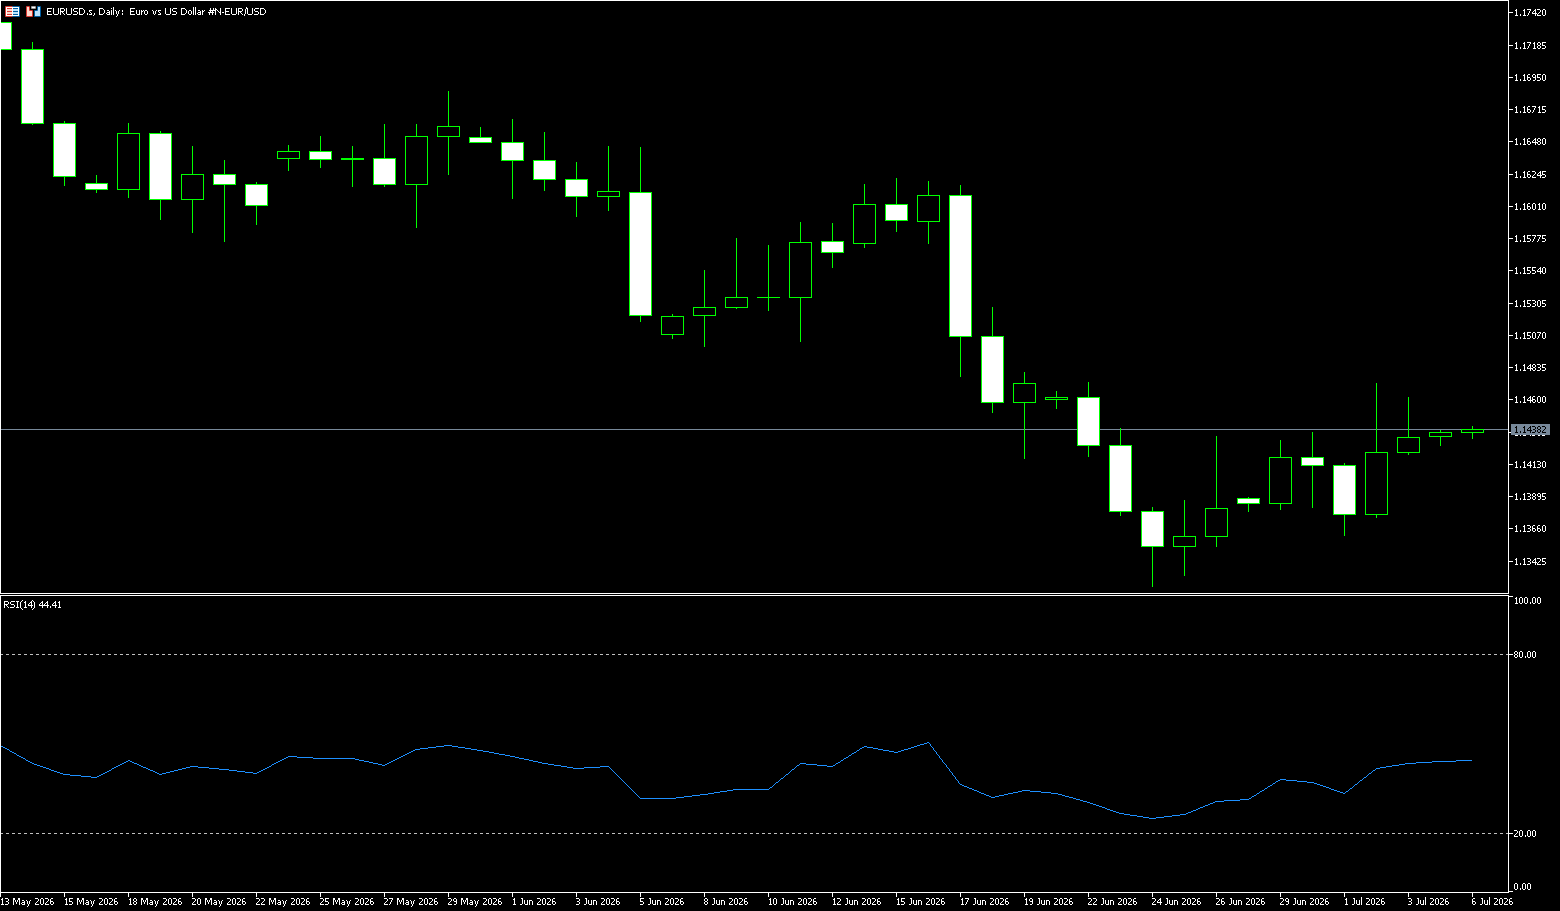
The euro rose to $1.1472 last week, rebounding from a recent one-year low, as the dollar weakened following a much weaker-than-expected US jobs report. The US economy added only 57,000 jobs, far below expectations. The euro's gains were limited by lower-than-expected eurozone inflation and dovish comments from European Central Bank President Christine Lagarde. Data showed that headline inflation slowed to 2.8% in June from 3.2% in May, below expectations, while core inflation also fell to 2.4%, similarly missing expectations. At the ECB's Sintra Forum, Lagarde stated that risks to eurozone inflation and growth had diminished, reflecting reduced energy price pressures since the ECB raised interest rates three weeks ago. Meanwhile, optimism regarding indirect US-Iran negotiations continued to support lower oil prices, with Qatar announcing it would soon arrange a new round of talks.
From a cross-asset perspective, if the US dollar continues to be supported by inflation stickiness, the upside potential for the euro against the dollar will be limited. However, if US price data begins to show a significant cooling, the dollar's interest rate advantage will narrow, and the area above 1.15 may become a viable discussion zone again. The euro itself needs stronger fundamental support; otherwise, a rebound could easily be interpreted as a mirror image of a dollar decline rather than a revaluation of euro assets. Although the European Central Bank (ECB) has just completed one rate hike, the urgency to further increase it has decreased. The market now needs to determine not whether the ECB remains hawkish, but whether the 2.25% deposit facility rate is already close to the effective upper limit of this round of tightening. This is also the key reason why the euro is unlikely to rise unilaterally. However, from an exchange rate perspective, it also compresses the interest rate premium. If energy prices continue to fall, euro-side interest rate expectations may cool further; if the energy shock resurfaces, growth pressures in the Eurozone will be re-incorporated into the exchange rate. Neither path naturally equates to a unilateral strengthening of the euro.
From a technical perspective, the euro/dollar pair has retreated from around 1.1685 (the high on May 29th) over the past month, reaching a low of 1.1324 (the low on June 24th), before rebounding to 1.1472 (close to the Bollinger Band middle line of 1.1471) but failing to establish a trend extension. This indicates that the exchange rate is still in a post-decline correction phase, rather than having completed a trend reversal. The MACD remains below the zero line, and the negative convergence suggests weakening bearish momentum, but it has not yet provided directional confirmation. The 14-day Relative Strength Index (RSI) is hovering below 50. The main issue for the euro/dollar pair right now is not whether bulls or bears have the upper hand, but rather when volatility will play out. The 1.1320 to 1.1500 range constitutes a more important observation zone in the near term. If the exchange rate continues to be trapped in this range, it indicates that the market is still waiting for a re-evaluation of inflation and central bank expectations.
Currently, the 1.1400 level is influenced by two variables: firstly, the stickiness of inflation on the US dollar side has not been completely resolved; secondly, the cooling of inflation in the Eurozone has reduced the potential for further expansion of the Euro interest rate differential. In other words, the Euro's rebound is more driven by the slowdown in the US dollar's momentum than by a significant strengthening of the Euro's own fundamentals. Therefore, as long as the 1.1500 (psychological level) to 1.1520 (30-day moving average) area cannot be effectively repriced by the market, the Euro/USD pair will likely remain in a sideways rebalancing phase after a decline. The next relevant resistance level is locked at 1.1556 (40-day moving average) near the top of the channel. On the downside, the first significant support appears at 1.1400 (a psychological level). If bearish pressure persists, the previous low of 1.1324 (June 24th low) will become a secondary support level. A break below this level would target the 1.1300 psychological level.
Consider going long on the Euro today at 1.1425, with a stop-loss at 1.1415 and targets at 1.1460 and 1.1470.
Stock Analysis:
Australian ASX 200 Stock Index
Basic Market Overview:
The ASX 200 index rose 120 points, or 1.4%, to close at 8,844 on Friday, rebounding from the previous day's lows to a more than one-week high. Investor sentiment improved ahead of the Independence Day holiday as strong U.S. stock index futures offset Thursday's mixed performance on Wall Street. Traders also disregarded concerns about the Reserve Bank's tightening policies, focusing instead on easing tensions in the Middle East and the reopening of the Strait of Hormuz, as well as an upward revision to domestic private sector activity in June. Gains were spread across most sectors, led by consumer durables, healthcare, non-energy mining, and processing. Gold stocks rose 7.9%, Northern Star rose 10.6%, and Evolution Mining rose 8.6%, as gold rebounded on weak U.S. jobs data. Heavyweight BHP rose 1.6%, Computershare rose 3.0%, while the Big Four banks rose between 0.4% and 2.4%. In contrast, Suncorp's stock fell 4.1% due to weak demand and a downward revision of its growth outlook. The benchmark index rose 0.9% this week, erasing previous losses.
Sector Performance:
Top Performing Sectors of the Week (Sorted by Weekly Gain)
1. Materials Sector (XMJ) | Weekly Gain ≈ +3.1% Strongest Performer
Core Drivers: Continued rebound in international gold prices, stabilization and upward movement in industrial metals such as copper
• Gold Mining Stocks Surge: Northern Star Resources rose 10.6% for the week, Evolution Mining +8.6%, the gold sub-sector of the sector surged 7.9% for the week
• Large Integrated Mining Companies: BHP Billiton, Rio Tinto, and FMG all closed higher; copper mining companies benefited from the recovery in non-ferrous metal prices.
2. Healthcare (XHJ) | Weekly Gain ≈ +1.8%
Continued defensive capital inflows throughout the week, outperforming the market on both mid-week and Friday; leading companies in bio-testing and medical equipment performed steadily, with only a few heavyweight stocks pulling back the gains slightly.
3. Information Technology (IT) (XIJ) | Weekly gain ≈ +1.5%
Leading the market on Monday (sector +3.3%), with strong US tech stocks boosting local software stocks; Computershare rose 3% for the week, while Xero and data center stocks fluctuated higher.
4. Utilities (XUJ) | Weekly gain ≈ +1.1%
A high-dividend defensive sector, with easing expectations of a Reserve Bank of Australia rate hike and declining long-term government bond yields, leading to safe-haven allocations for power and water REITs.
5. Financials (XFJ) | Weekly gain ≈ +0.7%
The four major banks saw slight gains (0.4%–2.4%); however, insurance stock Suncorp fell sharply by 4.1% for the week due to a downward revision of its earnings guidance, suppressing the overall sector gain.
Top Declining Sectors of the Week (Weekly Close Lower)
1. Real Estate (XPJ) | Weekly Decline ≈ -2.2% Weakest performer of the week.
Severe declines on Tuesday and Wednesday, with office and retail property trusts under pressure across the board. Market concerns about weakening Australian house prices, contracting credit demand, and high long-term interest rates weighing on property valuations.
2. Consumer Staples (XSJ) | Weekly Decline ≈ -1.7%
Supermarket leader Coles continued its correction due to negative merger and acquisition regulations. Weak expectations for food and daily necessities retail demand led to continued underperformance compared to the broader market throughout the week.
3. Communication Services (XTJ) | Weekly Decline ≈ -1.3%
Intensified competition among telecom operators and rising capital expenditure expectations continued to put pressure on valuations, with no significant rebound throughout the week.
4. Consumer Discretionary (XDJ) | Weekly Decline ≈ -0.8%
Offline retail, automotive, and leisure sectors weakened amid volatility, with weak consumer confidence suppressing sector performance.
5. Industrials (XNJ) | Weekly Decline ≈ -0.4%
The manufacturing PMI remained in contraction territory, with transportation and engineering companies showing conservative order expectations, slightly underperforming the index.
Technical Analysis:
Last week, the ASX200 exhibited a pattern of initial decline followed by a rebound, closing with a bullish candlestick with a long lower shadow, a weekly gain of approximately 1.2%, closing at 8,844 points. Technically, the short-term rebound momentum is strengthening, but the medium-term trend remains within a consolidation range, with key support at 8,680-8,700 points and resistance at 8,900-8,950 points. The index rebounded from the weekly low near 8,680 points, surging on Friday to close positive for the week, ending two consecutive weeks of correction. The chart shows a bottoming-out and rebound pattern with a long lower shadow, indicating strong buying pressure below. The daily chart shows a V-shaped reversal, breaking through the upper edge of the recent consolidation range on Friday. The RSI (14) is at 58.2, neutral to bullish, having moved out of the oversold zone, indicating increased rebound momentum, but not yet reaching the overbought area. The MACD (12,26) is at -18.94 and about to cross the MACD line, which is close to the signal line; a golden cross would confirm a medium-term rebound. Key support and resistance levels are: Support: 8,680-8,700 points (last week's low + 50-day moving average), 8,600 points (previous key support), 8,500 points (psychological level); Resistance: 8,900-8,950 points (previous consolidation range upper edge), 9,000 points (psychological level), 9,158 points (near historical high).
Trading Strategies:
The following are technical trading ideas only and do not constitute investment advice. Leveraged trading may result in losses exceeding the principal.
1. Short-Term Strategy (1-3 days)
• Entry Timing: Enter when the index pulls back to the 8,750-8,780 point range and the RSI does not fall below 50.
• Target Price: 8,900-8,950 points (first target), with a target of 9,000 points after a breakout.
• Stop-Loss: Below 8,680 points (last week's low; a break below this level invalidates any rebound).
• Position Size: 30%-50%, avoid full-position trading.
2. Medium-Term Strategy (3-5 days)
• Investment Focus: Focus on gold mining, non-energy minerals, and healthcare sectors.
• Entry Conditions: Wait for the index to stabilize above 8,850 points and for the MACD to confirm a golden cross.
• Target Price: 9,000-9,100
Key Risk Warnings 1. Interest Rate Policy Risk (High Risk)
If inflation data continues to exceed the 2%-3% target range, the RBA may raise interest rates again in July or August, putting pressure on stock market valuations; bank net interest margins may be compressed, and the real estate sector faces greater downward pressure.
2. China Economic Risk (High Risk)
The continued slump in the Chinese real estate market may lead to a further decline in demand for Australian building materials and metals; fluctuations in the RMB exchange rate may affect the competitiveness of Australian export companies.
3. Geopolitical Risk (Medium-High Risk)
Although the situation in the Middle East has eased, uncertainty remains regarding shipping safety in the Strait of Hormuz, which may affect oil prices and the global supply chain.
4. Index Concentration Risk (Medium Risk)
The top five weighted stocks in the ASX200 (Commonwealth Bank, BHP, Rio Tinto, CSL, and Wesfarmers) account for more than 35% of the index; fluctuations in any single stock could significantly impact the index performance.
5. Technical Risk (Medium Risk)
The index is expected to trade between 8,850 and 8,900. The current range faces strong resistance; if it fails to break through effectively, it may fall back to the 8,700-8,650 support range. While the weekly RSI has rebounded, it has not yet entered the strong zone (>60), and the strength of the rebound remains to be seen.
Dow Jones Industrial Average
Basic Market Overview:
US stocks were mixed on Thursday, with tech stock volatility impacting pre-holiday trading despite easing concerns about interest rate hikes. The S&P 500 was flat, while the Nasdaq 100 fell 0.8%. Chipmakers fell for the second consecutive day as investors questioned whether AI optimism was pushing valuations above reasonable levels. Recent developments included reports that OpenAI was in talks with the US government to sell a 5% stake, while Meta (-4.9%) indicated it might profit from its excess computing power. Micron fell 7%, Applied Materials fell 7.4%, and AMD fell 4.3%. Despite strong delivery reports, Tesla fell 7.5%. However, the Dow Jones Industrial Average rose 595 points to a new high, with traditional sectors performing strongly. A weaker-than-expected June jobs report delayed expectations of an imminent Federal Reserve rate hike.
Apple rose 4.8%, while Visa and Walmart both rose about 3%. This week, the S&P 500 rose 1.8%, the Nasdaq rose 2.1%, and the Dow Jones Industrial Average rose 2%. The stock market will be closed on Friday for the Independence Day holiday.
Sector Performance:
Leading Sectors:
Top Performing Sectors of the Week (Defensive Rotation Theme)
1. Healthcare (+7.0%, strongest in the market)
Logic: Catalyst from clinical data on weight-loss drugs + defensive funds flocking to the sector amid expectations of rate cuts; Key leading stocks within the Dow Jones: Johnson & Johnson JNJ and Amgen AMGN, both with weekly gains exceeding 4%, low valuations and high dividends hedging against technology volatility.
2. Real Estate REITs (+3.5%)
Lower US Treasury yields eased financing pressure on the real estate sector, increasing the attractiveness of high-dividend stocks; related real estate and financial blue chips within the Dow Jones also strengthened.
3. Utilities (+3.5%): A purely defensive, high-dividend sector. Long-term electricity demand from data centers provides fundamental support, and safe-haven funds continue to flow in.
4. Financials (Banking/Insurance, +2.1%): The interest rate cut expectation curve is flattening, and the long-term and short-term interest rate spreads are expected to improve. Dow Jones components JPMorgan Chase (JPM) and Goldman Sachs (GS) initially declined during the week but rebounded on Thursday, closing higher along with the broader market.
5. Consumer Staples (+1.8%): The resilience of essential consumer blue-chip stocks such as Walmart and WMT is evident, with funds allocating to essential consumer sectors amid expectations of economic slowdown.
Leading Declines:
Dow Jones Industrial Average Components with the Largest Weekly Losses:
1. Caterpillar (CAT): Down 5.6% for the week, driven by cooling expectations for industrial machinery and infrastructure spending, leading to short-term capital outflows from cyclical stocks;
2. Cisco (CSCO): Down 4.5% for the week, driven by weakening expectations for corporate capital expenditures;
3. Goldman Sachs (GS): Down 4.4% for the week, driven by pressure on investment banking and trading business, with a sharp pullback on Wednesday;
4. Nike (NKE): Down 2.3% for the week, driven by weak consumer discretionary demand and disappointing earnings expectations.
Technical Analysis:
The Dow Jones Industrial Average rose 1.38% for the week, closing with a solid bullish candlestick. Thursday saw a single-day surge of 1.14%, setting a new all-time closing high. The weekly bullish trend remains intact, with a clear upward channel. However, the RSI is approaching overbought territory, suggesting a potential short-term technical pullback to the 52300 support level after a recent rally. As long as 52000 is not decisively broken, the medium-term uptrend remains intact. Regarding the moving average system (weekly): The index has firmly established itself above the 5/10/20/50-week moving averages, with all short, medium, and long-term moving averages aligned upwards, indicating that the medium- to long-term uptrend remains intact. The 5-week moving average provides support around 52300. The intraday low this week was 52026, after which the index quickly recovered, turning 52300 from a previous resistance level into a strong support zone. Technical Indicators: RSI (Weekly): Rising to the 68 range, approaching the overbought level of 70, but not yet severely overbought, indicating potential for further upward movement in the short term; however, a slight technical pullback should be anticipated. MACD (Weekly): The red bars continue to expand, with DIF and DEA maintaining an upward trend, indicating ample bullish momentum and no bearish divergence signals.
Trading Strategy:
Buy on dips (Main strategy, overall bullish trend remains unchanged)
Entry Conditions: Price retraces to 13540-13550 and stabilizes, 4-hour chart closes with a bullish candle, and trading volume shrinks;
Stop Loss: Exit if the price breaks below 13495 (20-day moving average), with a stop loss of approximately 87 points;
Tiered Profit Taking: First Profit Taking: 13640-13650 (short-term resistance level, reduce position by 50%); Second Profit Target: 13740 (Yearly High, Exit All Positions)
Logic: The medium-term moving averages remain bullish; the pullback is a technical correction. The interest rate cut cycle is a long-term positive for utilities and real estate stocks.
Short-Selling Strategy (Light Position, Ultra-Short-Term, Only Trading on Pullbacks)
Entry Conditions: Rebound to 13640-13650 encountering resistance; 4-hour chart shows a stalling bearish candlestick.
Stop-Loss: Stop-loss at 13680, 48 points.
Profit Target: 13550 (First Support); Extreme downside target 13490.
Risk Control: Short positions are only suitable for quick intraday trades; long-term holding is not recommended. The risk-reward ratio for short positions is low within a bullish overall market environment.
Risk Warning:
Following weaker-than-expected non-farm payroll data, next week's unexpectedly strong CPI inflation data could dampen expectations of interest rate cuts, while a rebound in US Treasury yields could pressure Dow Jones value stocks.
Selling pressure on tech stocks is spreading, with funds fleeing US blue-chip stocks, triggering a market correction.
Geopolitical conflicts are impacting oil prices and pushing up inflation expectations.
Disclaimer: The information contained herein (1) is proprietary to BCR and/or its content providers; (2) may not be copied or distributed; (3) is not warranted to be accurate, complete or timely; and, (4) does not constitute advice or a recommendation by BCR or its content providers in respect of the investment in financial instruments. Neither BCR or its content providers are responsible for any damages or losses arising from any use of this information. Past performance is no guarantee of future results.
More Coverage






Risk Disclosure:Derivatives are traded over-the-counter on margin, which means they carry a high level of risk and there is a possibility you could lose all of your investment. These products are not suitable for all investors. Please ensure you fully understand the risks and carefully consider your financial situation and trading experience before trading. Seek independent financial advice if necessary before opening an account with BCR.
BCR Co Pty Ltd (Company No. 1975046) is a company incorporated under the laws of the British Virgin Islands, with its registered office at Trident Chambers, Wickham’s Cay 1, Road Town, Tortola, British Virgin Islands, and is licensed and regulated by the British Virgin Islands Financial Services Commission under License No. SIBA/L/19/1122.
Open Bridge Limited (Company No. 16701394) is a company incorporated under the Companies Act 2006 and registered in England and Wales, with its registered address at Kemp House, 160 City Road, London, England, EC1V 2NX. Open Bridge Limited acts solely as a payment processor for BCR Co Pty Ltd and does not provide any financial, trading, or investment services on its behalf. Open Bridge Limited's role is limited to payment processing.


 English
 简体中文
简体中文
 繁體中文
繁體中文
 Bahasa
Melayu
Bahasa
Melayu
 Tiếng
Việt
Tiếng
Việt
 ไทย
ไทย
 日本語
日本語
 한국어
한국어
 ភាសាខ្មែរ
 español