


0
Currency & Commodity Analysis:
US Dollar Index
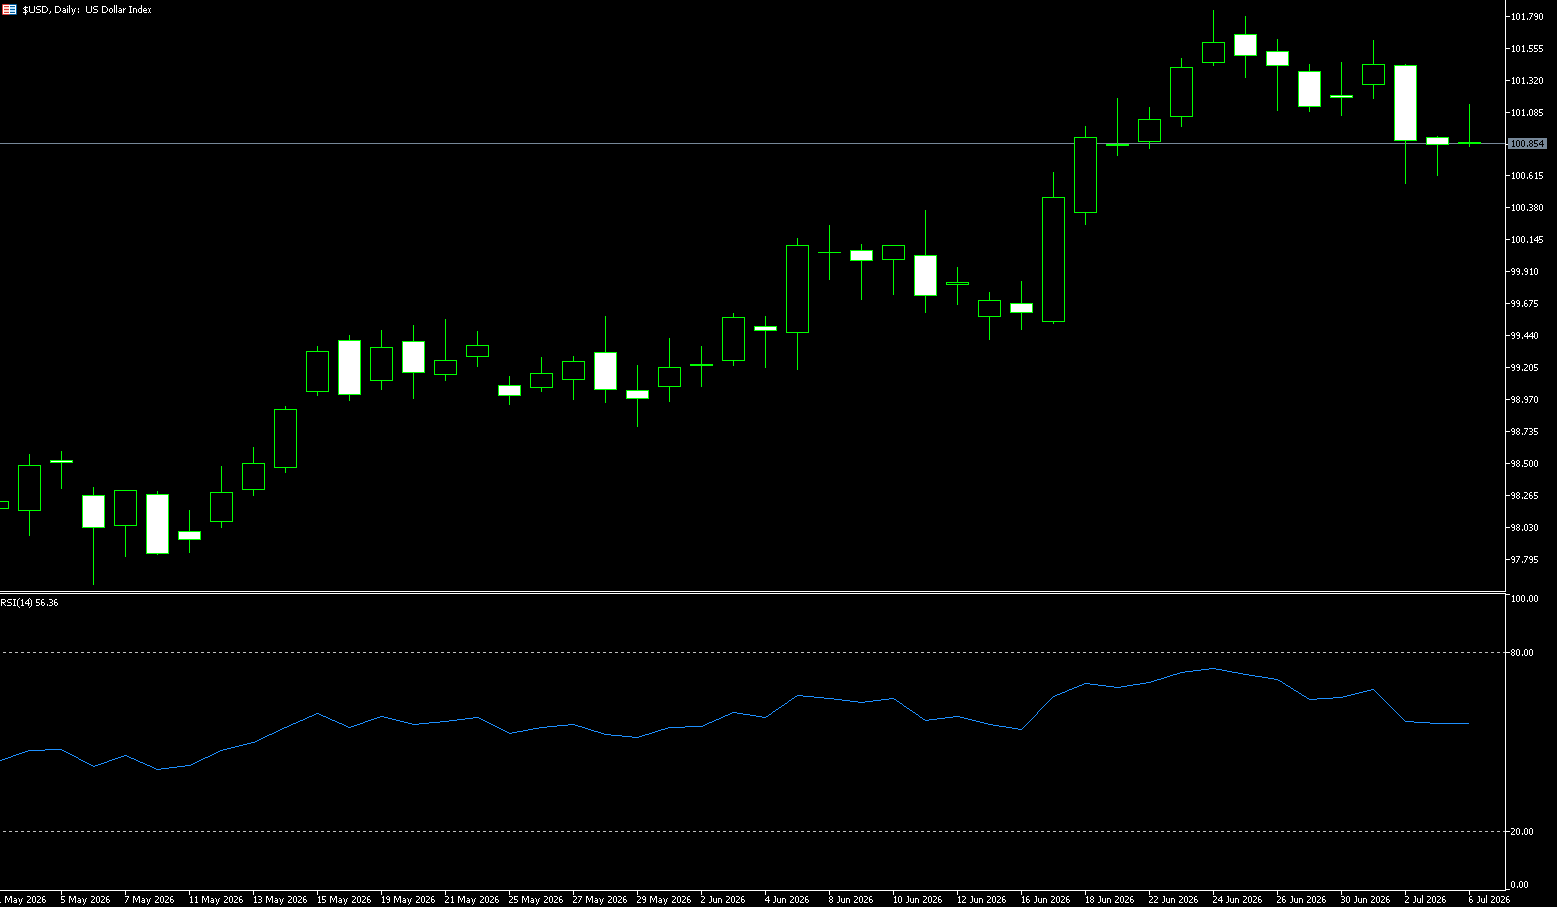
The US dollar index remained below 101 on Monday, as last week's losses, weaker-than-expected US jobs data, and falling oil prices reduced traders' expectations for a Fed rate hike. Last week's data showed that U.S. nonfarm payrolls increased by only 57,000 in June, the smallest increase in four months and far below the forecast of 110,000, prompting the market to reduce bets on a September rate hike. Oil prices also fell slightly, with the resumption of energy flows in the Strait of Hormuz and the prospect of rising OPEC+ production raising concerns about potential oversupply. This helped alleviate inflationary pressures that had previously supported expectations of further rate hikes. Investors are now awaiting the minutes of the Fed's June policy meeting later this week for new clues about the interest rate outlook.
The dollar index has rebounded to just below 101. The current movement of the dollar index reflects a typical tug-of-war structure between "interest rate expectations support" and "weak economic data." The expectation of a continued tight policy from the Fed provides a bottom support for the dollar, but slowing employment and cooling inflation limit its upside. Overall, the dollar remains in a high-level consolidation structure, with short-term fluctuations mainly driven by the interplay between interest rate expectations and economic data. The dollar index is likely to remain in the 100.00–101.50 range. From a daily chart perspective, the US dollar index is maintaining an upward trend above the 100 level, with the overall trend still within a corrective rebound channel. The index has repeatedly tested and stabilized around 101, indicating some support and divergence between bulls and bears in this area. A break above this level is needed to correct the downward structure of this week; the first target is 101.59 (last week's high); a break above this level would target 101.80 (June 24 high) and the 102.00 psychological level. Conversely, if the US dollar index breaks below 100.56 (recent low) and 100.49 (25-day simple moving average), it will open up downside potential to the 100.00 psychological level.
Today, consider shorting the US Dollar Index at 100.97, with a stop-loss at 101.10 and targets at 100.50 and 100.45.
WTI Crude Oil
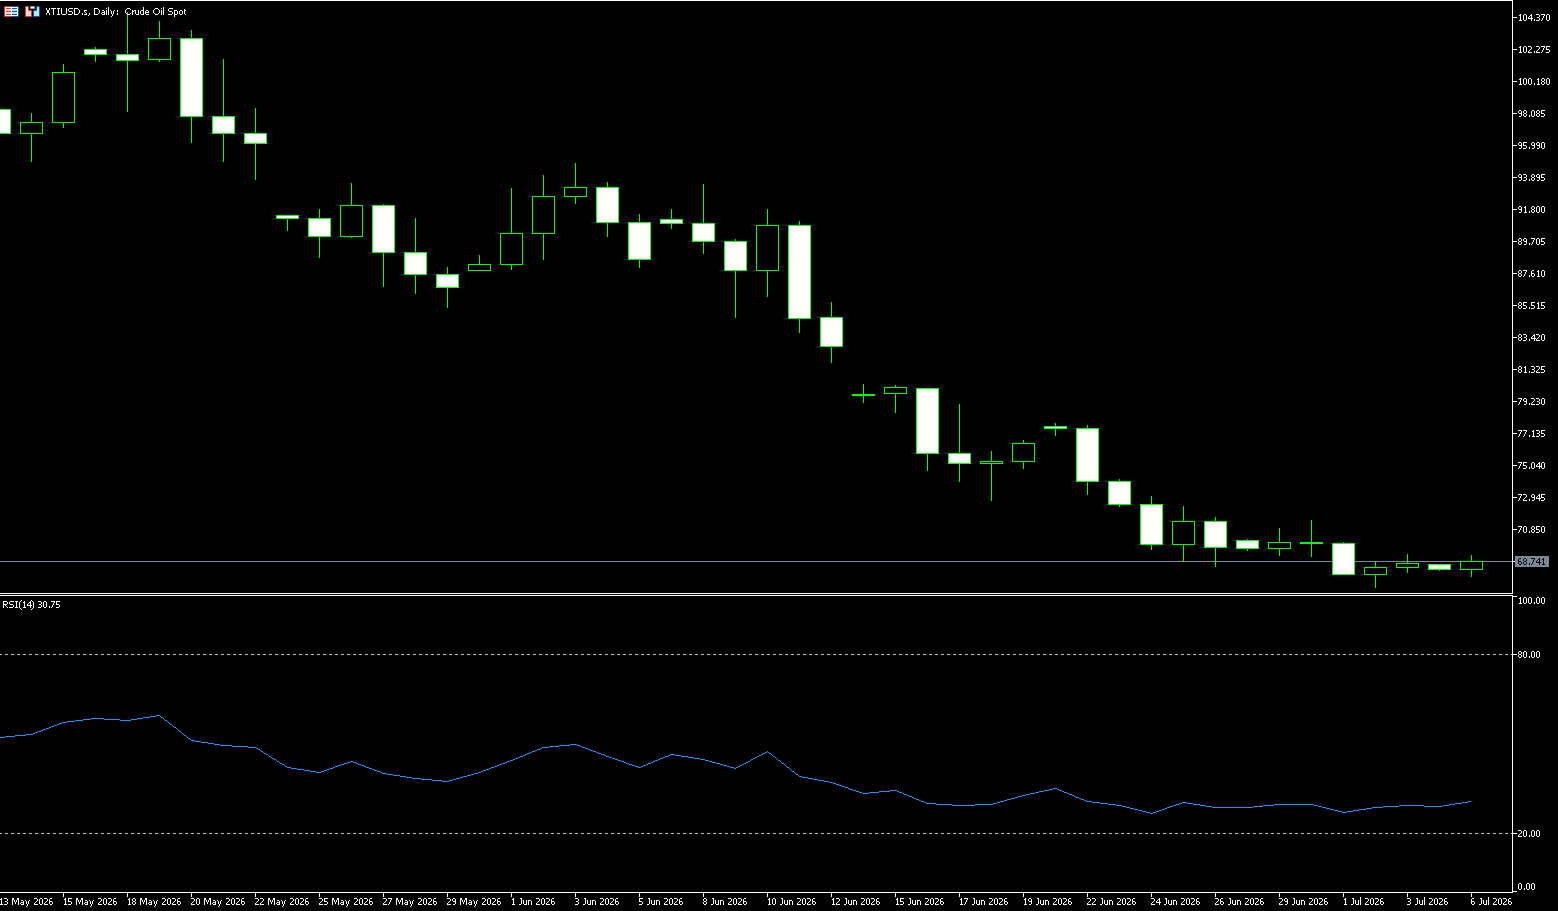
On Monday, WTI crude oil traded around $68.60 per barrel, with prices fluctuating as the market awaits the next round of US-Iran negotiations this week. Meanwhile, the funeral held in Iran on Sunday continues into this week, keeping the market cautious about uncertainties. The next round of talks between the US and Iran is scheduled for July 11 in Pakistan. This dialogue is seen as the first high-level face-to-face consultation between the two countries since signing a temporary ceasefire and waterway reopening agreement in mid-June, focusing heavily on three major issues: sanctions against Iran, frozen Iranian funds, and the nuclear program. The International Atomic Energy Agency stated that although the US-Israeli strikes on Iranian nuclear facilities in 2025-2026 have hampered inspections, there has been no significant new progress in Iran's nuclear program. If the Iranian nuclear issue escalates or negotiations fail, it could trigger a new round of sanctions or conflict, further pushing up oil price volatility. Conversely, a peaceful resolution to the nuclear issue or a return to the agreement framework would unleash Iran's oil export potential, alleviate global supply shortages, and push oil prices down.
Looking ahead, oil price direction depends on the speed of the evolution of a three-way game: the negotiation process (fast or slow), the pace of production resumption (rapid or slow), and insurance/shipping bottlenecks (whether they can be overcome). If waivers are extended and commercial barriers are removed, Iranian exports could increase by another 500,000-1,000,000 barrels per day, which would further suppress oil prices. Conversely, if negotiations break down or the Strait of Hormuz is threatened again, a supply shock would instantly reverse the current positive spread. Currently, WTI crude oil prices are still dominated by bears, with EIA data and easing tensions between the US and Iran being doubly negative factors. Throughout the week, highs gradually shifted downwards, while lows continued to be refreshed. The first resistance level is at $70.00 (a psychological level), followed by $71.38 (the 14-day moving average), and a break above this level would target $73.04 (the high of June 24th). On the downside, watch the $67.05 area (last Thursday's low) and the $66.80 area (a previous area of dense trading and short-term moving average support); a break below these levels would target $64 (61.8% Fibonacci retracement, a medium-term bearish target).
Today, consider going long on crude oil at $68.45, with a stop-loss at $68.30 and targets at $70.00 and $71.00.
Spot Gold
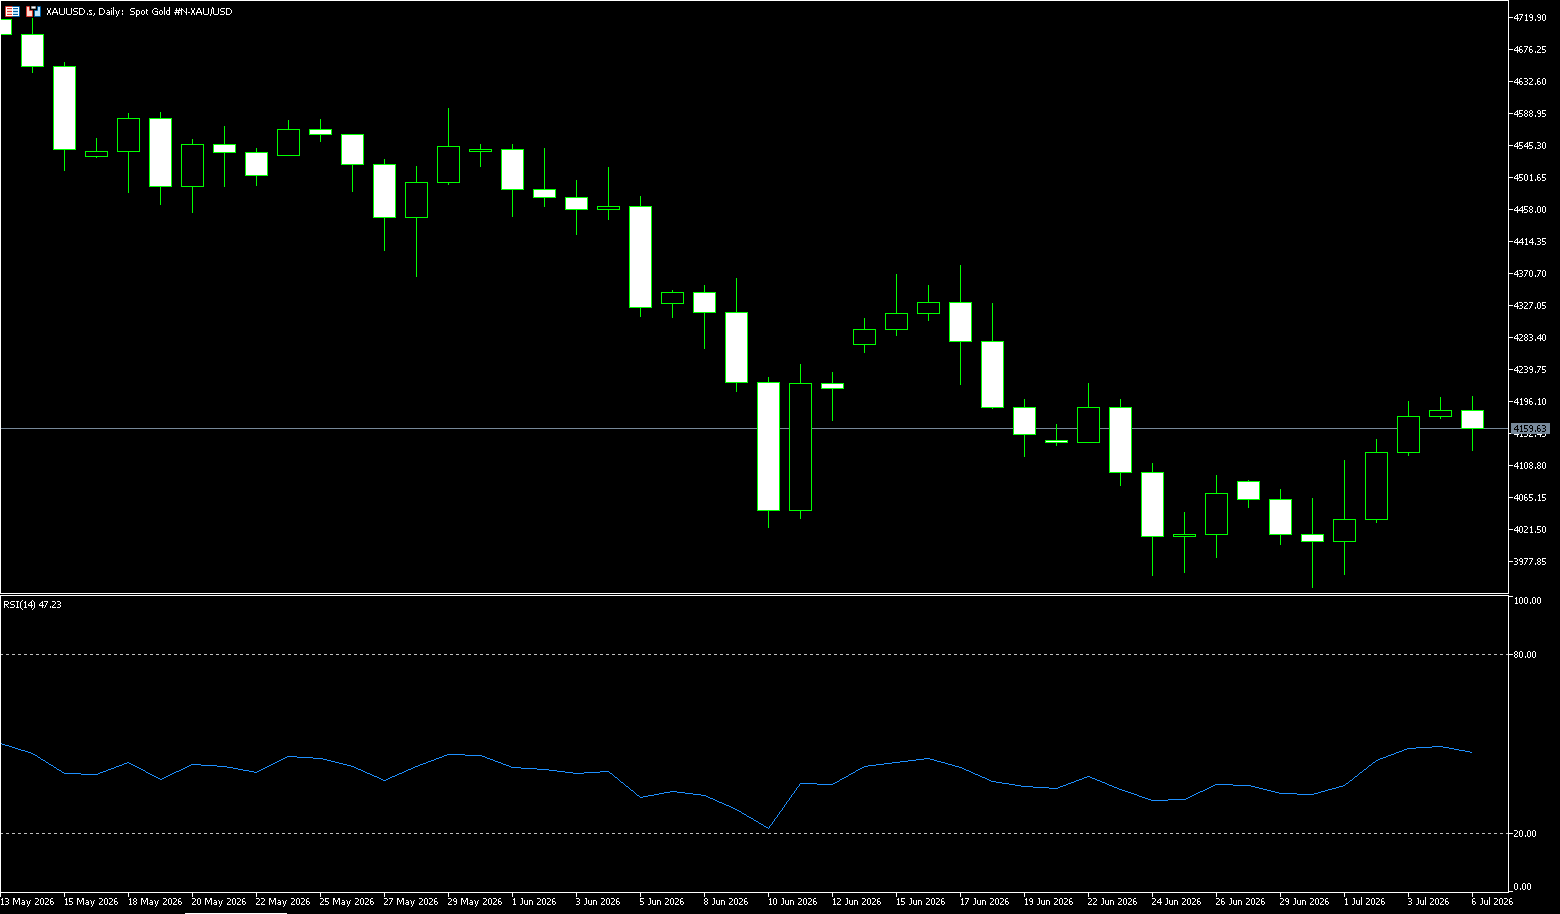
On Monday, spot gold traded around $4,160 per ounce. Lower bets on a September rate hike by the Federal Reserve pushed gold prices higher, while uncertainty surrounding the US-Iran situation and a significant slowdown in job growth were direct drivers of the rebound. Furthermore, expectations of interest rate cuts reduced the opportunity cost of holding gold. Furthermore, data from the World Gold Council shows that central banks net increased their gold reserves by 41 tons in May. Other precious metals also benefited from the weakening dollar, with spot silver, platinum, and palladium rising by 1.9%, 2.3%, and 0.8% respectively, all poised for weekly gains. Spot gold remained range-bound near its two-week high, consistently pressured below the key psychological level of $4,200, failing to break through effectively. This rebound from its lows has lasted for three trading days, with bullish sentiment in the market rising across the board since the release of the US June non-farm payroll data, and gold is poised for its first weekly gain in five weeks.
From a short-term technical perspective, this rebound has reversed the previous weak and volatile pattern. Gold prices have consistently held above all short-term moving averages, indicating a bullish technical structure. The short-term moving averages have formed a sustained support zone, and as long as gold prices do not break below this range, the short-term rebound trend will remain intact. The key resistance and support levels are clearly defined throughout the entire process, serving as a core reference for short-term trading: Resistance levels: First resistance is $4,200 (an important psychological level, repeatedly tested but failed to break through, serving as a short-term dividing line between bulls and bears); Second resistance is $4,251 {30-day moving average}; Third strong resistance is $4,300 {a psychological level}. Only if the gold price continues to hold above $4,200 can it be confirmed that the bulls have completely taken control of the short-term market. Support levels: First key support is $4,120, the core center of this rebound. A decisive break below this level indicates that this rebound is merely a short-term technical correction, not a trend reversal; Second support is the $4,100 level; Third strong support is $4,050.
Today, consider going long on gold at $4,160, with a stop loss at $4,155; targets at $4,230 and $4,220.
AUD/USD
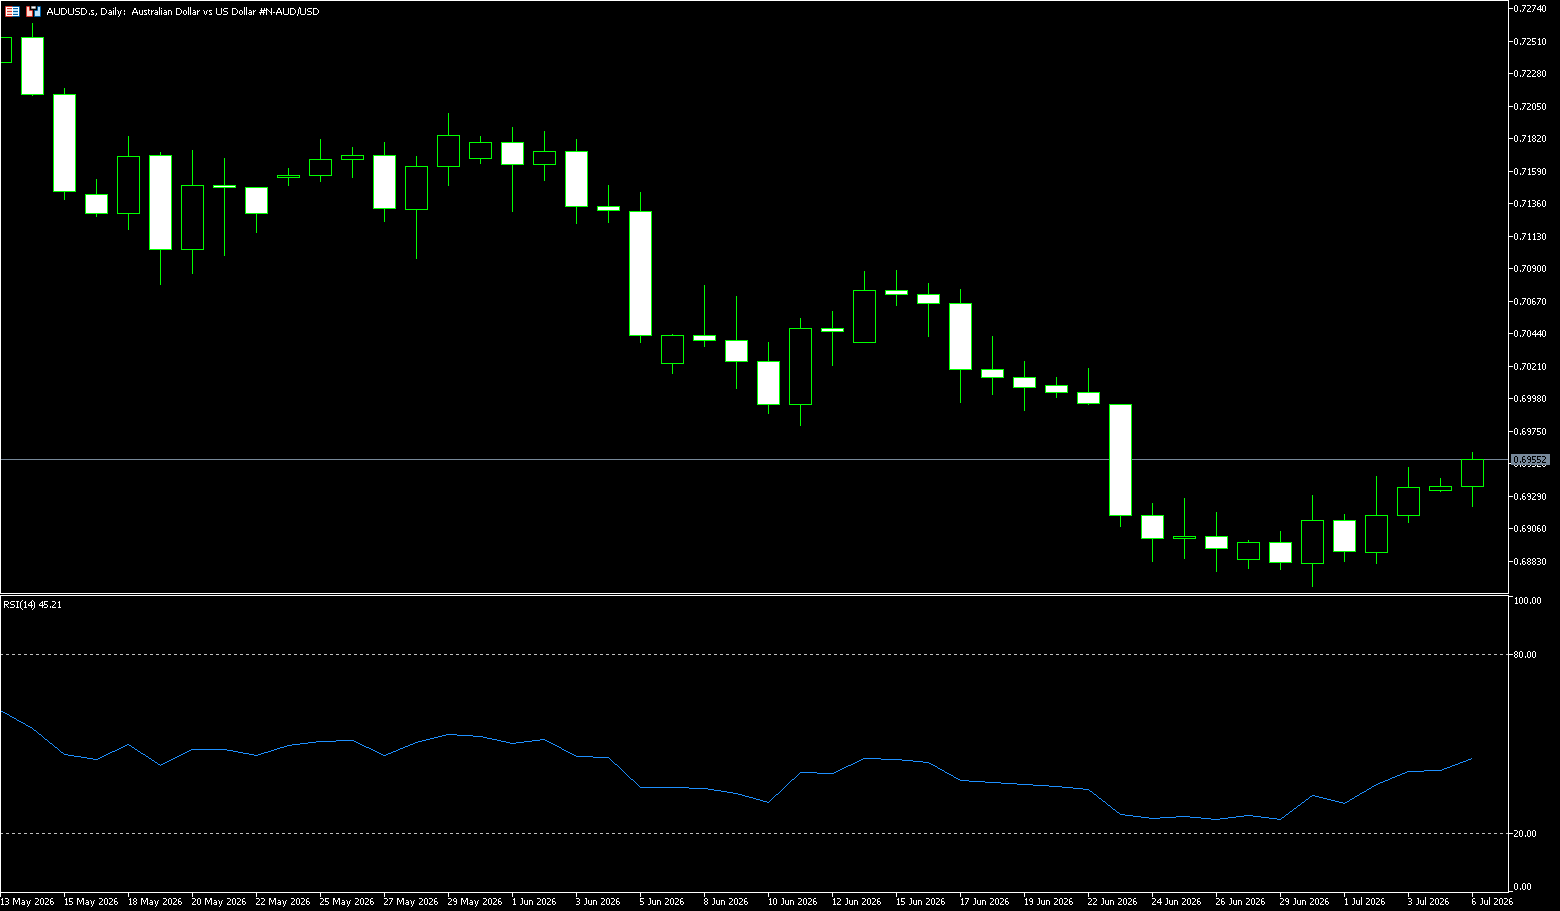
The Australian dollar held firm around US$0.6950, maintaining its 0.7% gain from last week, as a decline in the US dollar combined with market expectations of further interest rate hikes by the Reserve Bank of Australia (RBA). The market continued to assess the RBA's June meeting minutes, which highlighted policymakers' strong concerns about persistent inflation, excess demand, and capacity constraints. Major banks such as the Commonwealth Bank of Australia stated that the minutes highlighted persistent inflationary pressures, while ANZ warned that this increased the risk of further rate hikes in the coming months. Meanwhile, the US dollar was pressured by falling energy prices and a weaker-than-expected US jobs report, prompting the market to lower its expectations for a near-term Federal Reserve rate hike, with futures market pricing showing a 78% probability of no change at the July 29 meeting. Furthermore, while there was no progress in US-Iran peace talks, shipping in the Strait of Hormuz remained stable.
The Australian dollar is currently in a bullish corrective rebound phase after reaching extremely oversold levels at the end of June. Momentum indicators have turned positive, with the 4-hour Relative Strength Index (RSI) (14) climbing into the sub-60 range, and the Moving Average Convergence Divergence (MACD) histogram showing a gradual increase in green bars. However, from a broader perspective, the bearish structure remains. Bulls may encounter some resistance at the 38.2% Fibonacci retracement level of 0.6950, the level of the sell-off two weeks ago, and will then likely linger between the 50.0% and 61.8% Fibonacci retracements, specifically between 0.6976 and 0.7000, which also coincides with the lows of June 11, 17, 18, and 19. On the downside, the intraday low of 0.6900 (a psychological level) and the area around Thursday's low of approximately 0.6885 could provide support for bulls, with key support at the 0.6865 level, the bottom of the June trading range.
Consider going long on the Australian dollar at 0.6943 today, with a stop loss at 0.6930 and targets at 0.6990 and 0.7000.
GBP/USD
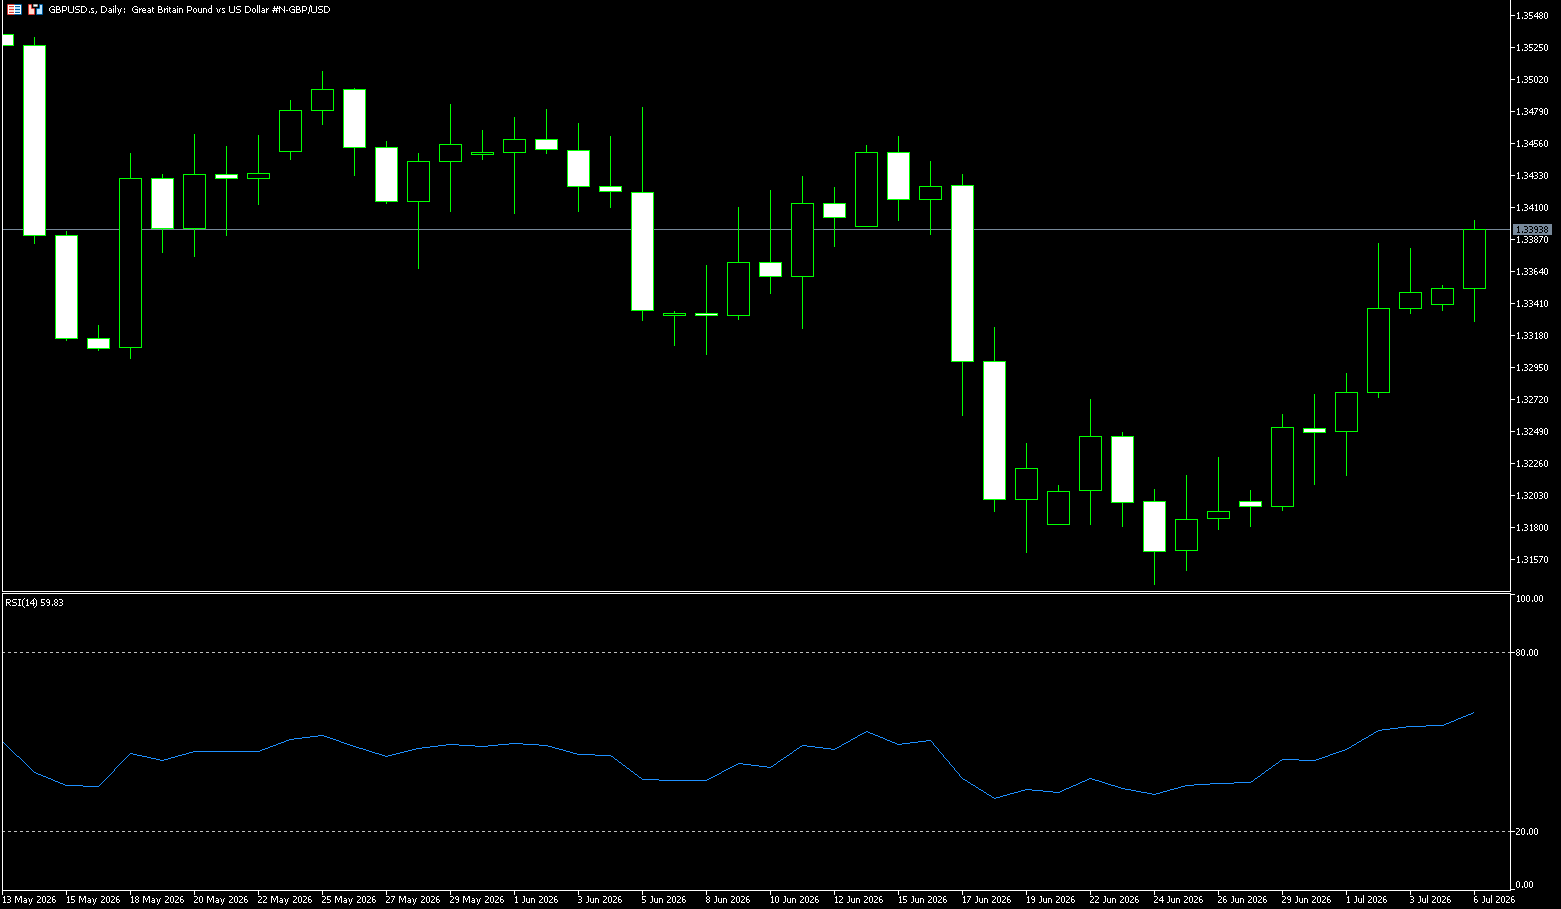
The GBP/USD pair struggled to maintain last week's strong upward momentum, trading in a narrow range around 1.3380 during Monday's Asian session. Furthermore, the spot price remains below the technically important 200-day simple moving average, and investors should remain cautious before betting on a continuation of the recent rebound from the 1.3140 area (the year's low reached in June). The US dollar opened the week strongly amid renewed tensions in the Strait of Hormuz, becoming a key factor weighing on GBP/USD. In fact, the Iranian ambassador to China stated on Saturday that Tehran plans to charge new service fees for ships using the strategic waterway. Although the US rejected Iran's proposal to charge ships using the strait, this statement perpetuated the geopolitical risk premium, further solidifying the safe-haven status of the US dollar. Meanwhile, bets on zero or one Fed rate hikes in 2026 have shifted to one or two hikes, limiting aggressive bets by dollar bulls and providing support for GBP/USD. On the other hand, the pound benefits from Andy Burnham's commitment to strict adherence to lending rules; Burnham is a leading candidate to succeed Keir Starmer as UK Prime Minister.
On the daily chart, GBP/USD is trading at 1.3385, below a key cluster of simple moving averages currently converging around 1.3409, limiting the pair's upside potential in the short term. The price is below this resistance simple moving average, as well as a broader downtrend line from around 1.3520, suggesting the recent rally is more of a corrective bounce within a still-constrained structure. The Relative Strength Index (RSI, 14) is around 53, indicating a slight improvement in momentum, but not enough to offset the pressure from these overhead resistances. Resistance is located at the simple moving average area around 1.3409, followed by the descending trendline around 1.3520, where previous rallies have repeatedly failed. Immediate support is at the Bollinger Band midline and psychological support level around 1.3300, with further support seen around the 9-day moving average. A deeper pullback could attract bargain hunters at the broader 1.3200 level.
Consider going long on GBP at 1.3380 today, with a stop loss at 1.3370 and targets at 1.3435 and 1.3445.
USD/JPY
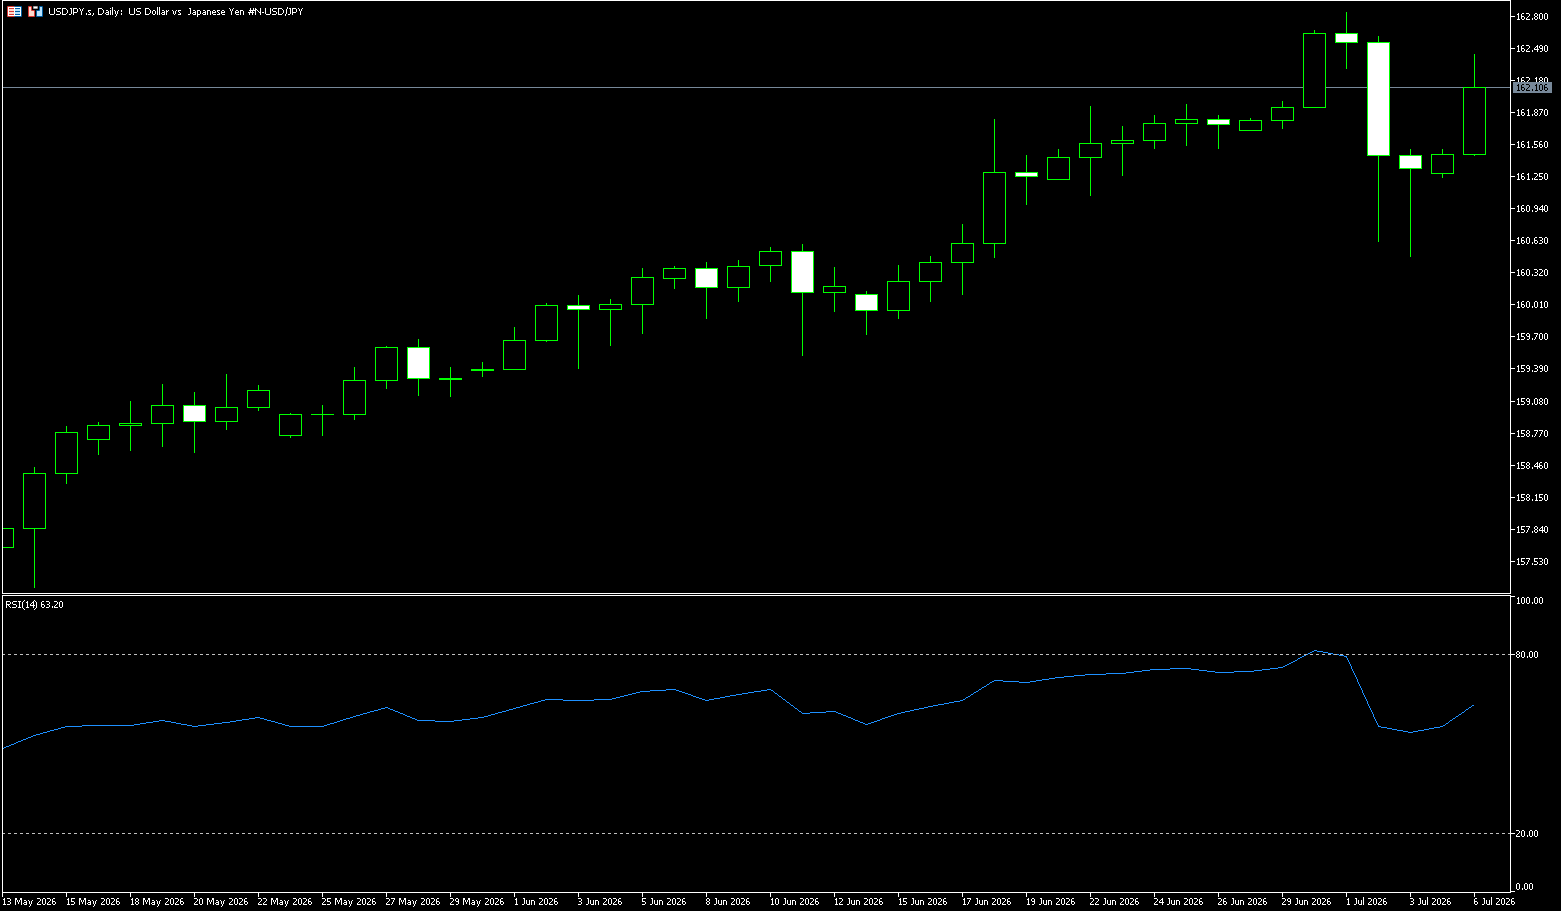
USD/JPY rose for the second consecutive day, trading near 162.00 in Asian trading on Monday. The yen is caught in a high-risk tug-of-war, pressured by soaring import costs, despite the 10-year Japanese government bond yield hitting a 30-year high of 2.79%. Market divergence has intensified, with traders on high alert for possible immediate verbal intervention from Tokyo. The USD/JPY pair rose as the dollar strengthened, supported by market expectations of multiple Federal Reserve rate hikes later this year. This was despite easing global inflation concerns, thanks to the return to normalcy in oil flows through the Strait of Hormuz. Investors are closely watching Wednesday's release of the Fed's June policy meeting minutes for greater clarity on future interest rate movements. Recent U.S. labor data has forced Wall Street to reassess this hawkish outlook. The latest nonfarm payrolls report showed only 57,000 jobs added in the U.S. last month. While the unemployment rate unexpectedly fell to 4.2%, the sharp slowdown in hiring strongly suggests a cooling overall economy.
From a technical perspective, if the USD/JPY pair remains under pressure below the 23.6% Fibonacci retracement level of the May-June rally, it suggests the path of least resistance for the pair remains skewed to the downside. However, intraday declines found some support around the 160.50-160.45 area, which represents the 200-period exponential moving average on the 4-hour chart. This is followed by the 38.2% Fibonacci retracement level near 159.86. This area should provide support for the near-term trend and keep the short-term movement broadly neutral. Meanwhile, the Relative Strength Index (RSI) is around 33, indicating weak momentum after hitting oversold territory, consistent with a consolidation rather than a sharp bearish pattern. However, any further rebound may face initial resistance at the 162 (psychological level). A sustained break above this resistance would help alleviate immediate pressure and pave the way for a further rebound to the 162.84 (last week's high) and 163.00 (psychological level) areas, with an ultimate target of 165.00.
Consider shorting the US dollar at 162.22 today, with a stop loss at 162.40 and targets at 161.30 and 161.40.
EUR/USD
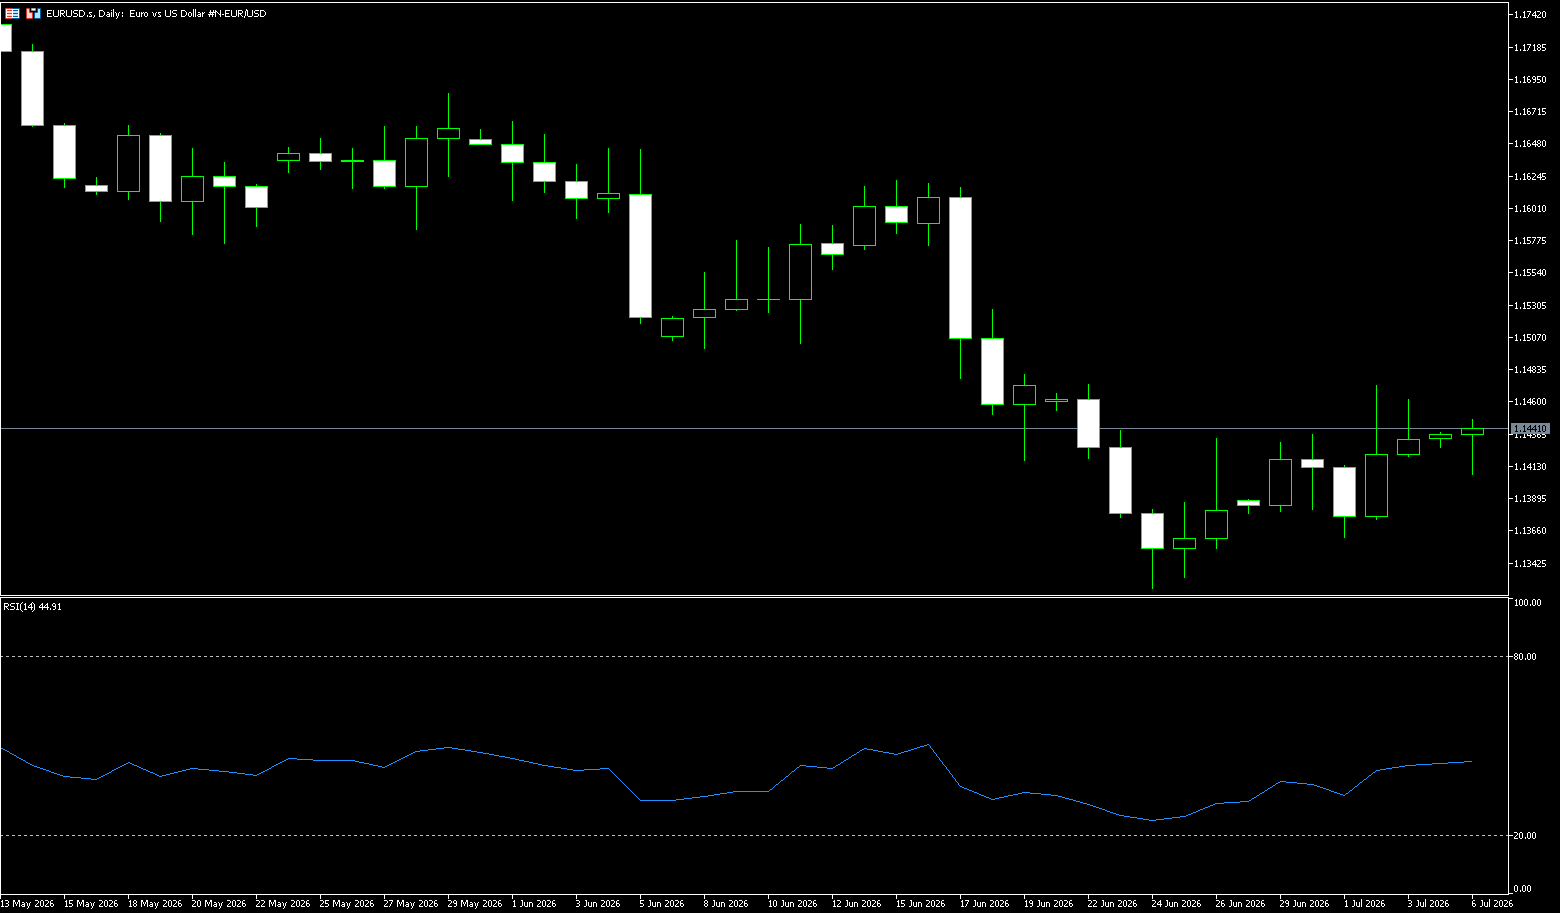
EUR/USD opened the new week flat, trading in a narrow range below 1.1400 during the Asian session. However, the spot price remains near the near two-week high reached last Thursday, with mixed fundamental signals. Despite the fragile interim agreement between the US and Iran, tensions remain high over the Strait of Hormuz, with Iran seeking to strengthen its control over this strategic waterway. This perpetuates a geopolitical risk premium, providing some support for the safe-haven dollar and thus putting resistance to the euro/dollar. However, dollar bulls appeared hesitant, reducing their bets on a Fed rate hike after last week's weak US jobs data. These factors, coupled with a generally positive stock market atmosphere, limited significant dollar appreciation and should also limit the downside for the euro/dollar. Meanwhile, weaker Eurozone inflation data forced investors to reduce their bets on further ECB rate hikes, serving as a warning to aggressive bulls.
From a technical perspective, the euro/dollar exchange rate failed to find support above the 23.6% Fibonacci retracement level of the April-June decline and was rejected near the resistance of the ascending channel on Thursday. Against the backdrop of the recent decline, this upward-sloping channel forms a bearish flag pattern. This keeps the 200-period exponential moving average on the 4-hour chart acting as resistance, further reinforcing the supply zone above. Meanwhile, momentum indicators show a slightly constructive backdrop. In fact, the Relative Strength Index (RSI) is hovering below 60, while the MACD histogram is slightly positive. The next relevant resistance level is locked at 1.1466 near the top of the channel. Above that, the 200-period moving average is at 1.1516, and the 38.2% Fibonacci retracement is at 1.1525, forming a broader resistance barrier, followed by the 1.1587 resistance level. On the downside, the first significant support appears near the lower boundary of the ascending channel at 1.1371, and if bearish pressure persists, the previous channel starting area around 1.1325 will become a secondary support level.
Today, consider going long on the Euro at 1.1430, with a stop-loss at 1.1420 and targets at 1.1480 and 1.1470.
Stock Analysis:
Australian ASX 200 Stock Index
Basic Market Overview:
The Australian Securities Exchange (ASX) 200 index fell 13 points, or 0.2%, to close at 8,831 on Monday, retreating from a one-week high and pulling back from the previous session's rebound. Market sentiment weakened as Australian job advertisements slowed for the third consecutive month in June, highlighting the drag from higher borrowing costs. Caution also prevailed ahead of China's June consumer price index and producer price index data to be released later this week. Nevertheless, strong US stock index futures helped limit losses ahead of the release of the Fed's June meeting minutes.
Meanwhile, a modest inflation gauge released by the Melbourne Institute further indicated easing cost pressures. Industrial services, consumer goods, and non-energy mining led the decline. Shares of the four major banks fell between 0.1% and 1.1%. Supermarket giants Woolworths (-1.1%) and Coles (-0.4%) underperformed, with the sector down 1.6% so far in July, after rising 13% in June. In contrast, Vault Minerals rose 11.6% after Genesis Minerals made a A$5.6 billion takeover offer, surpassing Regis Resources' proposal in May.
Sector Performance:
Top Performing Sectors Today (Only Slight Gains, Overall Weakness)
1. Information Technology (IT): The only sector to show significant strength, closing slightly higher for the day. Driven by overnight gains in overseas US software stocks, international SaaS stocks performed even better: WiseTech Global and Xero rose slightly; hardware distribution stocks weakened, offsetting the gains.
2. Health Care: Slightly flat/slightly higher, with a small inflow of defensive funds seeking safe haven. Large-cap blue-chip CSL saw limited volatility, while medical device stocks showed divergence.
3. Utilities: Slightly higher, with high-dividend defensive attributes attracting a small amount of safe-haven funds, resulting in minimal volatility.
Today's Leading Declining Sectors (Top Losers)
1. Consumer Discretionary (Consumer Discretionary) [Weakest in the Market] Closing down nearly 2%. Interest rate hike expectations dampened consumer spending, leading to weakness across gaming, retail, and food service sectors: Aristocrat Leisure and Wesfarmers fell over 2%, while Domino's Pizza plummeted over 3%.
2. Energy Overnight weakness in crude oil dragged down oil and gas stocks, with Woodside, Santos, and Origin Energy all declining. The oil and gas exploration and refining sectors saw a collective pullback.
3. Financials (Financials / Big Four Banks) Down 0.8%–1.2%. The market priced in an August interest rate hike, raising expectations of bank loan defaults. Concerns about loan loss provisions weighed on bank valuations, causing all four major banks to decline.
Technical Analysis:
The ASX200 index surged 120 points on Friday (July 3rd), closing at 8,844, a gain of 1.4%. Gold mining, resources, and banking sectors led the gains. Stronger stock index futures before the US stock market closed boosted risk appetite, and the index rose above short-term moving averages. Monday saw the index consolidating within a rebound range, with the battle between bulls and bears concentrated in the core 8800-8900 range. Since May, the index has been trapped in a wide range of 8680-8950, failing to establish a clear trend. Monday continued this range-bound trading pattern, with the strategy before a breakout primarily focused on buying low and selling high. Currently, the index has stabilized above the 20-day EMA (8820), but is facing resistance at the 50-day moving average of 8910. Short-term moving averages are turning upwards, while medium-term moving averages remain flat, indicating a bottoming-out rebound within a consolidation range, not yet a strong bullish trend. The RSI (14) is in the 57 range, not yet overbought, and still has slight upside potential, but is approaching the 60 resistance level. The MACD: the daily golden cross continues, the red bars are expanding moderately, the rebound momentum is moderate, and there are no explosive bullish signals. The index has been trapped in a wide range of 8680-8950 since May, without forming a clear trend. Monday will continue the range-bound trading pattern; before a breakout, the strategy should be to buy low and sell high.
Trading Strategy:
The following is for technical trading purposes only and does not constitute investment advice. Leveraged trading may result in losses exceeding the principal.
Buy on Dips (Main Strategy: Prioritize long positions if support levels hold)
Applicable Scenarios: Opening price retraces to the 8800-8820 support zone and stabilizes; 1-hour candlestick closes positive; price does not decisively break below 8800.
1. Entry Range: 8805-8825
2. First Intraday Profit Take: 8890-8900 (Reduce position size by 60% if encountering resistance)
3. Swing Trading Profit Take (3-day Holding): 8950-8980
4. Hard Stop-Loss: Decrease below 8790 (Exit if closing price/1-hour closing price breaks below, loss control ≤40 points)
5. Risk Control Rules: Single position size should not exceed 5% of total capital; do not add to long positions if the price does not break above 8900.
Shorting on Resistance (Secondary Strategy: Sell at Resistance Levels)
Applicable Scenarios: Encountering resistance at 8890-8910, long upper shadow candlestick, and shrinking volume.
1. Entry Range: 8890-8910
2. First Intraday Profit Take: 8830-8840
3. Swing Profit Take: 8760-8780
4. Hard Stop-Loss: Exit if the price closes above 8930; loss ≤ 30 points.
5. Risk Management Rules: Shorting on resistance is a counter-trend trade; position size is only 1/2 of a long position; no overnight holdings.
Key Risk Warnings:
Macroeconomic Policy Risks
The Reserve Bank of Australia (RBA) maintained a high interest rate of 4.35%, and the market still expects a 25bp rate hike this year. If inflation data this week is strong, it will directly suppress the banking, real estate, and consumer sectors, causing the index to quickly fall below 8700, ending the rebound.
Technical Structural Risks
The index has been trading within a long-term range without a clear trend, making it highly susceptible to false breakouts/false breakdowns: If it briefly pierces 8910 on Monday but lacks sufficient volume, it will likely plunge quickly; if it briefly breaks below 8800 without significant volume following short selling, it will likely recover quickly, and chasing orders can easily lead to losses.
Funding and Liquidity Risks
Australian market daily trading volume is lower than that of US stocks, making slippage at key intraday price levels likely; frequent short-term trading will amplify transaction costs, and frequent switching between long and short positions in a volatile market can easily result in consecutive small losses.
Japan Stock Market Index (JP225)
Basic Market Overview:
The Nikkei 225 index fell 0.01% to close at 69,737 points, while the broader Topix index rose 0.92% to 4,102 points. Monday's trading was mixed, with Japanese stocks lacking a clear direction. Gains in industrial and consumer stocks were offset by weakness in technology stocks. These movements reflect a continued rotation of funds from technology companies to other sectors amid growing concerns about the sustainability of AI trading. Investors have become more cautious about overcapacity and increasingly fierce competition among AI providers, particularly from China.
The decline in technology and AI-related stocks was primarily led by Kioxia Holdings (-2.1%), Taiyo Yuden (-10.6%), and SoftBank Group (-3.1%). Meanwhile, Mitsubishi Heavy Industries (8.4%), Shin-Etsu Chemical (6.6%), and Fast Retailing (2.9%) saw solid gains. Investors are now awaiting a series of key economic reports this week, including household spending, Producer Price Index (PPI), and machine tool orders data.
Sector Performance:
Leading Sectors:
Intraday Leading Sectors
1. Heavy Industry / High-End Machinery Manufacturing (Core Leading Sector)
Logic: Strong orders for industrial equipment, shipbuilding, and robot components; safe-haven funds favoring undervalued cyclical manufacturing.
Representative Stocks: Mitsubishi Heavy Industries, Mitsui Shipbuilding, Ishikawajima-Harima Heavy Industries; intraday gains generally ranged from 1.5% to 8.4%.
2. Innovative Drugs / Biopharmaceuticals
Logic: Global innovative drug market recovery highlights defensive attributes; funds avoid high-flying tech stocks and take profits.
Representatives: Sumitomo Dai Nippon Pharmaceutical, Chugai Pharmaceutical, gains 3%–5.5%.
3. Consumer Staples (Defensive Sector)
Logic: Safe-haven funds allocate to hedge against tech stock correction risks; FMCG and food retail are relatively resilient.
Representatives: Fast Retailing (Uniqlo), a leading Japanese food company, closed slightly higher.
Leading Declines:
Sectors Leading Declines Today (Main Dragging Down the Index)
1. AI / Semiconductor Equipment, Memory Chips (Weakest Sector of the Day)
Core Negative Factors: Overseas institutions are bearish on memory overcapacity, AI computing power demand is slowing, and high-flying chip stocks saw concentrated profit-taking.
Declining Stocks: Kioxia, Shin-Etsu Chemical, Advantest, Taiyo Yuden, generally down 2%–10%.
2. Integrated Internet/Platform Technology
Weight Drag: SoftBank Group fell 1.57%, with valuations of its AI investment assets under pressure, significantly dragging down the index weight.
3. Human Resources and High-End Services Stocks
Representative: Recruit Holdings, Advertising and Media Sector. Weakening economic recovery expectations led to profit-taking and exits, resulting in a 1%–1.2% decline.
Technical Analysis:
Today's Closing Price: 69737.69, a slight decrease of 0.01%. The market opened higher but closed lower throughout the day, exhibiting high-level consolidation and a clear divergence between bulls and bears. Price Level: After breaking through the psychological barrier of 70000, the price has faced continuous pressure, with bullish momentum clearly weakening. JP225 closed with a high-level doji on Monday, a signal of high-level consolidation, entering a range of 69000–70000. The medium-term bullish trend remains intact, but short-term downward pressure is increasing. Operationally, the strategy should focus on buying low and selling high within a range, with light positions and strict stop-loss orders. Closely monitor the 70,000 resistance level and the 68,600 key support level; if these levels are broken, switch to a one-sided trading strategy accordingly. Simultaneously, continuously monitor the yen exchange rate and overnight US stock market movements to control risk. Technical indicators: RSI (14): fell back to around 62, retreating from the overbought zone, indicating weakening bullish momentum, but not yet entering oversold territory; MACD: the daily red bars continue to shorten, and the fast and slow lines show signs of turning downwards, indicating a gradual accumulation of short-term bearish momentum; and trading volume: Monday's trading volume was slightly lower than Friday's, with no new funds following the rally, casting doubt on the sustainability of the rebound.
Trading Strategy:
Short-term Trading Strategy (Intraday + 3-5 Day Swing)
(I) Long Position Strategy (Light Position for Rebound)
Entry Conditions
If the price retraces to the 69300-69400 range and stabilizes, and the 1-hour chart shows a bullish candle, a light long position can be initiated; for a more conservative approach, wait for a retracement to the support level near 69000 before entering.
Targets and Stop-loss
First Take-Profit: 69900-70000 (Reduce position by half if encountering resistance); Second Take-Profit: If it breaks through 70000, target 70400;
Strict Stop-Loss: 180-220 points below entry; exit unconditionally if it falls below 68900.
(II) Short Selling Strategy (Betting on a High-Level Pullback)
Entry Conditions
Sell short when the price rebounds to 69900-70000 and encounters resistance, or when a long upper shadow candlestick appears on the 1-hour chart; if it breaks below 69300 with significant volume, continue shorting.
Targets and Stop Losses
First Take Profit: 69300; Second Take Profit: 68900;
Stop Loss: Above 70250, exit if it breaks below 70400.
Position Size: Maintain a light position size, avoiding heavy bets on a one-sided decline.
Risk Warning:
Core Exchange Rate Risk (Largest Influencing Factor)
The USD/JPY exchange rate continues to fluctuate at high levels. A rapid appreciation of the yen will directly suppress leading Nikkei export sectors (automobiles, electronics, precision manufacturing), triggering a rapid index pullback; if the yen depreciates significantly again, it will be a short-term positive for the index, and exchange rate fluctuations can easily create gaps in the index.
External Market Linkage Risks
Overnight fluctuations in US tech and Nasdaq stocks directly impacted Japanese stocks the following day; a sharp drop in US stocks could trigger a collective lower opening in Asian markets, amplifying the risk of a pullback in the JP225 ETF; global geopolitical conflicts (Middle East situation) fueled risk aversion, leading to capital outflows from risk assets and putting downward pressure on Japanese stocks.
Monetary Policy and Funding Risks
The Bank of Japan maintained its interest rate at 1%, but the market continues to expect a second rate hike; any hawkish comments could trigger large-scale unwinding of carry trades, leading to a concentrated sell-off of Japanese stocks by foreign investors, causing a rapid and sharp decline. Recently, foreign investors have been continuously reducing their holdings of heavyweight Japanese tech stocks at high levels, putting pressure on the overall market.
Disclaimer: The information contained herein (1) is proprietary to BCR and/or its content providers; (2) may not be copied or distributed; (3) is not warranted to be accurate, complete or timely; and, (4) does not constitute advice or a recommendation by BCR or its content providers in respect of the investment in financial instruments. Neither BCR or its content providers are responsible for any damages or losses arising from any use of this information. Past performance is no guarantee of future results.
More Coverage





Risk Disclosure:Derivatives are traded over-the-counter on margin, which means they carry a high level of risk and there is a possibility you could lose all of your investment. These products are not suitable for all investors. Please ensure you fully understand the risks and carefully consider your financial situation and trading experience before trading. Seek independent financial advice if necessary before opening an account with BCR.
BCR Co Pty Ltd (Company No. 1975046) is a company incorporated under the laws of the British Virgin Islands, with its registered office at Trident Chambers, Wickham’s Cay 1, Road Town, Tortola, British Virgin Islands, and is licensed and regulated by the British Virgin Islands Financial Services Commission under License No. SIBA/L/19/1122.
Open Bridge Limited (Company No. 16701394) is a company incorporated under the Companies Act 2006 and registered in England and Wales, with its registered address at Kemp House, 160 City Road, London, England, EC1V 2NX. Open Bridge Limited acts solely as a payment processor for BCR Co Pty Ltd and does not provide any financial, trading, or investment services on its behalf. Open Bridge Limited's role is limited to payment processing.


 English
 简体中文
简体中文
 繁體中文
繁體中文
 Bahasa
Melayu
Bahasa
Melayu
 Tiếng
Việt
Tiếng
Việt
 ไทย
ไทย
 日本語
日本語
 한국어
한국어
 ភាសាខ្មែរ
 español