


0
US Dollar Index
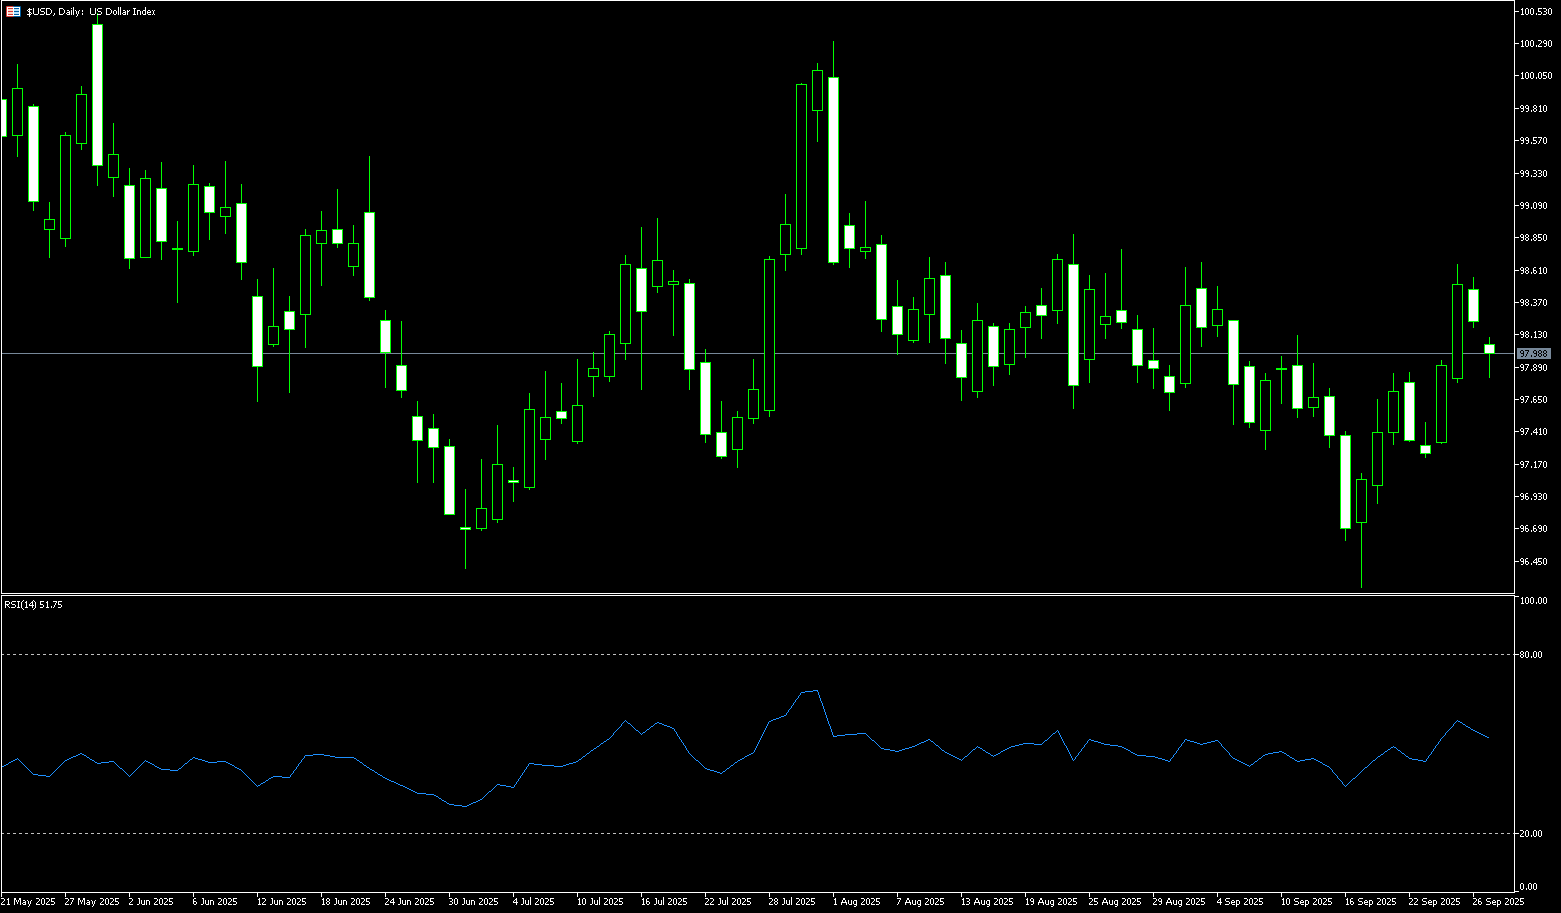
The US dollar index traded strongly around 97.95 during Monday's trading session. The index declined due to the increasing risk of a US government shutdown. This week, dollar traders will be focused on several key events. The September ISM manufacturing and services PMIs will be released on Wednesday and Friday, respectively. Friday's September non-farm payroll report will be a key focus. Both the previous two monthly reports were well below expectations and saw significant downward revisions, pointing to a significant slowdown in overall employment growth. A further weak September figure could prompt traders to sell the dollar again, while a positive surprise could trigger the opposite reaction. Wednesday's ADP private payroll report will provide leading signals on employment. Additionally, several Fed officials will deliver speeches, which could further clarify the policy path. The CME FedWatch tool indicates an 89.8% probability of a 25 basis point rate cut at the next meeting, down slightly from 92% a week ago. Strong data this week could further reduce this probability, pushing the dollar to continue its weekly gains.
The daily chart shows the US Dollar Index retreating from its weekly high of 98.60. This level is slightly below last Thursday's high of 98.62 and the double-peak resistance of 98.63 (the upper Bollinger Band), reflecting market hesitation around key technical levels. The Dollar Index's upward trend is losing momentum near the upper Fibonacci retracement level of 98.71, where technical and fundamental resistance are overlapping. A clear break above 99.00 (the round number mark) and 99.05 (the 134-day simple moving average) increases the probability of a breakout. Such a break would pave the way for the Dollar Index towards 99.30 (the 76.4% Fibonacci retracement level). However, if it consolidates below 98.00, it could test the combined support of the Bollinger Band 97.69 and 97.76 (the 38.2% Fibonacci retracement level), followed by 97.17 (the 23.6% Fibonacci retracement level).
Consider shorting the US Dollar Index at 98.08 today. Stop-loss: 98.20. Targets: 97.70, 97.60.
WTI Spot Crude Oil
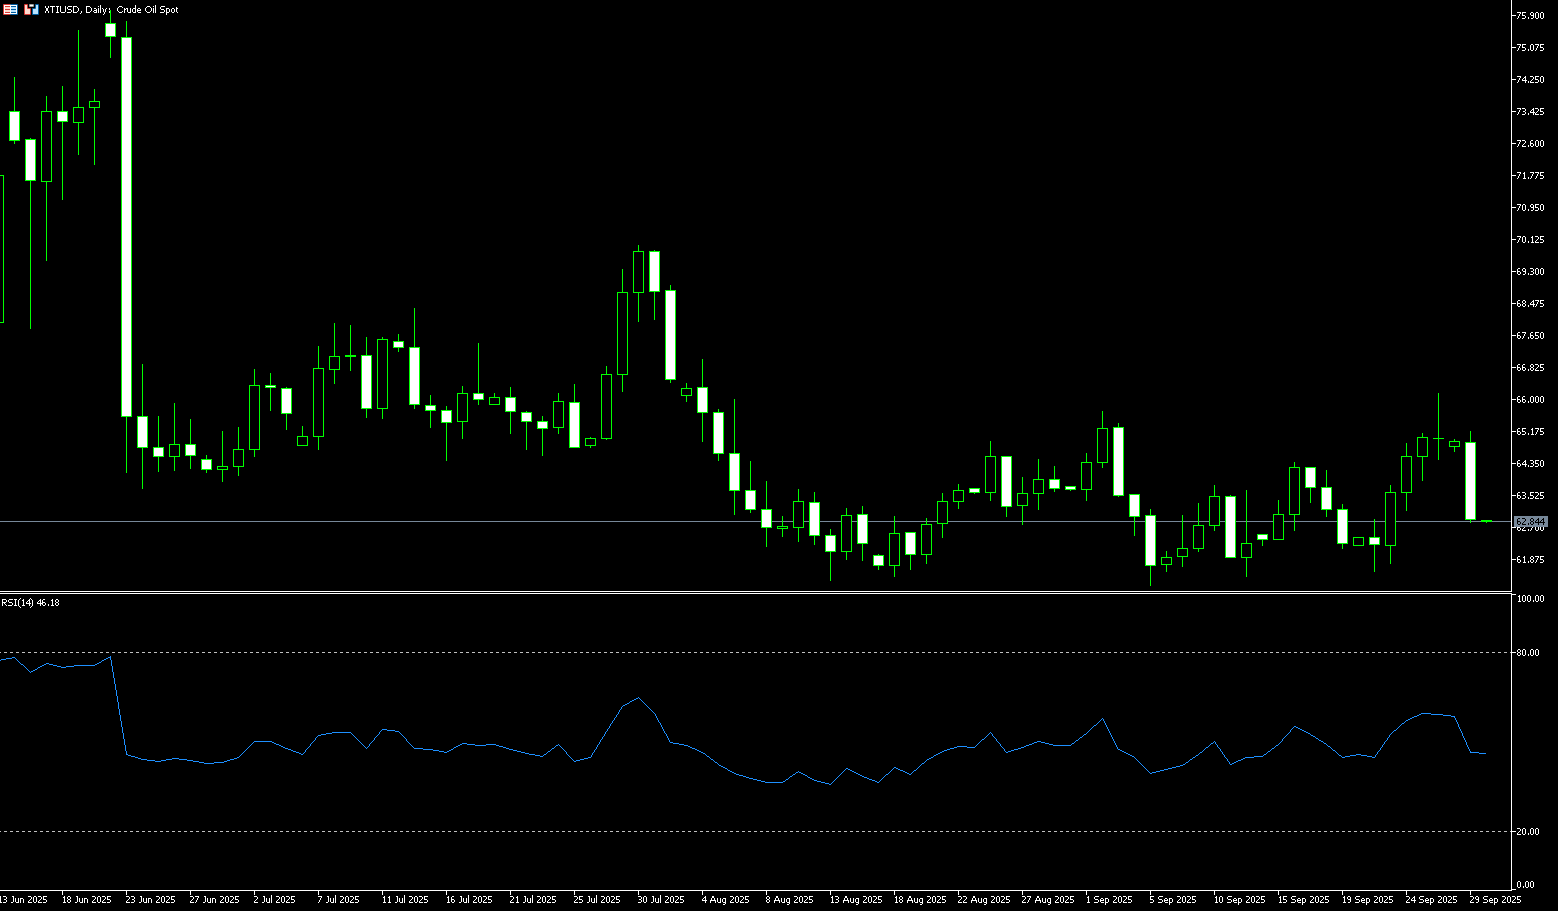
OPEC+ plans another production increase, and the resumption of Kurdish exports is putting pressure on oil prices, sending them plummeting over 3% to around $63.00. Last Friday, they hit a high of $66.19 per barrel since early August. However, the Kurdistan Region resumed crude oil exports on Saturday, and Russia's Foreign Minister expressed a willingness to resolve the conflict through dialogue and expressed some hope for dialogue with the US, limiting price gains. Currently, the crude oil market is oscillating between concerns about supply disruptions caused by the Russia-Ukraine conflict and expectations of potential incremental supply from the reopening of Iraq's export pipeline, exhibiting an overall resilient upward trend. WTI crude oil futures rose 4.54% for the week, while Brent crude oil recorded a 3.16% weekly gain. The key focus lies in the interplay between the immediate boost from Russia's fuel export ban and the potential downward pressure from global inventory dynamics. Traders should be wary of any signals regarding quota adjustments from next week's OPEC+ meeting. This week saw a flurry of events in the crude oil market, with geopolitical and macroeconomic data intertwined, driving oil price fluctuations.
Last week, crude oil prices saw a volatile tug-of-war between bulls and bears, with oversupply and geopolitical concerns balancing each other. The market continued its upward trend this week. While oil prices have been resilient amidst this week's geopolitical events, caution is warranted as inventory data tests bullish sentiment. Looking at the daily chart, after last week's strong rebound, WTI crude oil is facing strong resistance between $65.61 (the 50.0% Fibonacci retracement level from $70.02 to $61.20) and $66.49 (the 200-day moving average). A breakout could see prices range-bound between $67.94 (the 76.4% Fibonacci retracement level from $70.02 to $61.20) and $68.00. On the downside, watch for the $63.00 mark, followed by $61.87 (the September 23 low). A break below this level could lead to a test of the $61.00 support level.
Consider going long on crude oil at 62.80 today. Stop-loss: 62.60, Target: 64.20, 64.50.
Spot Gold
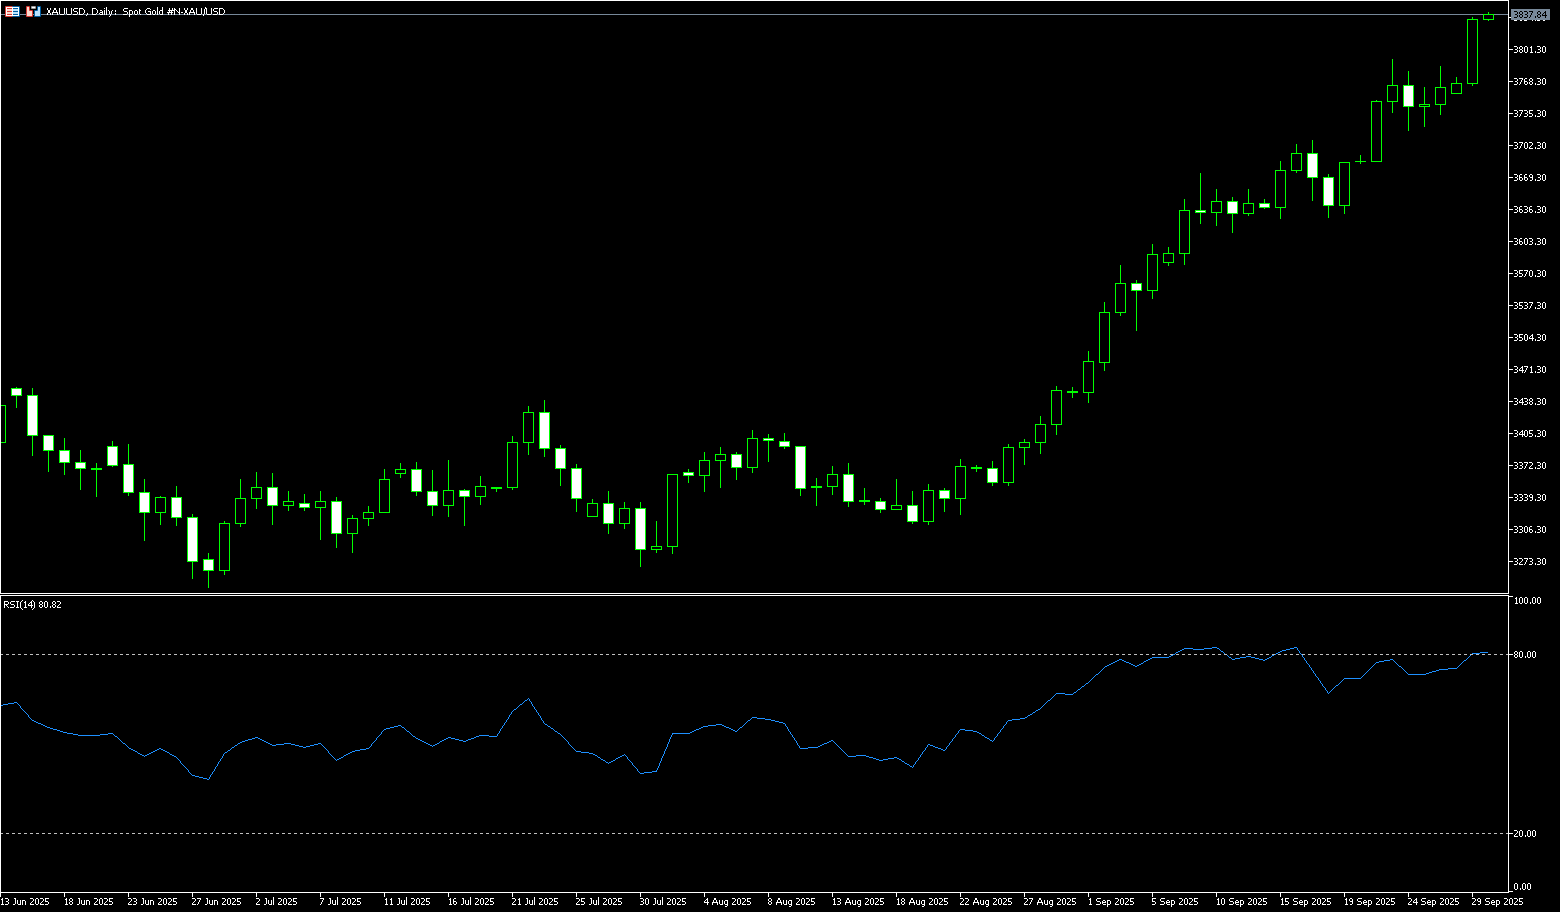
Gold prices continued their upward trend during Monday's European trading session, breaking through the key $3,800 per ounce mark for the first time, reaching a high of $3,834/ounce, an increase of approximately 1.95%. This upward trend was driven by the latest US inflation data, which met market expectations and reinforced investors' belief that the Federal Reserve will continue to cut interest rates this year. The US dollar index continued to weaken. Low interest rates reduce the opportunity cost of holding non-interest-bearing gold, providing strong support for gold prices. Coupled with ongoing geopolitical uncertainty and the risk of a US government shutdown, market demand for safe-haven assets like gold has further intensified. Traders will closely monitor the Federal Reserve's speech later this week. Any hawkish comments from Fed officials could boost the US dollar, putting pressure on dollar-denominated commodity prices.
Gold prices resumed their upward trend before the weekend, pushing higher to a new all-time high of $3,829.50 at the start of this week, breaking through the psychologically important $3,800 level and approaching the key $4,000 market high. The 14-day Relative Strength Index (RSI), while in overbought territory on the daily chart, remains between 75 and 80, suggesting bullish momentum. On the other hand, a break below the 5-day simple moving average of $3,765 could lead to further declines. The next support levels are $3,700 (round-number mark), followed by the 20-day simple moving average of $3,666. Conversely, a sustained breakout could pave the way for a challenge to the all-time high of $3,850. Any follow-through buying and selling above $3,850 would be seen as a new trigger for gold bulls, potentially pushing prices towards $3,900.
Consider going long on gold at 3,828 today, with a stop-loss at 3,824 and targets at 3,850 and 3,860.
AUD/USD
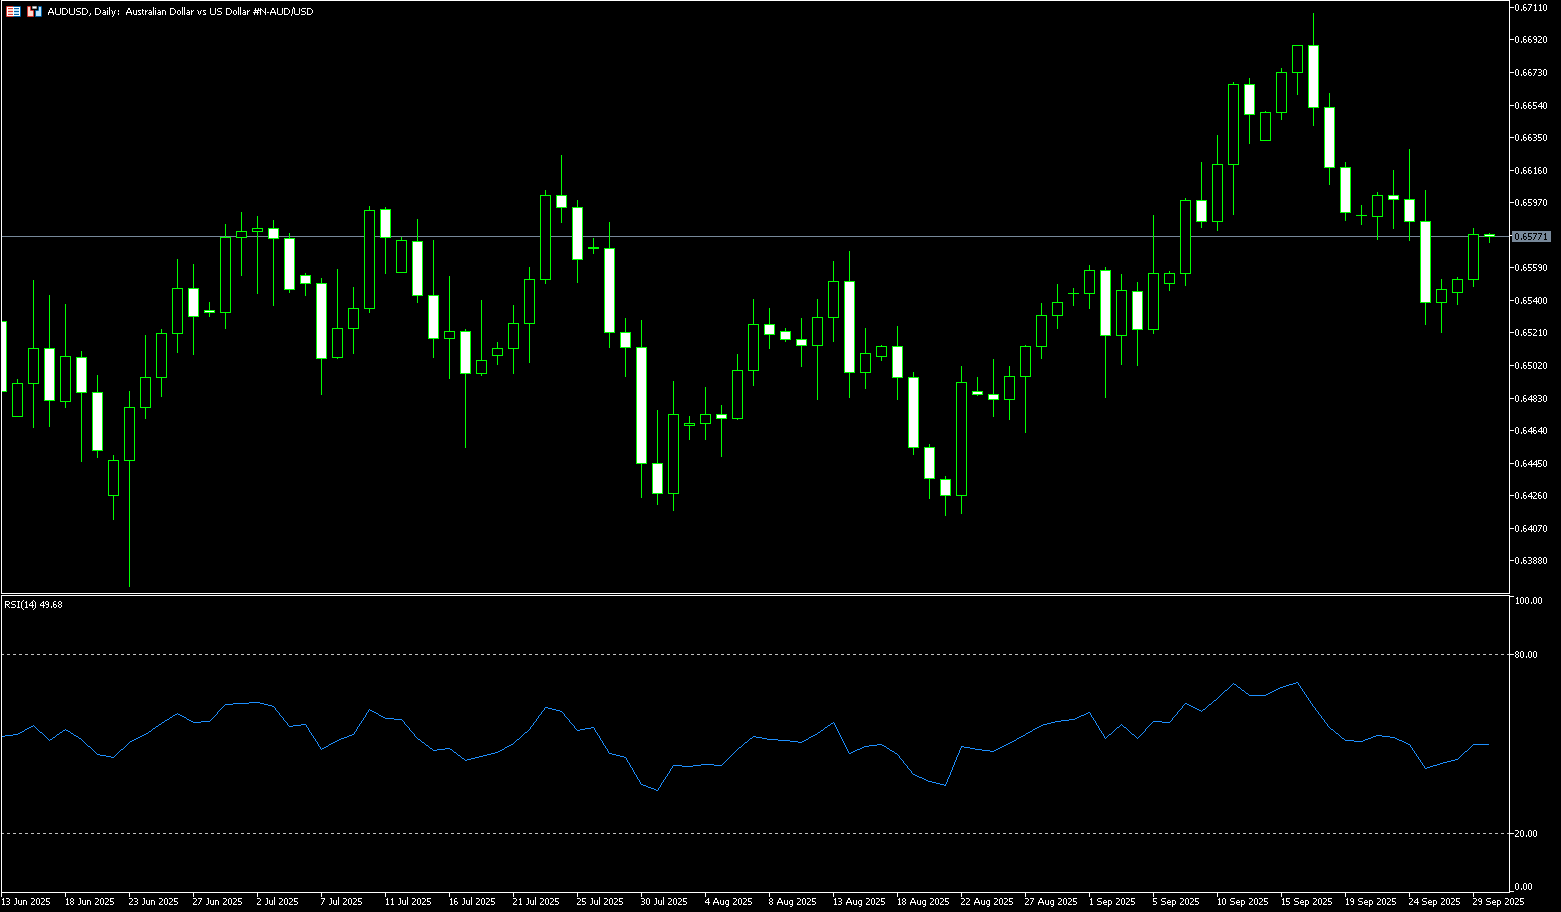
The Australian dollar rose on Monday, extending its gains for the second consecutive trading day. The dollar weakened as traders prepared for the risk of a US government shutdown starting October 1st. Recent data showing higher-than-expected August consumer prices also supported the Australian dollar, easing market expectations for near-term policy easing by the Reserve Bank of Australia (RBA). Markets are currently pricing in only a 6.5% probability of a 25 basis point rate cut at Tuesday's meeting, compared to a 38.2% probability at the subsequent meeting in November. Australia's budget deficit for the fiscal year ending June 2025 is expected to approach AUD10 billion (US$6.55 billion), marking the end of two consecutive years of surpluses. This deficit is significantly lower than the Treasury's AUD27.9 billion forecast.
AUD/USD traded around 0.6560 on Monday. Technical analysis on the daily chart suggests bearish market sentiment. Furthermore, the 14-day relative strength index (RSI) is slightly below the 50 level, further reinforcing the bearish bias. On the downside, the AUD/USD pair could find immediate support at the near three-week low of 0.6526, followed by 0.6500 (the lower boundary of the descending channel and a psychological barrier). A break below this key support area would strengthen the bearish bias and exert downward pressure on the pair, potentially pushing it towards the September 2 low of 0.6483. Initial resistance lies in the 0.6597 (10-day) and 0.6594 (20-day) simple moving averages. A break above this level would weaken the current bearish bias and support the pair's attempt to explore the September 18 high of 0.6660.
Consider going long on the Australian dollar at 0.6565 today. Stop-loss: 0.6555. Target: 0.6600, 0.6620.
GBP/USD
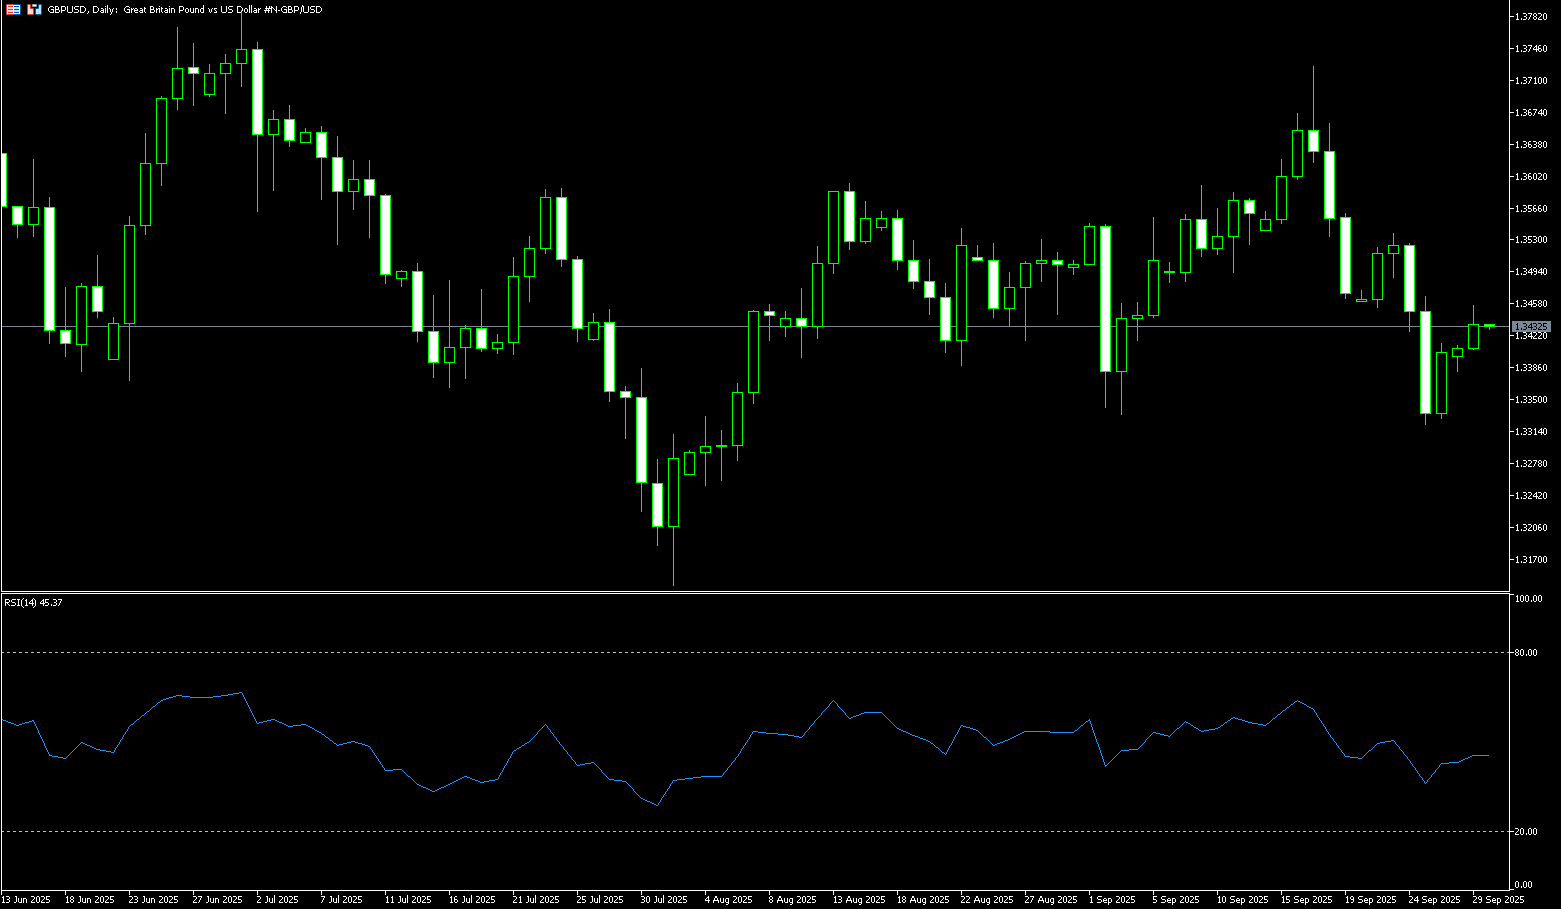
GBP/USD edged higher in early trading Monday, approaching 1.3430. The US dollar weakened against the British pound as the August US inflation report reinforced market expectations that the Federal Reserve may cut interest rates again in October. The Fed cut interest rates for the first time at its September monetary policy meeting, lowering them by 25 basis points. Markets currently price in a near 88% probability of an October Fed rate cut. The Bank of England is expected to maintain interest rates at 4.0% for the rest of the year, providing some support for the British pound. Due to persistent inflationary pressures in the UK economy, the Bank of England is unlikely to cut interest rates in the near term. Hawkish comments from Fed policymakers could boost the US dollar and limit the upside for the major currency pair.
GBP/USD rose for the second consecutive trading day, trading around 1.3430 on Monday. Short-term price momentum is weak. Technical analysis on the daily chart shows the pair remains below its 9-day simple moving average at 1.3480. The 9-day and 100-day simple moving averages at 1.3490 have formed a bearish "death cross" pattern. Furthermore, the 14-day relative strength index (RSI) remains below 50, indicating a persistent bearish bias. GBP/USD is testing its key support level, the September 26 low of 1.3395. A break below this level would reinforce the bearish bias and exert downward pressure on the pair, potentially leading to a lingering trade near the monthly low of 1.3333 reached on September 3. On the upside, GBP/USD could face initial resistance at the 9-day simple moving average at 1.3480, followed by the 1.3500 level.
Consider a long GBP at 1.3426 today, with a stop-loss of 1.33410 and targets of 1.3470 and 1.3480.
USD/JPY
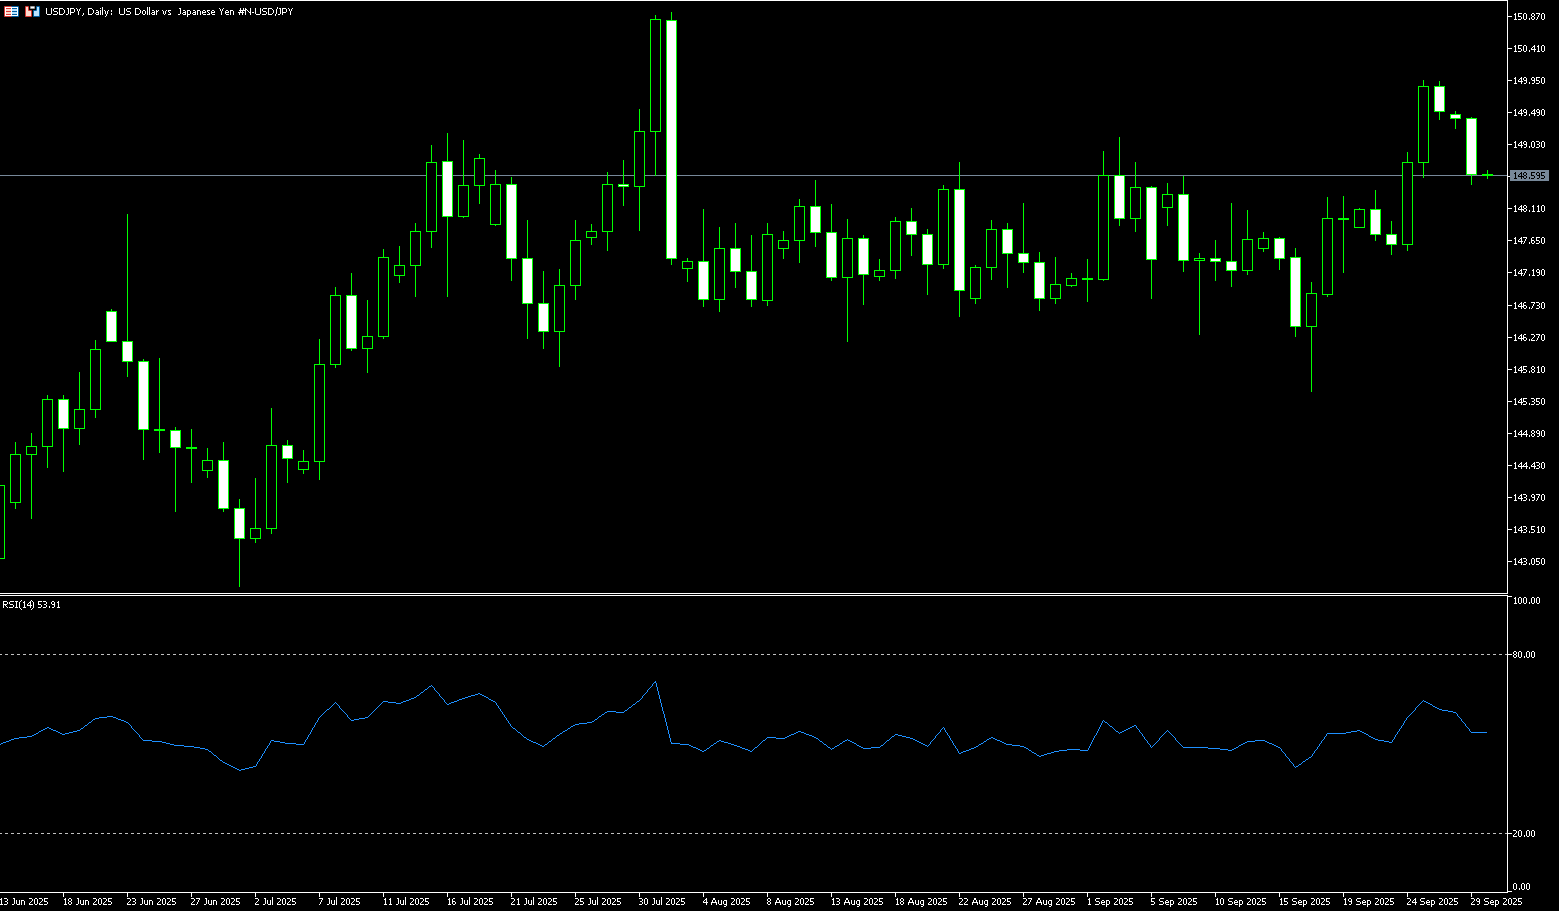
USD/JPY slipped below approximately 149.00 in early trading on Monday. The dollar weakened against the yen as the US Personal Consumption Expenditures (PCE) price index showed the Federal Reserve maintaining its pace of interest rate cuts. Traders are looking to Fed officials' speeches later this week for fresh momentum. Although the US central bank's inflation target is 2%, these reports are unlikely to change the direction of policymakers, who last week indicated they expect two more 25 basis point rate cuts by the end of the year. Political uncertainty in Japan, on the other hand, could weigh on the yen and create tailwinds for the currency pair. The Liberal Democratic Party leadership election will be held on October 4th, and if a dovish candidate is elected, the Bank of Japan's next rate hike could be delayed.
Technical charts indicate that once USD/JPY breaks through the key levels of 149.00 (round number mark) and 149.15 (September 3 high), the bearish trend in the currency pair will end, ushering in a bullish trend. However, considering fundamentals, traders should be wary of whether this rebound could represent a false breakout. The slow pace of the MACD's red bars suggests the USD/JPY's advance has been premature, and the exchange rate may need to retest the central axis of the upward channel in the short term. Support lies at the 200-day simple moving average of 148.43. USD/JPY could then test the Bollinger Band 147.87 and last week's low of 147.46. Current resistance lies near 149.93 (September 25 high) and 150.00 (a psychological level). A break below this level would target resistance at 150.92 (August 1 high).
Consider shorting the US dollar at 148.80 today. Stop-loss: 149.00, target: 147.80, 147.60.
EUR/USD
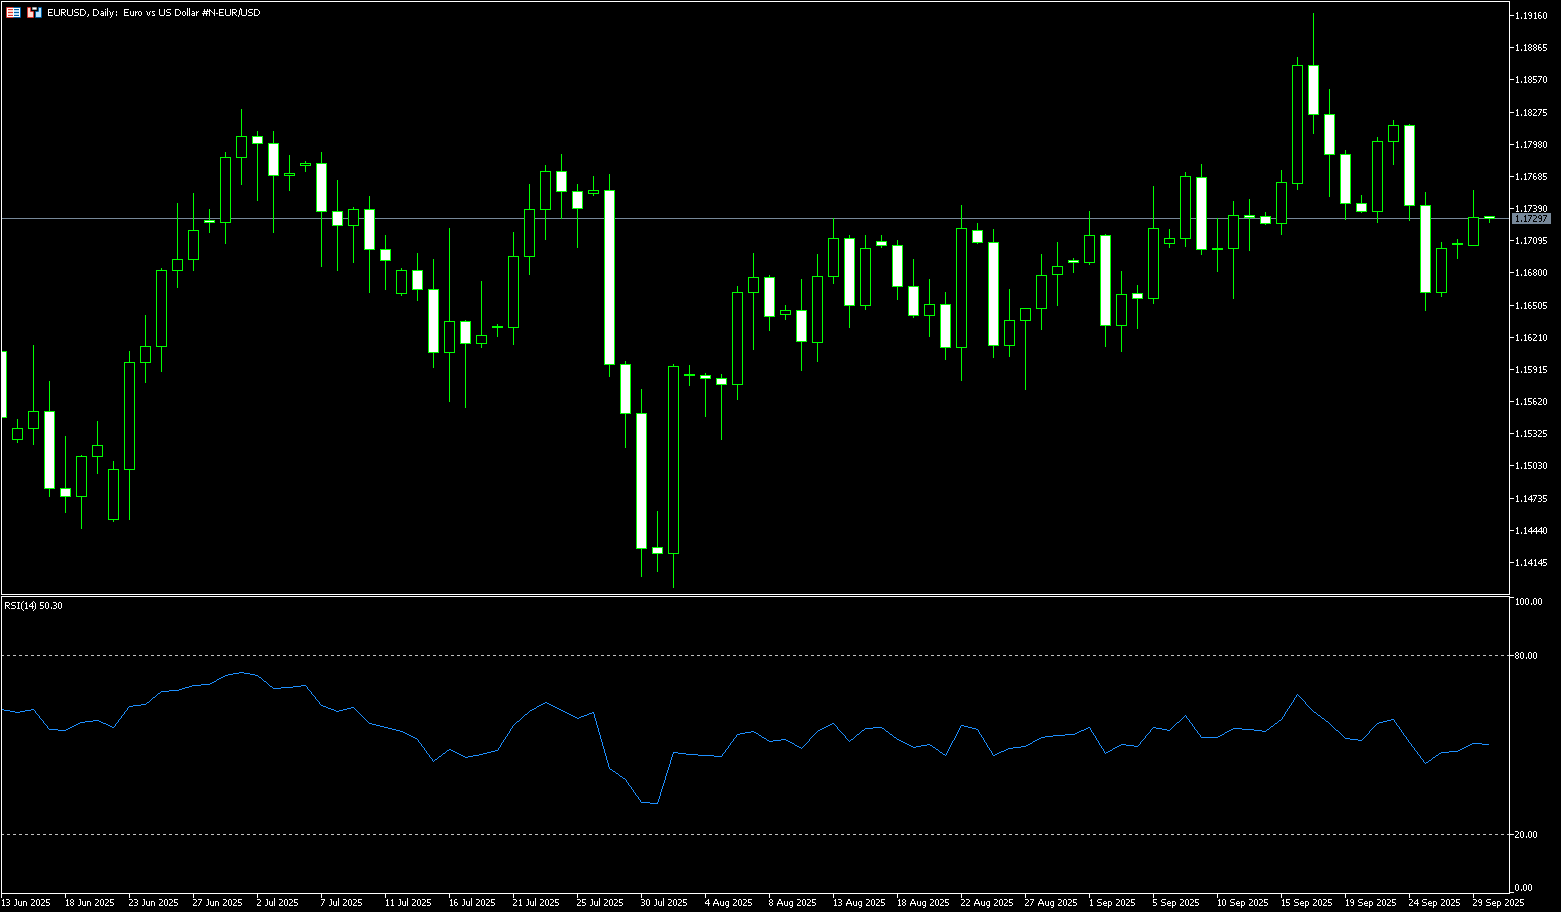
EUR/USD continued its upward trend on Monday, trading around 1.1720. The US dollar weakened, boosting the pair's value, as the August US inflation report raised the possibility of another Federal Reserve rate cut in October. The Fed cut interest rates for the first time at its September monetary policy meeting, lowering them by 25 basis points. Markets are currently pricing in a near 88% probability of an October rate cut and a 65% probability of another cut in December. Traders will likely monitor speeches by Fed officials later this week. Meanwhile, the market believes the European Central Bank is nearing the end of its easing cycle after holding interest rates steady for the second time in September. Economic data remains mixed, with a recovery in the services sector but continued weakness in manufacturing.
EUR/USD hit a near one-month low of 1.1645 last week and appears to have found support around 1.1650. After reaching that level, the pair rebounded to trade above 1.1700. The Relative Strength Index (RSI) on the daily chart is near 50.70. A failure to break above the 9-day SMA at 1.1755 could pave the way for further downside. The first support level is 1.1650, followed by the lows of September 2nd and 3rd, near 1.1610, and the 1.1600 round-figure mark. Conversely, if buyers recapture the 9-day SMA at 1.1755, the next resistance level will be the psychological level of 1.1800, followed by the 1.1820 high of September 23rd.
Consider a long EUR at 1.1715 today. Stop-loss: 1.1704 Target: 1.1760; 1.1770
Disclaimer: The information contained herein (1) is proprietary to BCR and/or its content providers; (2) may not be copied or distributed; (3) is not warranted to be accurate, complete or timely; and, (4) does not constitute advice or a recommendation by BCR or its content providers in respect of the investment in financial instruments. Neither BCR or its content providers are responsible for any damages or losses arising from any use of this information. Past performance is no guarantee of future results.
More Coverage


Risk Disclosure:Derivatives are traded over-the-counter on margin, which means they carry a high level of risk and there is a possibility you could lose all of your investment. These products are not suitable for all investors. Please ensure you fully understand the risks and carefully consider your financial situation and trading experience before trading. Seek independent financial advice if necessary before opening an account with BCR.

 English
 简体中文
简体中文
 繁體中文
繁體中文
 Bahasa
Melayu
Bahasa
Melayu
 Tiếng
Việt
Tiếng
Việt
 ไทย
ไทย
 日本語
日本語
 한국어
한국어
 ភាសាខ្មែរ
 español