


0
US Dollar Index
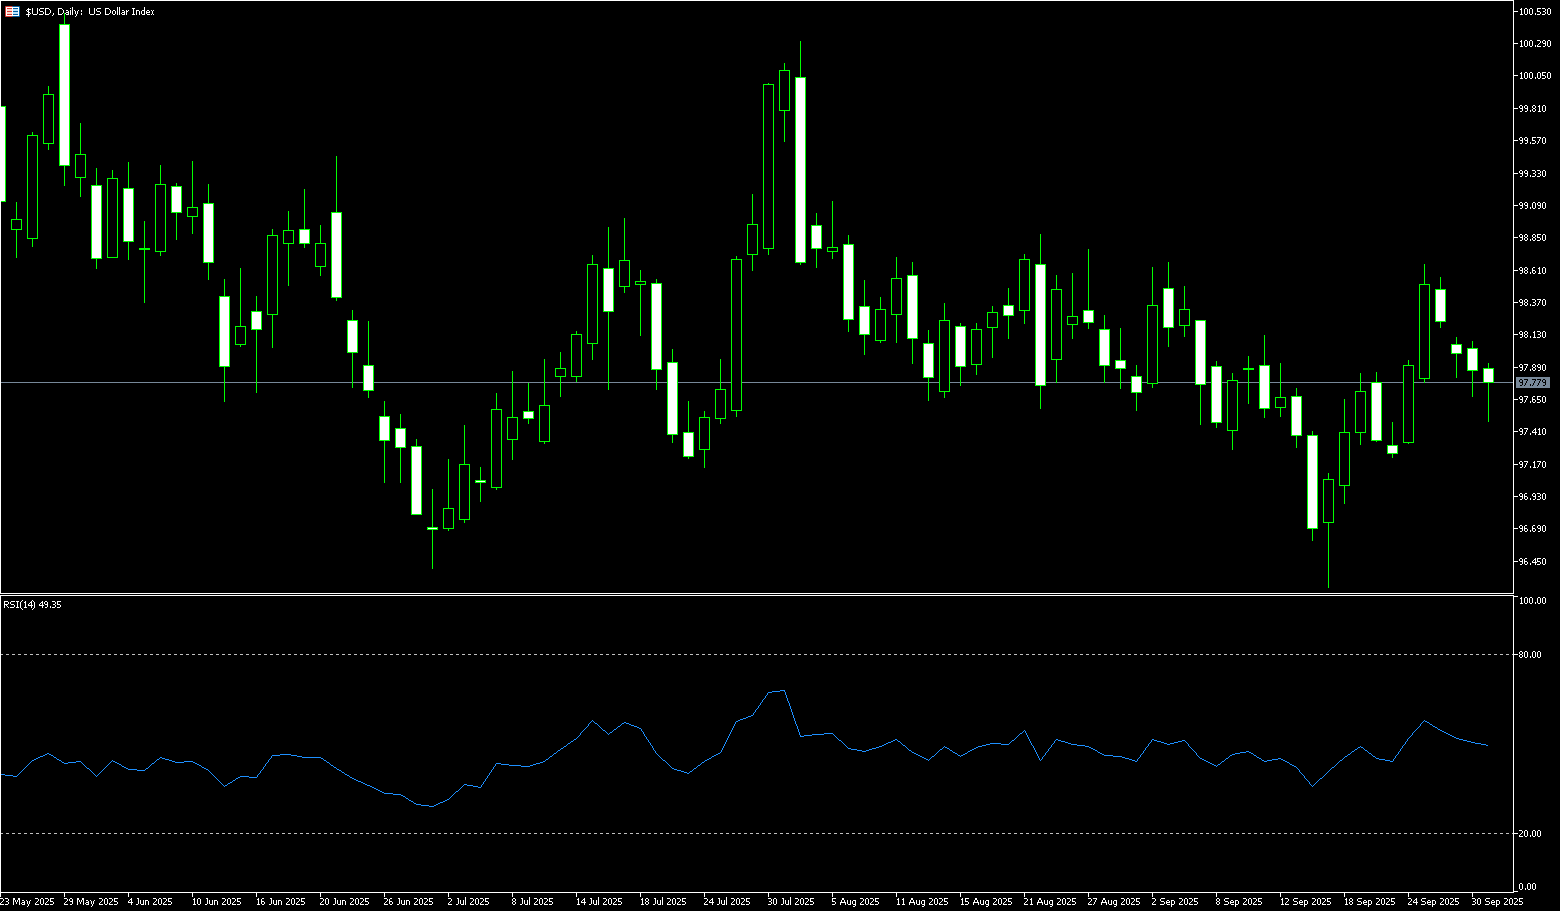
The US dollar index fell for the fourth consecutive trading day on Wednesday, dropping to 97.46 at one point. The week began with a pattern of "opening high, then falling, then moving sideways," mirroring the previous day's mild decline. This follows the first US federal government shutdown since 2019, and it's unclear how long it might last. The shutdown occurred after Democrats and Republicans failed to reach a temporary funding agreement, with Democrats insisting any deal include extending subsidies for the expiring Obamacare. The impasse could result in furloughs for approximately 750,000 federal employees, resulting in approximately $400 million in lost pay daily, according to the Congressional Budget Office. Critical government services could also be suspended, including the highly anticipated jobs report scheduled for Friday. With the official report likely delayed, traders will place greater emphasis on the ADP employment data due later this week.
From the 8-hour chart, the K-line superposition of Bollinger Bands, MACD, and RSI shows that the US dollar index has fallen from the stage high of 98.60 and is currently running below the middle axis of the Bollinger Bands {97.90} and above the lower band {97.24}; the band shape has turned from expansion to convergence, and the volatility has cooled down in stages. Structurally, there are more negative entities in the recent period, and the rebound is mostly small positive with long upper shadows, reflecting that the selling pressure from above is still there. MACD and RSI (14) are typical weak consolidation. Combined with the price structure, 97.20 {low point on September 20} and 97.17 {23.6% Fibonacci rebound level from 100.26 to 96.22} form a short-term support concentration area. If it falls below, it is easy to trigger a rapid retracement to the 97.00 integer mark; above, pay attention to the strong resistance resonance area of 98.00 (market psychological mark) and 98.49 {upper track line of the Bollinger Bands}. Overall, the market is in a phase where a technical rebound after a downturn has turned into sideways trading, with data determining the direction.
Today, consider shorting the US Dollar Index at 97.88, with a stop-loss at 98.00 and targets at 97.50 or 97.40.
WTI Spot Crude Oil
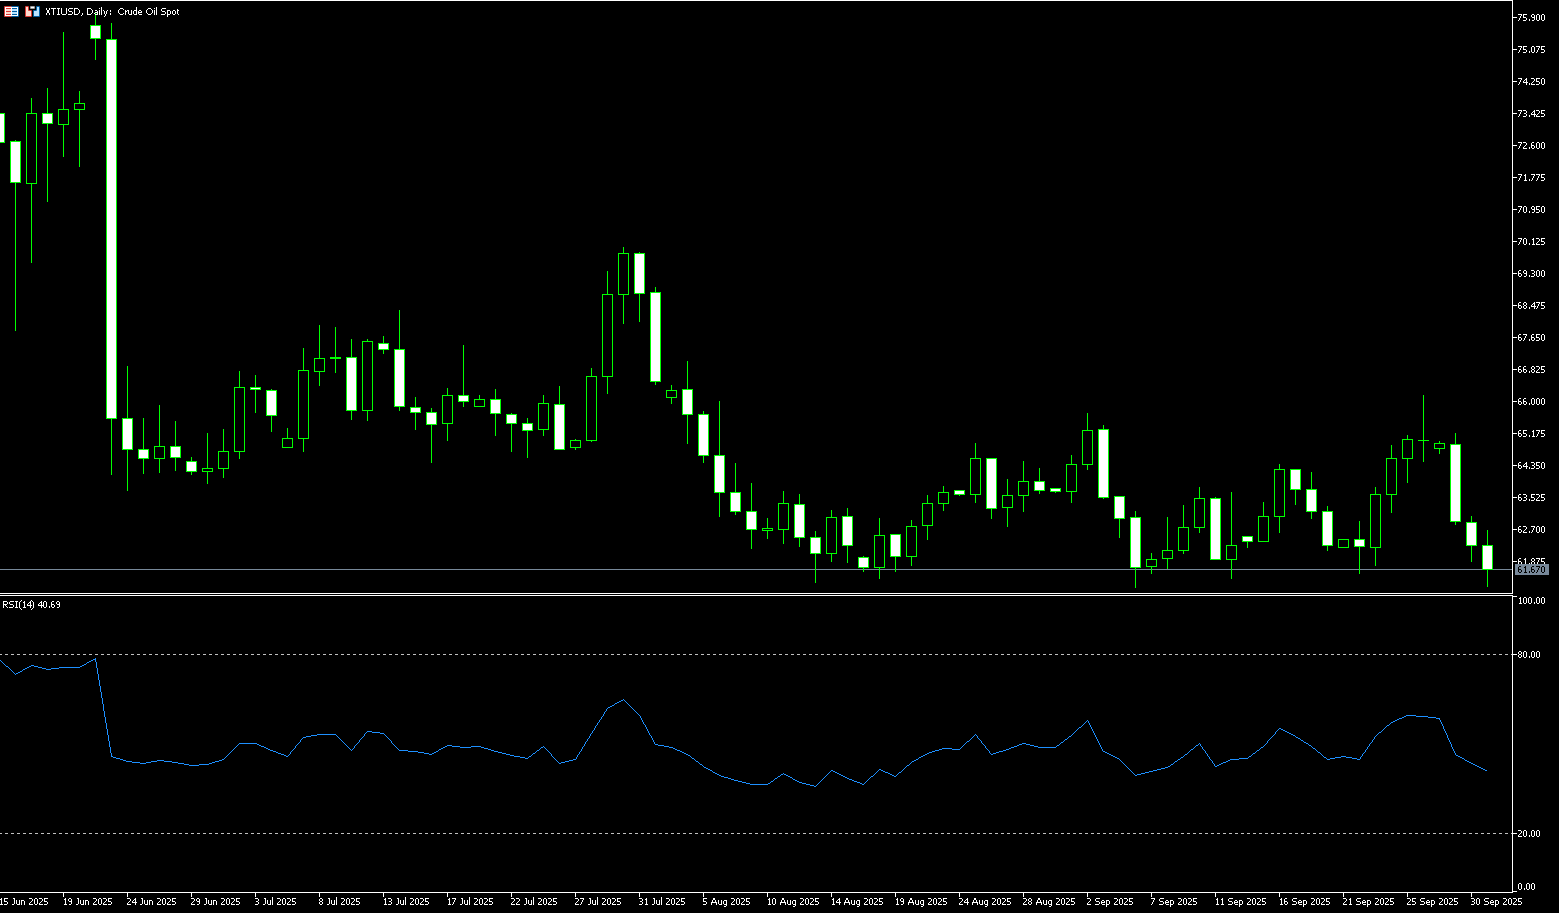
During early European trading on Wednesday, WTI crude oil fell again below $62.00 to around $61.70 per barrel. Rumors of an OPEC+ production increase provided support for oil prices, which had previously fallen for three consecutive trading days due to supply concerns. The Organization of the Petroleum Exporting Countries (OPEC+) issued a statement on Tuesday, denying reports that OPEC and its allies planned to increase crude oil production by 500,000 barrels per day in November at their meeting last Sunday. This statement alleviated market concerns about oversupply. Iraq's Oil Ministry confirmed that pipeline flows between the Kurdish region and Turkey have resumed after a two-and-a-half-year hiatus. This temporary agreement breaks the deadlock and injects new supply into the global market. Currently, the conflict between supply and demand is driving market caution. On the one hand, ongoing Ukrainian drone attacks on Russian refineries pose supply risks; on the other, weakening demand and expectations of increased production are raising concerns about oversupply.
From a technical perspective, the daily chart shows that oil prices have largely fluctuated between $61.50 and $65.50 since August 7th. Crude oil bulls have repeatedly attempted to push prices above the top of the range at $65.50, but have failed. This resistance area is converging with the 168-day simple moving average (65.04) and the previous swing high of $65.19, set on Tuesday. On the downside, bargain hunting has occurred whenever prices approach support levels at $61.45 (the low of September 12th) and $61.00 (the round-figure mark), maintaining the overall sideways trend. On the upside, the 50-day simple moving average (64.11) is currently acting as short-term resistance. A daily close above the 50-day moving average could bolster confidence in a rebound, potentially pushing prices towards the upper end of the $64.50-65.00 range.
Consider going long on crude oil at $61.45 today. Stop-loss: $61.30, target: $62.80, $63.00.
Spot Gold
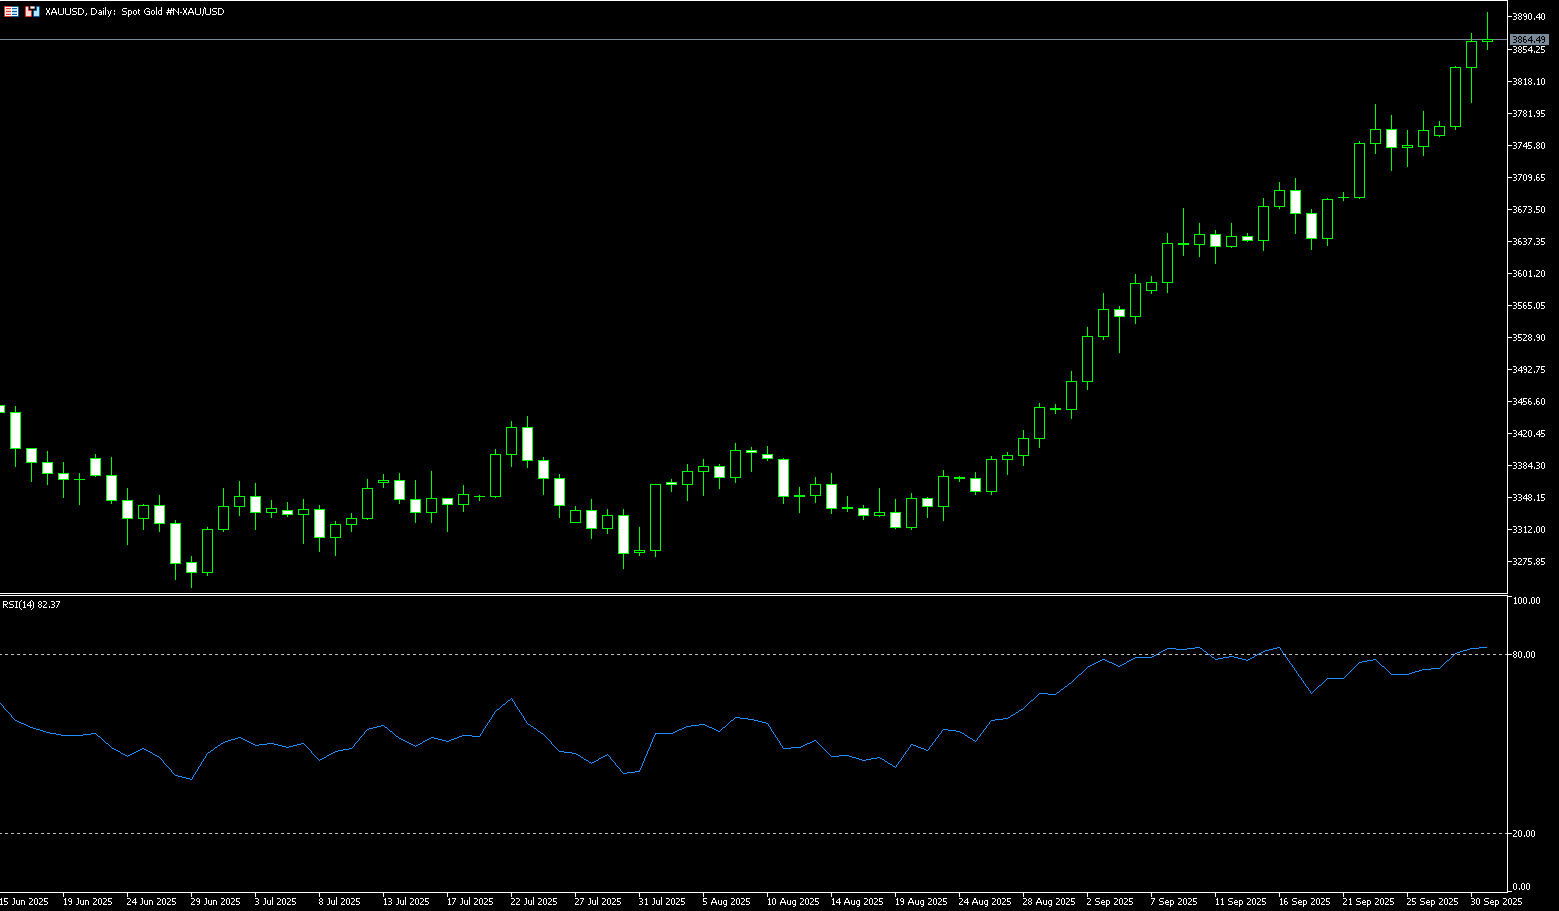
Spot gold surged on Wednesday, hitting another record high and rebounding to $3,895.20, approaching the $3,900 mark. It remained trading around $3,890 during the European session. Since the beginning of 2025, the price has risen by over 45%, with double-digit gains in September alone. This kind of explosive growth in a short period of time is extremely rare in recent years. As one of the most important safe-haven assets in the global market, gold has demonstrated strong appeal amidst a volatile macro environment, experiencing a period of accelerated upward movement from consolidation. Meanwhile, volatility in the European bond market, turbulence in global equity markets, and diverging trends across commodities further highlight the liquidity preferences of investors across different asset classes. The recent macroeconomic backdrop supporting gold prices is primarily driven by dual political and economic pressures. On the one hand, tensions between Russia and Ukraine have escalated again, and the situation in the Middle East and Eastern Europe is also clouding. On the other hand, the US government shutdown crisis has reignited.
From a technical perspective, spot gold has stabilized above the psychologically important $3,800 level. This level also reflects the 23-hour simple moving average on the 4-hour chart—a level at which buyers re-entered the market after gold's sharp decline from its all-time high of nearly $3,871. As long as the $3,800 level holds, the short-term market bias remains constructive. A rebound from this range could pave the way for a renewed push toward Wednesday's high of $3,895 and $3,900. If bullish momentum regains, gold could even head towards $3,950. However, if gold prices definitively break below $3,800, the short-term market bias will shift to bearish, potentially pulling prices back into the previous consolidation range. Strong support lies at the bottom of this range, between $3,750 and $3,700.
Consider a long position in gold at $3,860 today, with a stop-loss at $3,855 and targets at $3,880 and $3,890.
AUD/USD
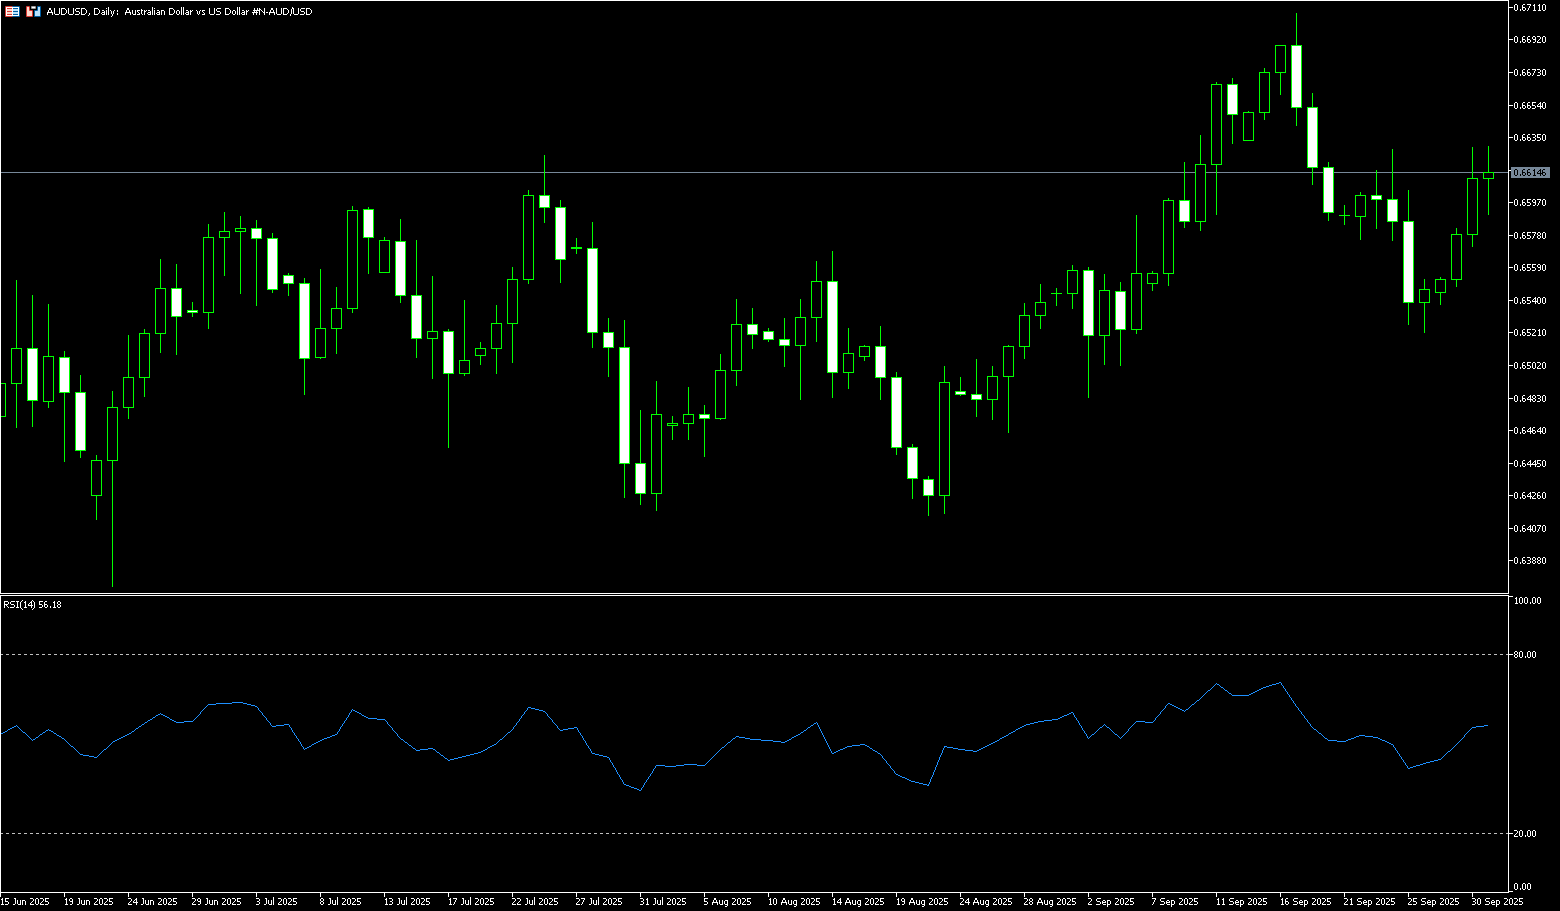
The Australian dollar traded near flat territory on Wednesday, trading just above $0.6600 during the Asian session. The Australian dollar came under pressure following the release of Australian data. Traders will likely focus on Friday's US non-farm payroll change data for September. Australia's AiG sector index rose 7.6 points to -13.2 in September, indicating a slight improvement but still in contraction. The S&P Global Manufacturing Purchasing Managers' Index (PMI) fell from 53.0 in August to 51.4 in September, indicating continued expansion in the sector, albeit at a slower pace. Downside for AUD/USD may be limited as the US economy remains subdued following weak US jobs data. The US government shutdown is expected to begin at midnight, with approximately 750,000 federal employees facing furloughs after Congress failed to pass a funding bill.
On Wednesday, AUD/USD traded around 0.6600. Technical analysis on the daily chart shows that the pair has rebounded into an ascending channel, indicating a bullish bias. Furthermore, the 14-day relative strength index (RSI) is slightly above 50, further reinforcing the bullish bias. On the upside, the pair could explore the 0.6666 level seen on September 18, followed by the 0.6700 round-figure mark. Near-term support lies at the 50-day simple moving average at 0.6542 and the lower boundary of the ascending channel near 0.6540. A break below this area would establish a bearish bias and push AUD/USD towards the four-month low of 0.6414 set on August 21.
Consider a long position on the Australian dollar at 0.6600 today, with a stop-loss of 0.6590 and targets of 0.6660, 0.6650.
GBP/USD
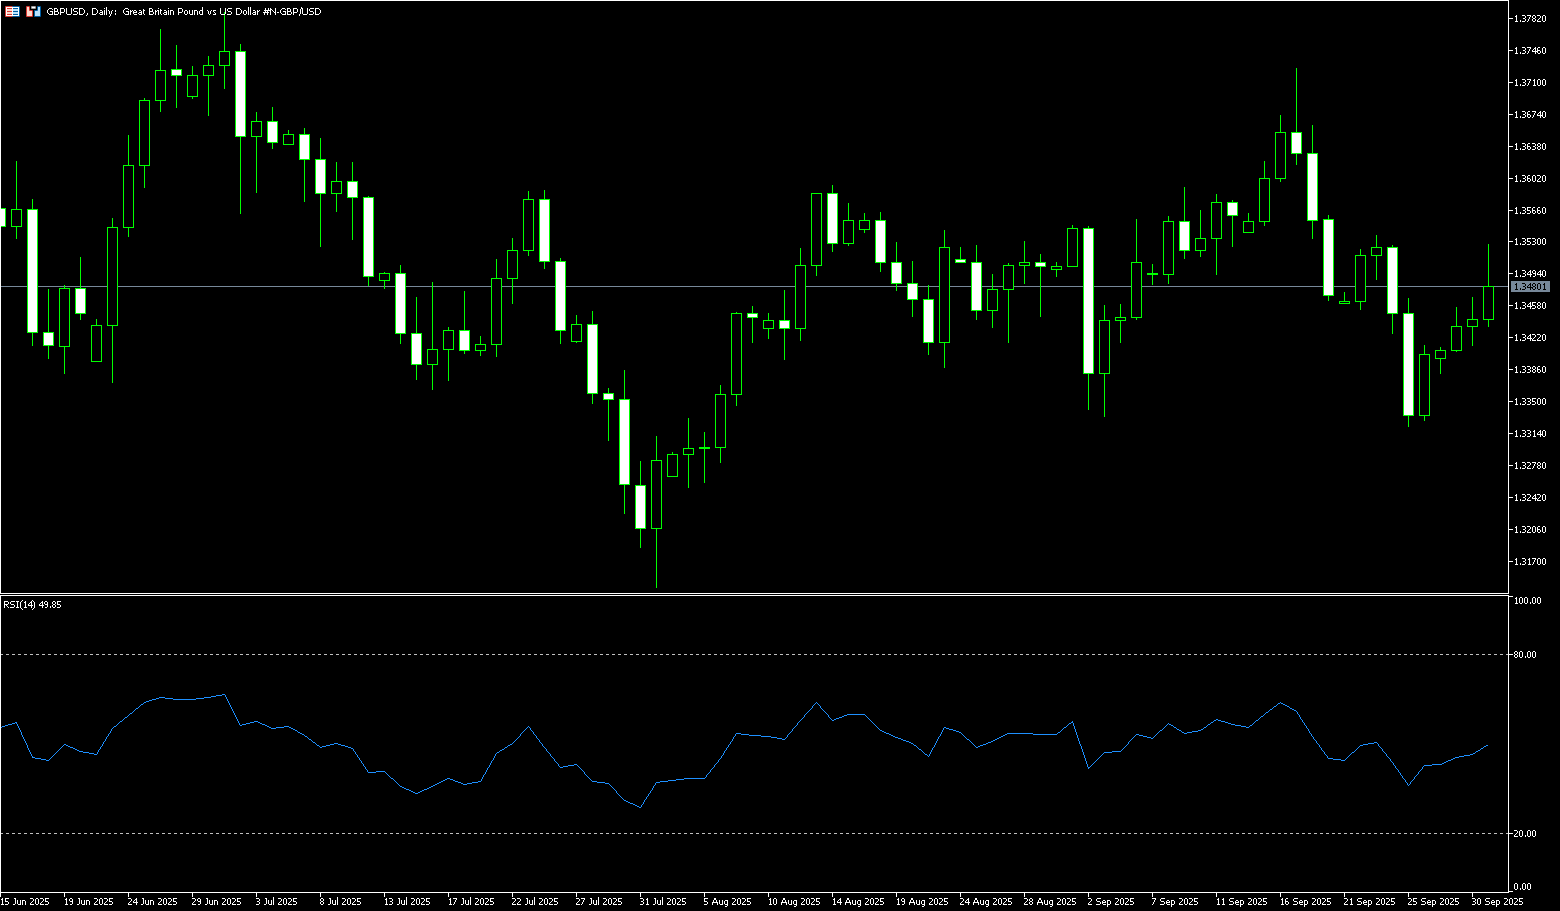
During Wednesday's European trading session, the British pound hit a new weekly high near 1.3527 against the US dollar. The exchange rate saw slight gains as the US government entered a shutdown, with the US dollar underperforming. Washington entered a dark period after government funding expired at midnight on Tuesday, as Republicans failed to convince Democrats to support a short-term funding bill in the House and Senate that would have extended the shutdown until November 21st. The federal government shutdown will have a significant impact on market expectations of the Federal Reserve's monetary policy outlook, as the statistics agency warned that the release of key economic data, including the official September employment report, originally scheduled for Friday, will be suspended. In response, US President Trump warned of irreversible cuts to Democratic-backed programs resulting from the government shutdown.
A third consecutive bullish day on the GBP/USD chart fueled buying in the pair, pushing it into an uneasy middle ground between key moving averages. Bullish price action faces a sharp slowdown below the 20-day SMA near 1.3507. Downward, the 100-day SMA provides solid technical support at the 1.3362 area. Despite two consecutive days of bullish activity, GBP/USD has failed to reverse its decline from the psychologically important 1.3500 level and the 20-day SMA at 1.3507, maintaining its downside bias. The 14-day Relative Strength Index (RSI) on the daily chart suggests sellers are in control. If GBP/USD holds below the 1.3400 round-figure mark, further downside is expected, with the 100-day SMA at 1.3362 being the next area of focus. If GBP/USD can break above 1.3500-1.3507, the next level to watch is 1.3560, the September 19 high.
Consider going long on the British pound at 1.3465 today, with a stop-loss of 1.3450 and targets of 1.3520 and 1.3530.
USD/JPY
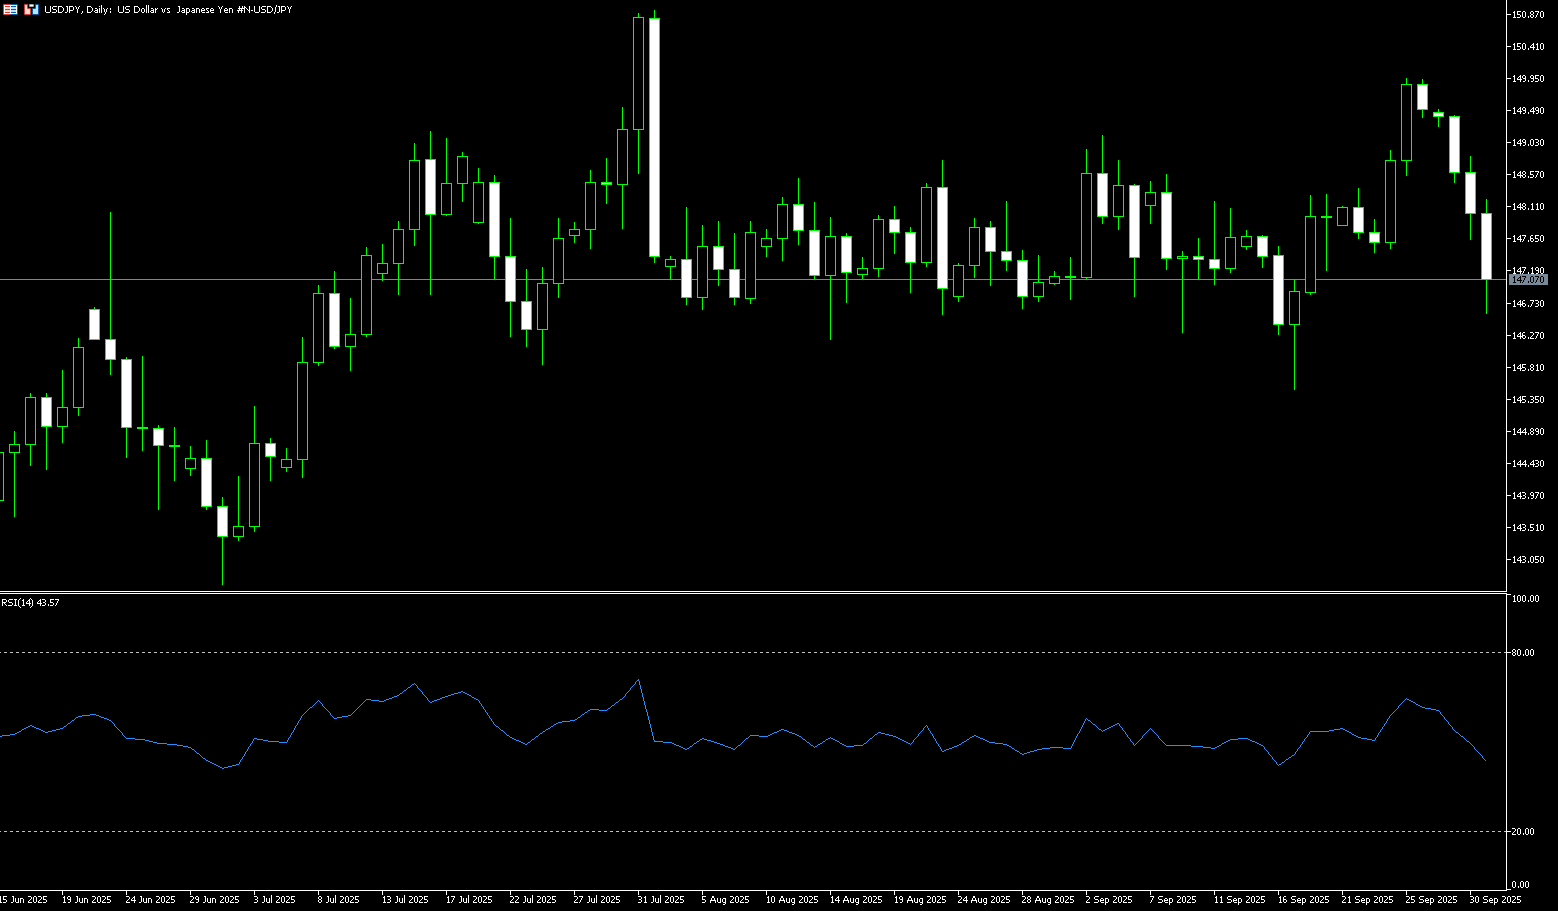
The Japanese yen extended its upward trend against a generally weakening US dollar during Wednesday's European session, reaching a near two-week high of 146.60. A key driver of this trend was growing market confidence that the Bank of Japan will stick to its policy normalization path and raise interest rates in October. Furthermore, rising geopolitical tensions and the US government shutdown fueled safe-haven flows into the yen. Meanwhile, hawkish expectations for the Bank of Japan (BOJ) diverged sharply from growing market confidence that the US Federal Reserve will cut borrowing costs twice this year. This latter sentiment pushed the dollar to a one-week low. Furthermore, the narrowing US-Japan interest rate differential benefited the low-yielding yen, pushing USD/JPY down to the 147.00 level. Traders are now eyeing Friday's US non-farm payroll data for fresh momentum. Meanwhile, diverging policy outlooks between the Bank of Japan and the Federal Reserve should benefit the low-yielding yen and help limit gains in the USD/JPY pair.
USD/JPY has fallen back into the range (145.70-148.50) it has maintained for approximately seven weeks, signaling a strengthening bearish bias. However, the 14-day Relative Strength Index (RSI) on the daily chart has dipped into negative territory near 45.00, signaling waning momentum, which supports a bearish outlook. On the upside, any further gains are likely to face resistance near the monthly swing high of 149.95 reached earlier this month. A sustained break above this level would reaffirm the positive outlook and pave the way for a test of the psychologically important 150.00 level, potentially facing some intermediate resistance in the 149.40-149.45 area. On the downside, a break below 147.00 would risk accelerating the decline towards the 150-day simple moving average near 146.40. Key support lies at 146.00, a break below which could shift the short-term trend in favor of the bears.
Consider shorting the US dollar at 147.35 today. Stop-loss: 147.50, target: 146.50, 146.30.
EUR/USD
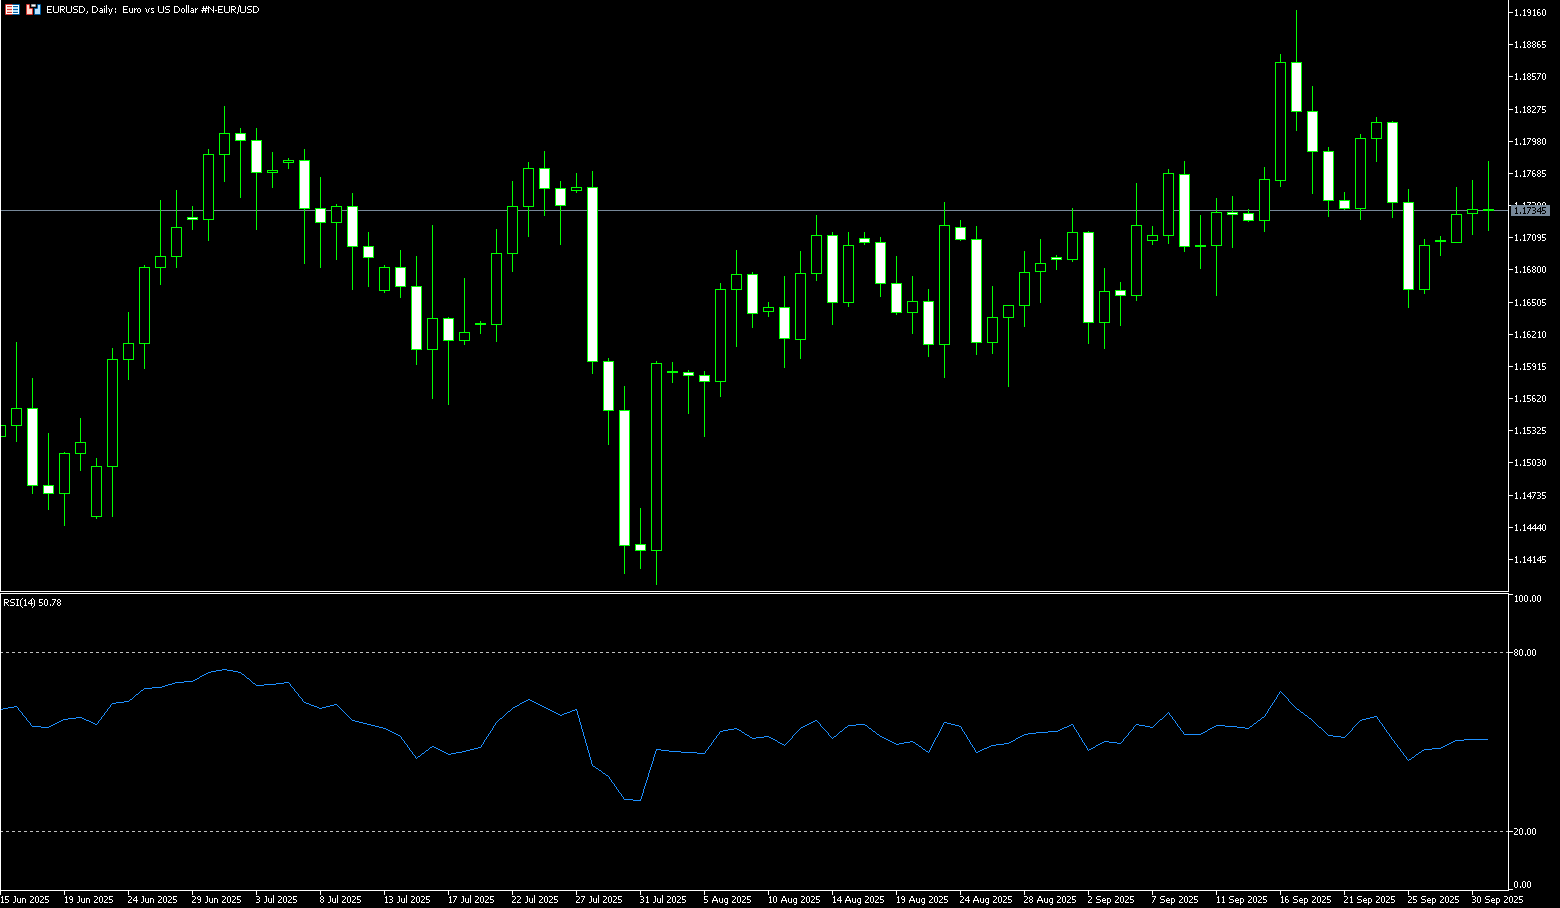
The euro held steady around 1.1730 against the US dollar during Wednesday's European session, rebounding to a high of around 1.1780 earlier. This was despite the dollar's weakness due to concerns about a potential government shutdown, which could impact the release of key employment data relied upon by Federal Reserve officials. Markets remain focused on whether the US government can avert the impending shutdown on October 1st. A bill proposed by Democrats to avert the shutdown recently failed to gain sufficient support in the Senate, and the vote is still ongoing. A slight increase in US job vacancies reinforced the "no hiring, no firing" market environment emphasized by Federal Reserve officials, and their comments also caused market volatility. Across the Atlantic, German retail sales data for August showed a slight improvement, but the monthly rate still fell short of expectations, and the annual rate further indicated a slowdown in consumer spending. Mixed US economic data sent the euro into consolidation against the US dollar.
From a near-term technical perspective: The euro is currently stabilizing against the dollar, awaiting new catalysts. The euro has held above the 1.1700 round-figure mark for the past three trading days, but has failed to break through the 1.1750 resistance level—a key resistance level for bulls. The 14-day Relative Strength Index (RSI) on the daily chart is flattening near its 50-day neutral line, suggesting a wait-and-see market. On the upside, if the exchange rate successfully breaks through the 1.1750 resistance level, subsequent resistance will be seen at 1.1800 and the year-to-date high of 1.1918. On the downside, a break below the 1.1700 support level would target the 1.1646 (89-day simple moving average) support level, followed by a test of the 1.1600 round-figure mark and the key support of the 100-day simple moving average at 1.1605.
Today, you can consider going long on EUR at 1.1718, stop loss: 1.1705, target: 1.1780; 1.1770
Disclaimer: The information contained herein (1) is proprietary to BCR and/or its content providers; (2) may not be copied or distributed; (3) is not warranted to be accurate, complete or timely; and, (4) does not constitute advice or a recommendation by BCR or its content providers in respect of the investment in financial instruments. Neither BCR or its content providers are responsible for any damages or losses arising from any use of this information. Past performance is no guarantee of future results.
More Coverage


Risk Disclosure:Derivatives are traded over-the-counter on margin, which means they carry a high level of risk and there is a possibility you could lose all of your investment. These products are not suitable for all investors. Please ensure you fully understand the risks and carefully consider your financial situation and trading experience before trading. Seek independent financial advice if necessary before opening an account with BCR.

 English
 简体中文
简体中文
 繁體中文
繁體中文
 Bahasa
Melayu
Bahasa
Melayu
 Tiếng
Việt
Tiếng
Việt
 ไทย
ไทย
 日本語
日本語
 한국어
한국어
 ភាសាខ្មែរ
 español