


0
US Dollar Index
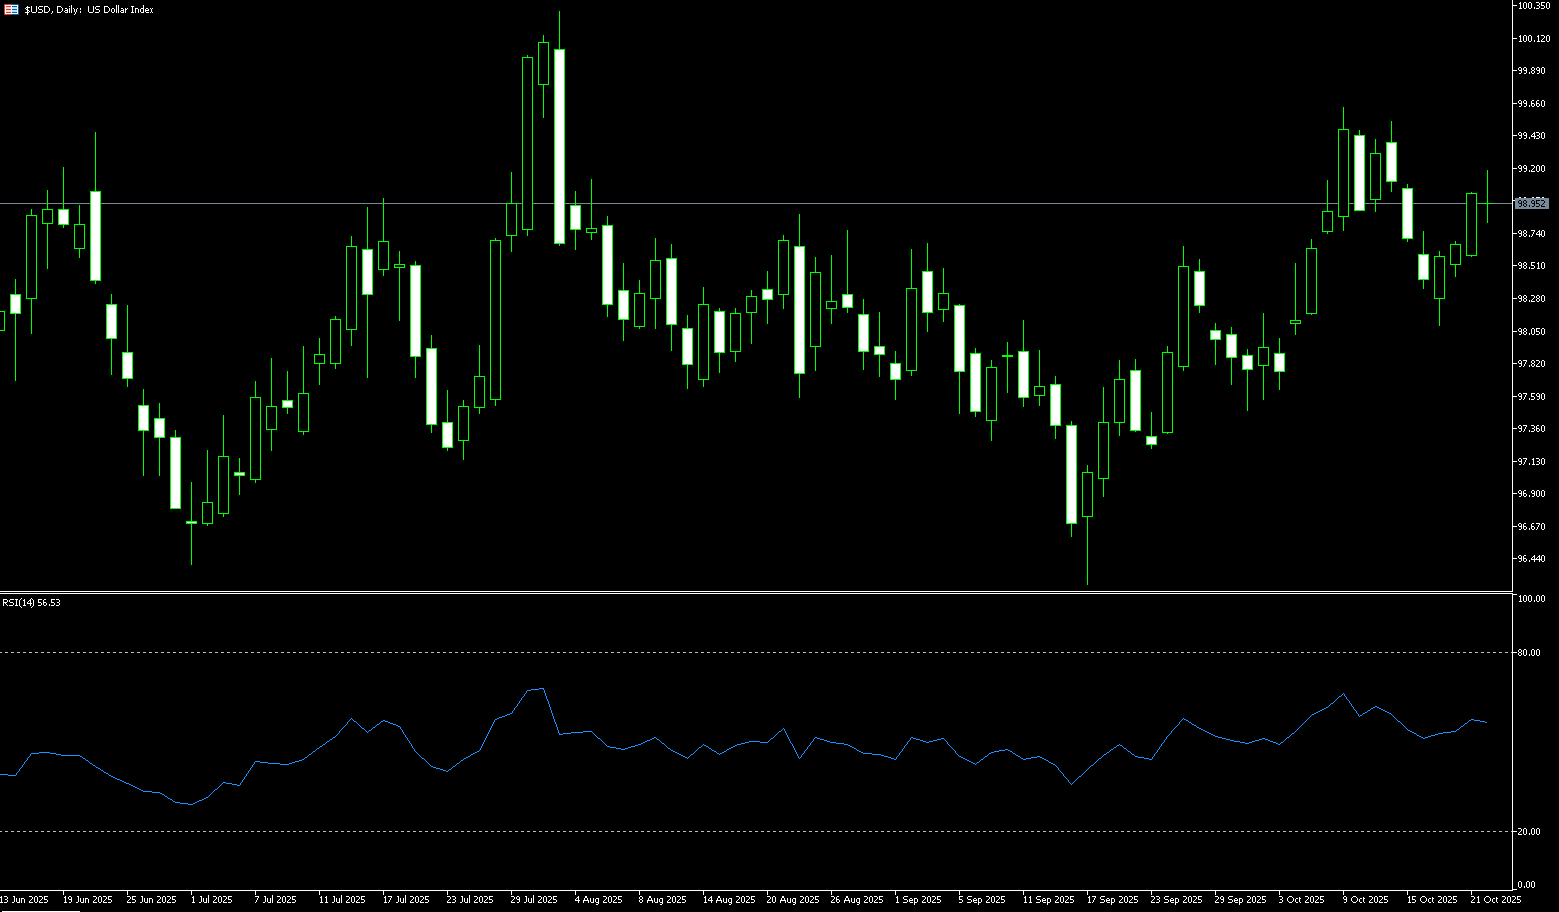
The US dollar index continued its upward trend in the first half of this week, buoyed by stabilizing interest rate expectations and easing global political uncertainty. With the Federal Reserve's next policy decision imminent, markets are focused on Friday's CPI inflation report, considered the last major data point before the Fed's meeting. Market expectations suggest lower inflation than in August, which could reinforce the Fed's focus on labor market conditions and the likelihood of a rate cut. However, a surprise higher-than-expected inflation reading could shift market expectations and reinforce the Fed's hawkish stance. Supported by policy divergence and renewed optimism regarding US fiscal stability, the US dollar index is likely to maintain a bullish tone ahead of Friday's inflation data release. As long as the index holds above its 50-day moving average on the 8-hour chart, the likelihood of testing the psychological resistance level of 100 continues to increase. In the short term, overall risk appetite and global interest rate differentials remain favorable for a stronger US dollar.
The 8-hour chart shows the US dollar index moving modestly upward within its Bollinger Bands. Currently, the price remains above the Bollinger Bands at 98.68 and the 50-period moving average at 98.59, indicating that the short-term bullish trend has not been broken. The Bollinger Bands at 99.20 almost coincide with the recent high of 99.56, forming the first level of momentum-price resonance resistance. If it breaks above this level, the price will face the psychological market high of 100.00. The RSI technical indicator is near 60, indicating a mild bullish trend but not overbought. However, it warns of short-term high-level fluctuations due to insufficient volume. On the downside, the Bollinger Bands at 98.68 and 98.59, the 50-period moving average, together with Monday's 98.40, form the "last line of defense" in the range. The 98.00 level is then the target.
Consider shorting the US Dollar Index at 99.00 today. Stop-loss: 99.10. Targets: 98.40, 98.50.
WTI Spot Crude Oil
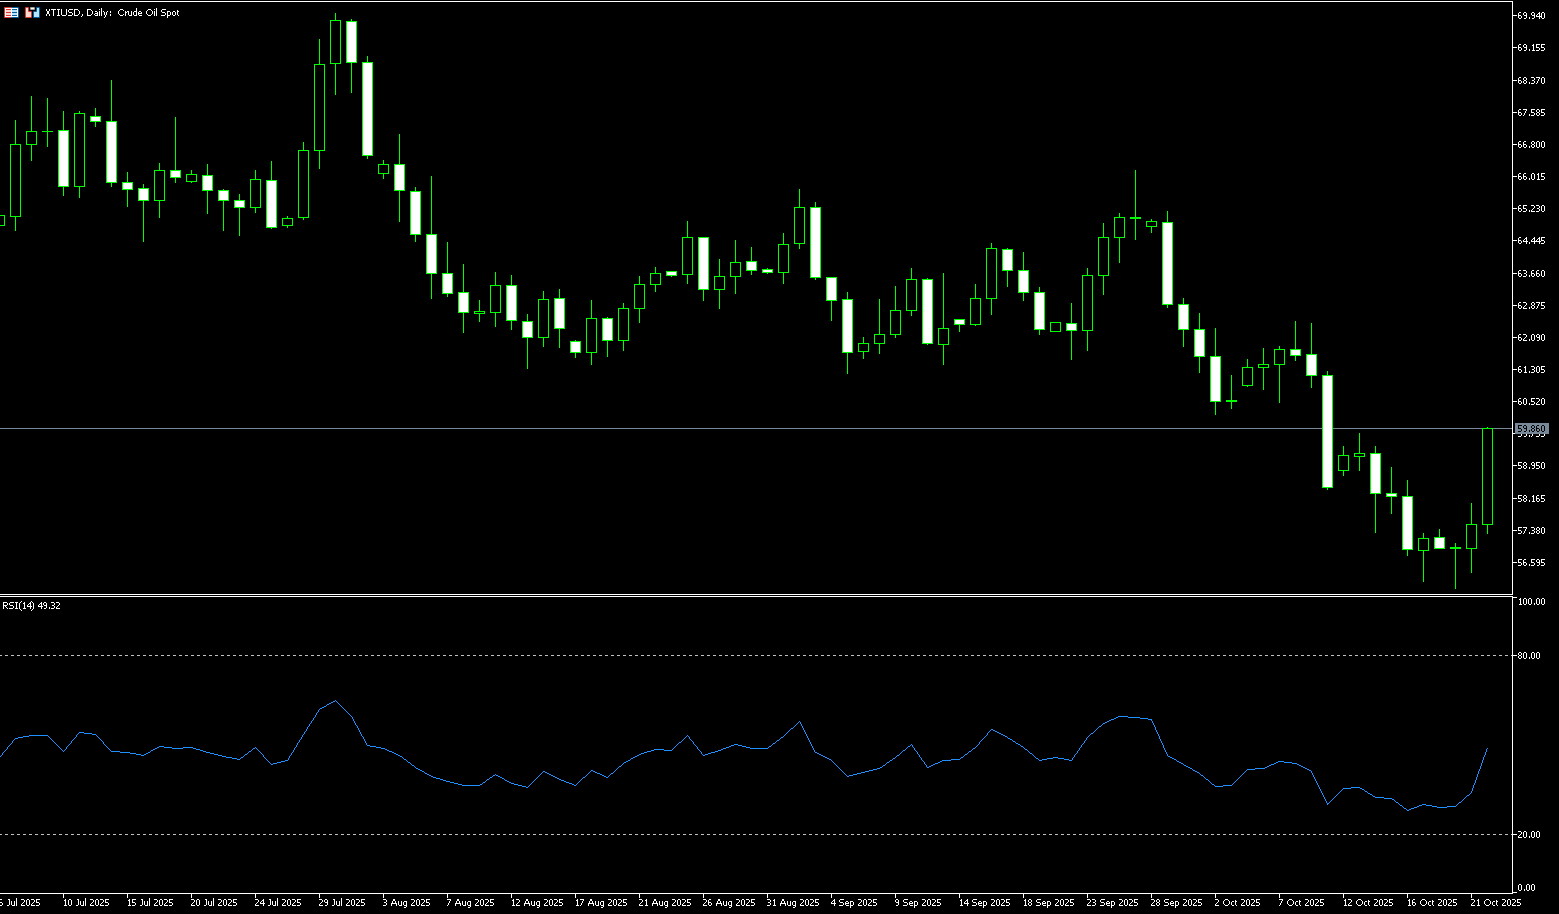
WTI crude oil traded around $59.15 per barrel on Wednesday, rebounding over 2.5% as investors reassessed expectations of an impending supply glut and sought clarity on the direction of the trade dispute. Oversupply expectations intensified due to record-high US oil production and the decision by OPEC and its allies to proceed with plans to increase supply. Both crude oil futures fell to their lowest levels since early May on Monday. However, relatively low US crude oil and distillate fuel inventories are helping to offset some of the pressure on benchmark crude oil prices. The trade dispute has also heightened expectations that slowing global economic growth will curb oil demand. However, both sides are working to downplay this disagreement. Overall, as long as supply growth outpaces demand recovery, US crude oil prices are likely to remain range-bound and weak between $55 and $60 per barrel.
Currently, the main theme in the oil market is transitioning from a "tight balance" to a "loose supply." Current prices don't reflect panic, but rather a rational correction. Overall, as long as supply growth outpaces demand recovery, US crude oil prices are likely to remain range-bound and weak in the short term, fluctuating between $55 and $60 per barrel. Technically, WTI prices remain within a downward trend. If they fail to hold above the psychologically important $60 level, the short-term trend could extend to $56.35 (Tuesday's low) and $55.14 (2025 support). A break below these levels could trigger further passive selling. Meanwhile, if market sentiment improves or OPEC+ unexpectedly cuts production, short-term rebound resistance could form between $59.29 (14-day simple moving average) and $60.00 (psychological level). Overall, however, both chart trends and fundamentals suggest a bearish outlook.
Consider going long on crude oil at 59.00 today. Stop-loss: 58.80. Target: 60.00, 60.30.
Spot Gold
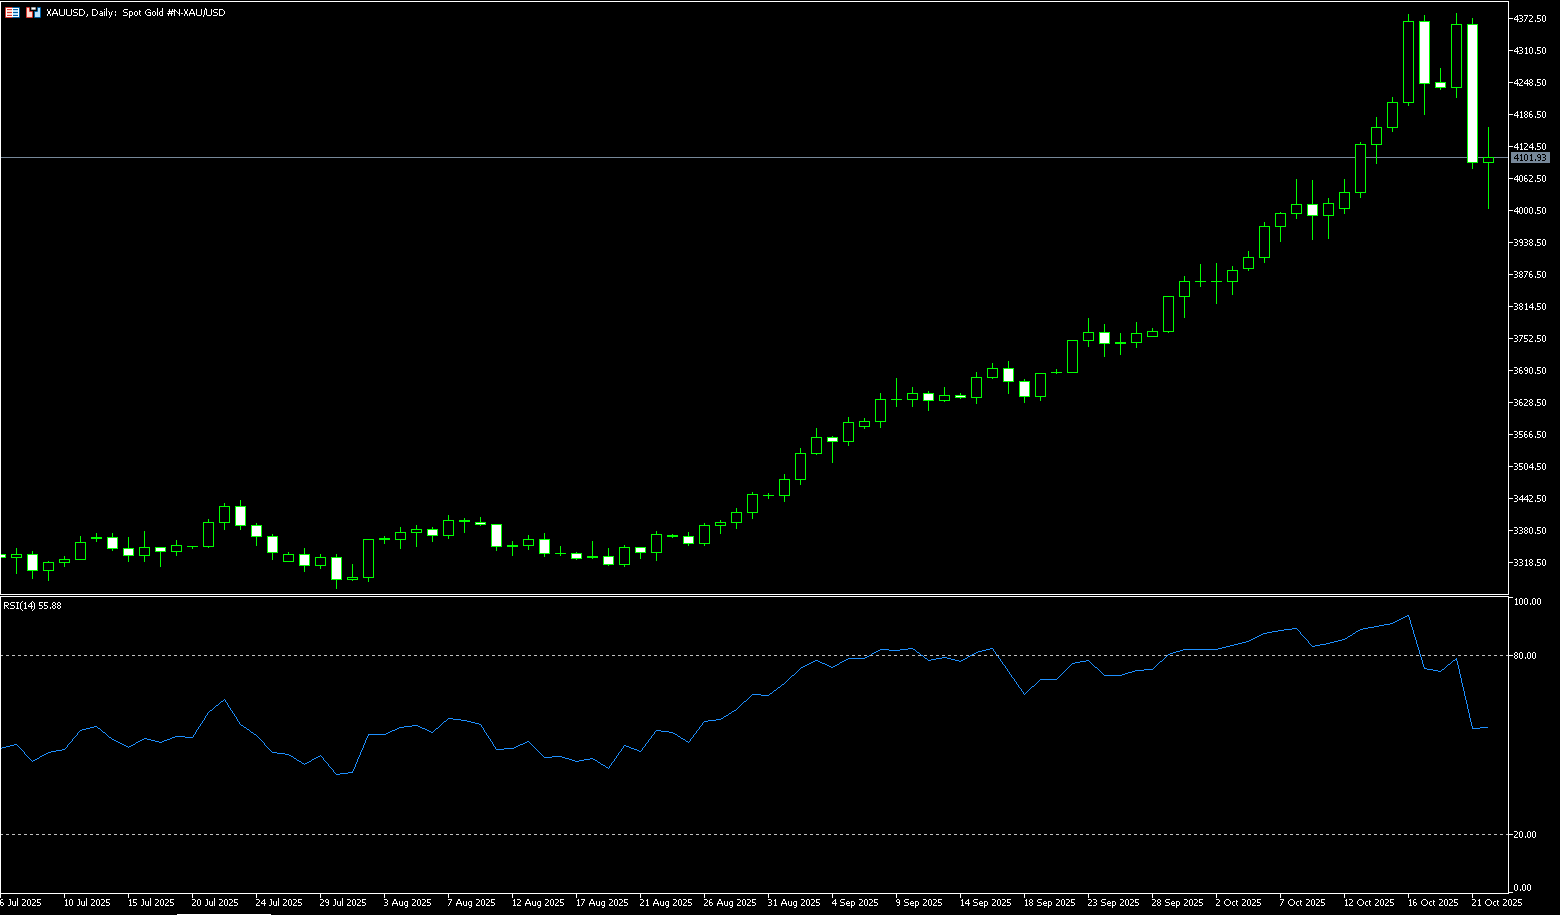
At the start of this week, gold retreated nearly 6% after testing its all-time high near $4,391.60, trading sharply lower at $4,086 per ounce. It retested $4,004 midweek before rebounding in a V-shaped pattern to around $4,100. This decline was driven by a strengthening dollar and improved risk appetite. Optimistic expectations of progress in US-China trade negotiations weakened demand for safe-haven assets. Following the excessive rally in gold prices, traders began to lock in profits. This increased risk appetite weighed on gold. Investors remain cautiously optimistic, hoping for a de-escalation in US-China trade tensions. However, given the uncertainty surrounding Trump's rhetoric and the fragility of the current negotiations, market volatility remains uncertain. Despite the pullback, the overall outlook for gold remains positive. Market expectations of a shift to accommodative monetary policy by the Federal Reserve continue to support gold's appeal, as lower interest rates reduce the opportunity cost of holding non-yielding assets such as gold. Meanwhile, the ongoing US government shutdown, coupled with lingering geopolitical and economic risks, are maintaining safe-haven buying for gold.
Spot gold appears to have formed a double top pattern at $4,380 and $4,391 on the 8-hour chart, with both highs near $4,380. Since then, it has retreated nearly 6% from its all-time high, trading sharply lower at $4,086 per ounce. It tested $4,004 early Wednesday before rebounding in a V-shaped pattern to around $4,100. Initial resistance lies at $4,186.60, the neckline of the double top pattern. A three-day closing below this level would confirm a short-term bearish reversal signal. The relative strength index (RSI) also confirms this cautious sentiment, trending downward. Next support lies at $4,000 (a psychologically important level) and $4,004 (Wednesday's low). If the decline continues, gold could test $3,963 (the 75-period simple moving average on the 8-hour chart), where it could form a stronger support confluence zone. Conversely, if buyers push gold above $4,186.60 in a timely manner, it could re-challenge the $4,250 and $4,300.00 areas.
Consider going long on gold at $4,095 today, with a stop-loss at $4,090 and targets at $4,140 and $4,150.
AUD/USD
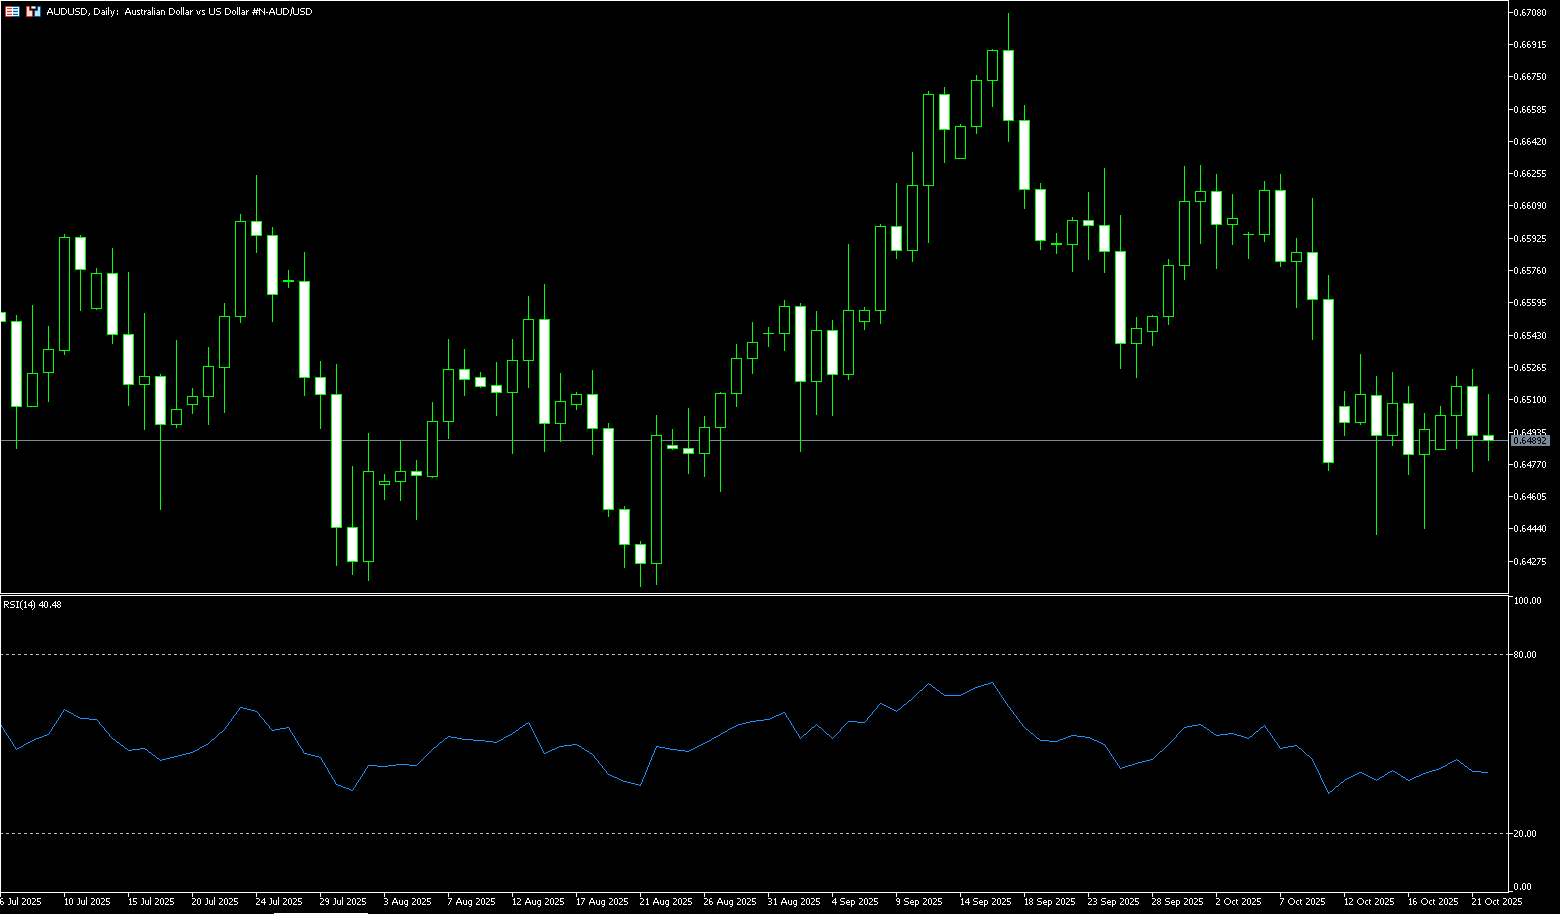
AUD/USD continued its downward trend during Wednesday's Asian session, trading around $0.6490. The pair's decline, driven by the depreciating Australian dollar, was likely driven by foreign capital outflows, reflected in declines in commodity-related stocks, including gold and major mining companies. Notably, Australia is one of the world's largest gold exporters. However, the Australian dollar's downside may be limited due to optimism about a breakthrough in the US-Australia trade deal. The US dollar could come under pressure due to concerns about a prolonged federal government shutdown and potential delays in the release of key US economic data, including the non-farm payroll report, adding uncertainty to financial markets and the Federal Reserve. The US government shutdown has entered its fourth week, and the Senate failed to advance the House-passed funding bill for the 11th time on Monday to fund the government and end the ongoing shutdown.
On the daily chart, further gains in AUD/USD appear to be limited by the provisional 100-day and 55-day simple moving averages at 0.6535 and 0.6550, respectively. If this resistance area is broken, the spot price could attempt a move towards the October 10 high of 0.6572, followed by the psychologically important 0.6600 level. Momentum indicators are now signaling further weakness: the 14-day relative strength index (RSI) is hovering around 42, suggesting further losses are possible. Furthermore, the Average Directional Index (ADX) is above 20, indicating a possible strengthening trend. If sellers regain control, the pair should find initial support at the October bottom of 0.6440 (October 14). This level appears to be supported by the key 200-day simple moving average at 0.6432, followed by the 0.6400 round-figure level.
Consider a long position on the Australian dollar at 0.6476 today, with a stop-loss at 0.6464 and targets at 0.6540 and 0.6530.
GBP/USD
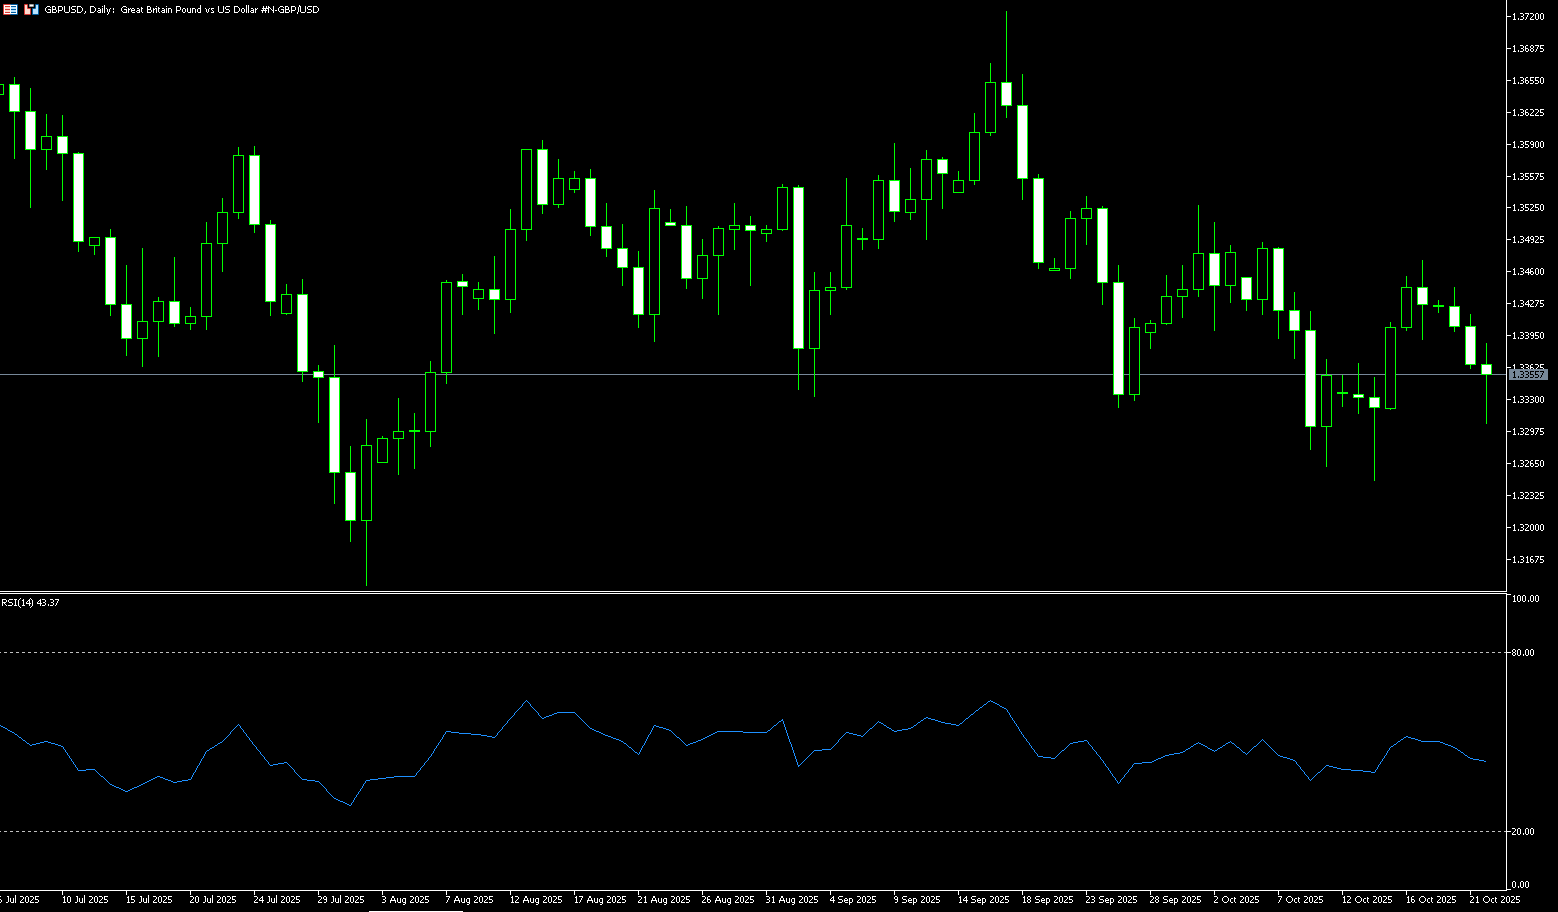
GBP/USD entered its third consecutive bearish session on Wednesday, losing momentum and falling back to just before the 1.3350 level. The British pound faced strong selling pressure against major currencies following Wednesday's release of UK Consumer Price Index data. The Office for National Statistics (ONS) reported that the annual growth rate of core CPI, which excludes volatile components such as food, energy, alcohol, and tobacco, was 3.5%, below expectations. Economists forecast underlying price pressures to rise by 3.7%, compared to the previous reading of 3.6%. Headline inflation rose steadily to 3.8% year-over-year, below expectations of 4.0%. On a monthly basis, prices remained stable after a 0.3% increase in August. Services inflation, a closely watched indicator by the Bank of England, remained unchanged at 4.7%. Signs of easing price pressures will strengthen market expectations for further BoE rate cuts throughout the year. Last week, with the release of employment data for the three months ending in August, which showed rising unemployment and slowing wage growth, dovish expectations for the BoE increased.
The daily chart shows GBP/USD trading just above 1.3350. Recent price action suggests a period of consolidation following a series of lower highs and higher lows. The pair remains trapped between its 50-day simple moving average of 1.3468 and its 200-day simple moving average of 1.3215, a range that reflects hesitation among traders. The 14-day Relative Strength Index (RSI) is currently hovering near 40, indicating a slightly bearish momentum bias, but not yet entering oversold territory. This suggests sellers have the upper hand. The exchange rate has repeatedly tested 1.3248 (the October 15 low) and the 200-day simple moving average at 1.3215, indicating that these levels continue to serve as key dynamic support. Meanwhile, attempts to rebound towards 1.3400 (the round-number mark) and the 50-day simple moving average at 1.3468 have failed to gain momentum, highlighting the importance of these levels as near-term resistance. GBP/USD is likely to remain range-bound until the pair fails to decisively break through 1.3468 or fall below 1.3215.
Consider a long position on the British pound at 1.3346 today. Stop-loss: 1.3332 Target: 1.3400, 1.3410
USD/JPY
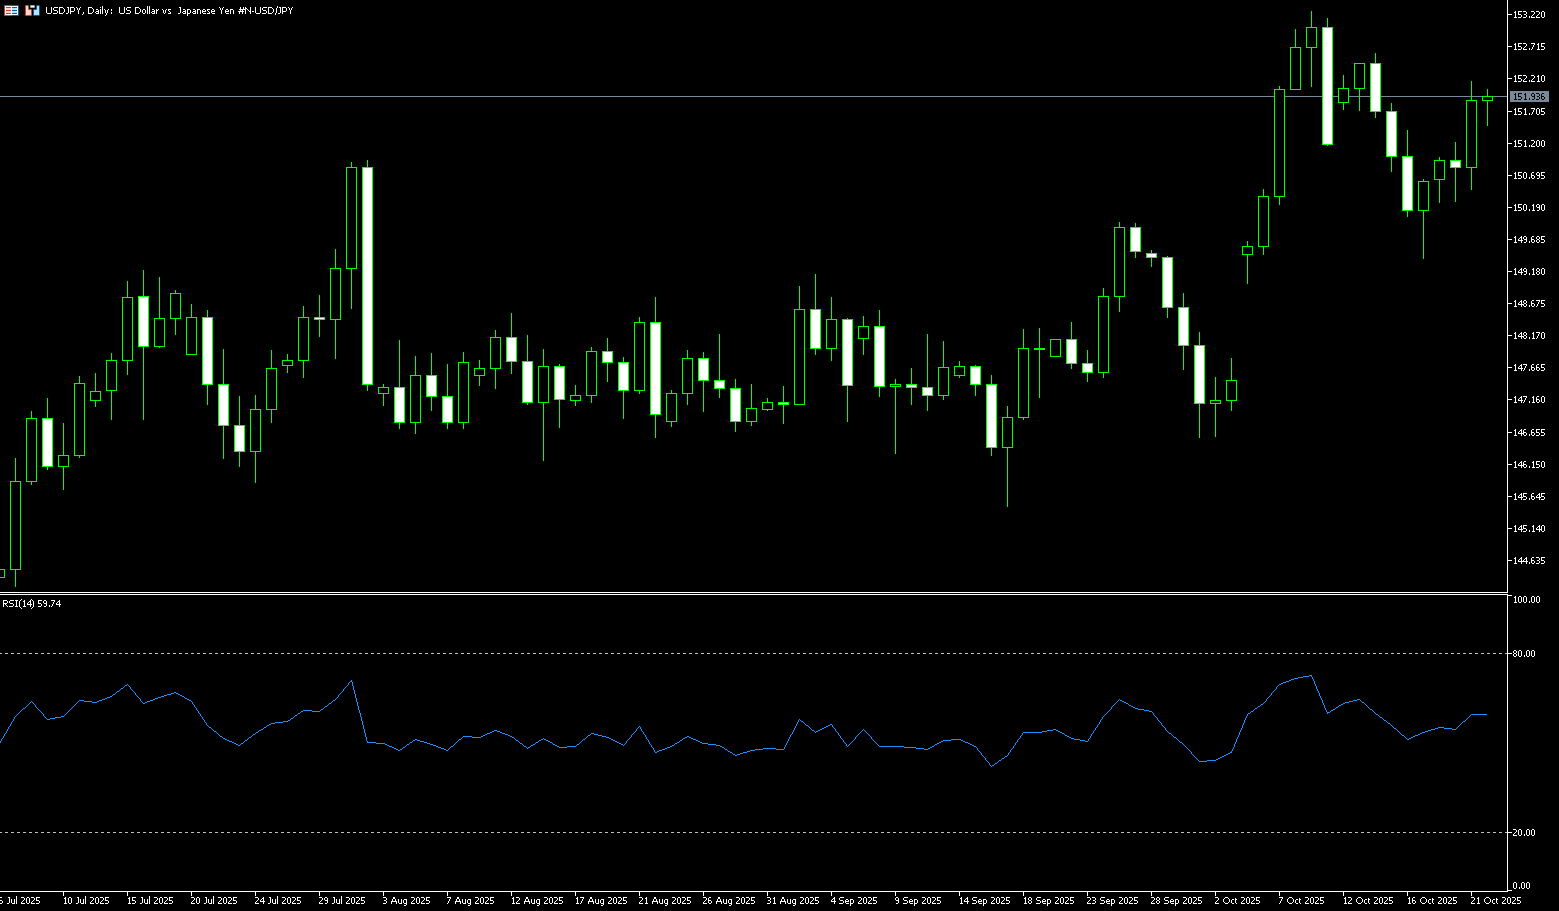
The USD/JPY exchange rate attracted some buying during early Asian trading on Wednesday, rising to around 152.00 for the first time in six days. The yen weakened against the dollar following the election of the dovish Taro Aso as Prime Minister of Japan. Japan's parliament elected the far-right conservative Aso as the country's first female prime minister on Tuesday. Aso pledged to strengthen Japan's economy and defense and deepen ties with the United States. His election was the result of an alliance between the ruling Liberal Democratic Party and the Japan Innovation Party, which reportedly signed a coalition agreement over the weekend. Aso's support for fiscal stimulus and loose monetary policy has kept traders on edge and added uncertainty to the Bank of Japan's path for interest rate hikes. Markets generally expect the Bank of Japan to further delay any rate hikes, which could put pressure on the yen and benefit cross-currency pairs in the short term.
The daily chart shows a slight mid-week technical pullback to 151.80. Technical analysis on the daily chart suggests that the pair's ongoing bullish bias remains intact. On the upside, initial resistance lies at 152.61, the recent high set on October 14. A break above this level would allow the pair to explore the psychological level of 153.00 and the eight-month high of 153.27, reached on October 10. Immediate support lies at 150.47 (Tuesday's low). A break below this level would weaken short-term price momentum and push USD/JPY towards a test of the psychological level of around 150.00. Further declines would establish a bearish bias and exert downward pressure on the pair, potentially causing it to hover around the low of its 34-day simple moving average at 149.21.
Consider shorting the US dollar at 152.10 today. Stop loss: 152.35, target: 151.00
EUR/USD
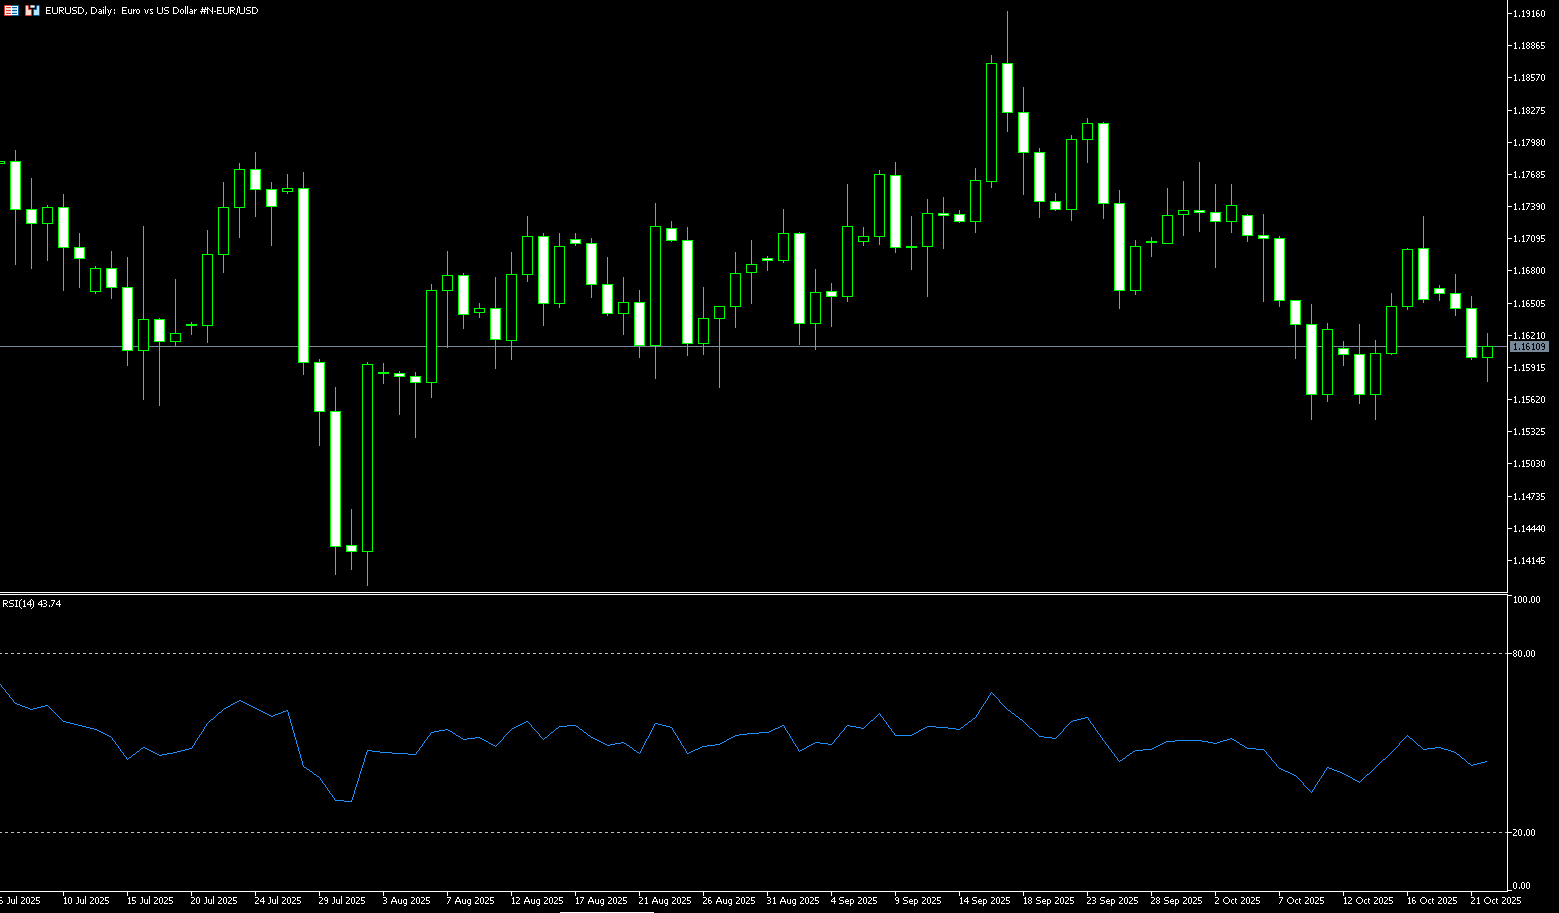
After three days of decline, the EUR/USD pair attempted to stabilize around 1.1600 during Wednesday's European session. The major currency pair faced challenges finding support as the US dollar maintained its recent upward trend, which came amid easing US-China trade tensions. Another factor driving the dollar's strength is growing market expectations for a possible reopening of the federal government after a nearly three-week shutdown. On Monday, White House economic advisor Kevin Hassett stated that he believed the shutdown could end sometime this week. Meanwhile, the euro remained cautious ahead of speeches by ECB President Christine Lagarde and Vice President Luis de Guindos, the latter scheduled for early North American trading. The next major trigger for the euro will be the ECB's monetary policy announcement scheduled for next week.
EUR/USD has maintained its negative performance so far this week. Momentum indicators are showing some weakness: the Relative Strength Index (RSI) has fallen to around 44, suggesting additional losses are still on the horizon. Furthermore, the Average Directional Index (ADX) is below 16, indicating a lack of trend strength. A continuation of the current downtrend could open the door to a potential "double bottom" low at 1.1542 (October 9 and 14), followed by 1.1500 (round number), and the key 165-day simple moving average at 1.1450. A deeper decline would expose a retracement to the round number at 1.1400. Bulls, on the other hand, are looking for immediate targets at the Bollinger Band 1.1668, followed by 1.1728 (October 17 high), followed by another minor hurdle at the monthly high of 1.1778 (October 1). A break above the latter could bring the 1.1800 mark back into view.
Today, you can consider going long on EUR at 1.1596, stop loss: 1.1582, target: 1.1660; 1.1650
Disclaimer: The information contained herein (1) is proprietary to BCR and/or its content providers; (2) may not be copied or distributed; (3) is not warranted to be accurate, complete or timely; and, (4) does not constitute advice or a recommendation by BCR or its content providers in respect of the investment in financial instruments. Neither BCR or its content providers are responsible for any damages or losses arising from any use of this information. Past performance is no guarantee of future results.
More Coverage


Risk Disclosure:Derivatives are traded over-the-counter on margin, which means they carry a high level of risk and there is a possibility you could lose all of your investment. These products are not suitable for all investors. Please ensure you fully understand the risks and carefully consider your financial situation and trading experience before trading. Seek independent financial advice if necessary before opening an account with BCR.

 English
 简体中文
简体中文
 繁體中文
繁體中文
 Bahasa
Melayu
Bahasa
Melayu
 Tiếng
Việt
Tiếng
Việt
 ไทย
ไทย
 日本語
日本語
 한국어
한국어
 ភាសាខ្មែរ
 español