


0
US Dollar Index
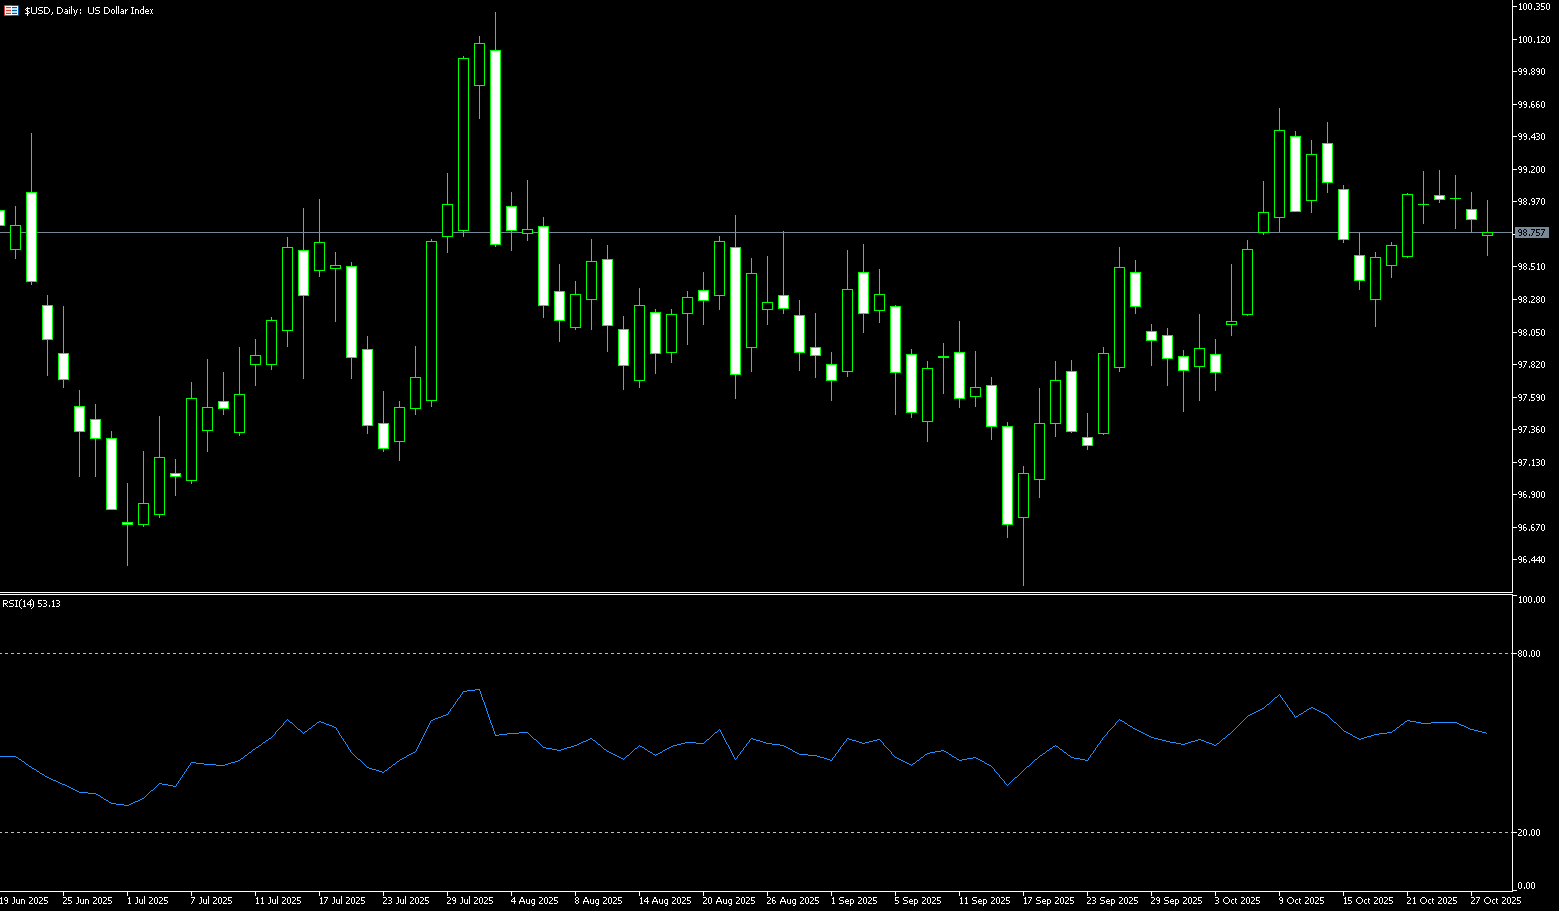
The US dollar index fell to around 98.65 on Tuesday, hitting a one-week low, as optimism about a potential US-China trade deal dampened demand for safe-haven currencies, while investors prepared for the Federal Reserve's policy meeting. The United States and China have agreed on the framework of a potential trade deal, to be signed this week by Presidents Trump and Xi Jinping, which includes agreements on rare earth minerals, soybean purchases, and TikTok. President Trump will also meet with Japanese Prime Minister Sanae Takaichi later today to discuss trade relations, defense spending, and potential Japanese investment in the United States. Meanwhile, the Federal Reserve is widely expected to cut interest rates by 25 basis points on Wednesday, and the market will be closely watching for any hints of another move in December. The central banks of Japan and the European Union are also expected to keep interest rates unchanged this week.
Despite the weaker intraday trend, the US dollar index was able to hold above the key support range of 98.11 (100-day simple moving average) to 98.32 (30-day simple moving average), indicating potential buying interest. The short-term directional bias depends on the Fed's decision on Wednesday, but any signs of a slowdown in the pace of quantitative tightening or a rise in the attractiveness of US dollar yields could provide new support. On the upside, a break above the 99.00 round-figure mark and the 99.14 area (October 23 high) would signal renewed buying interest, potentially leading to a retest of the monthly high of 99.56. However, any break below this area could accelerate the decline toward key support between the 100-day simple moving average (SMA) at 98.11 and the 30-day SMA at 98.32. A break below this level would target the 98.00 round-figure mark.
Consider shorting the US Dollar Index at 98.80 today. Stop-loss: 98.93. Targets: 98.30, 98.40.
WTI Spot Crude Oil
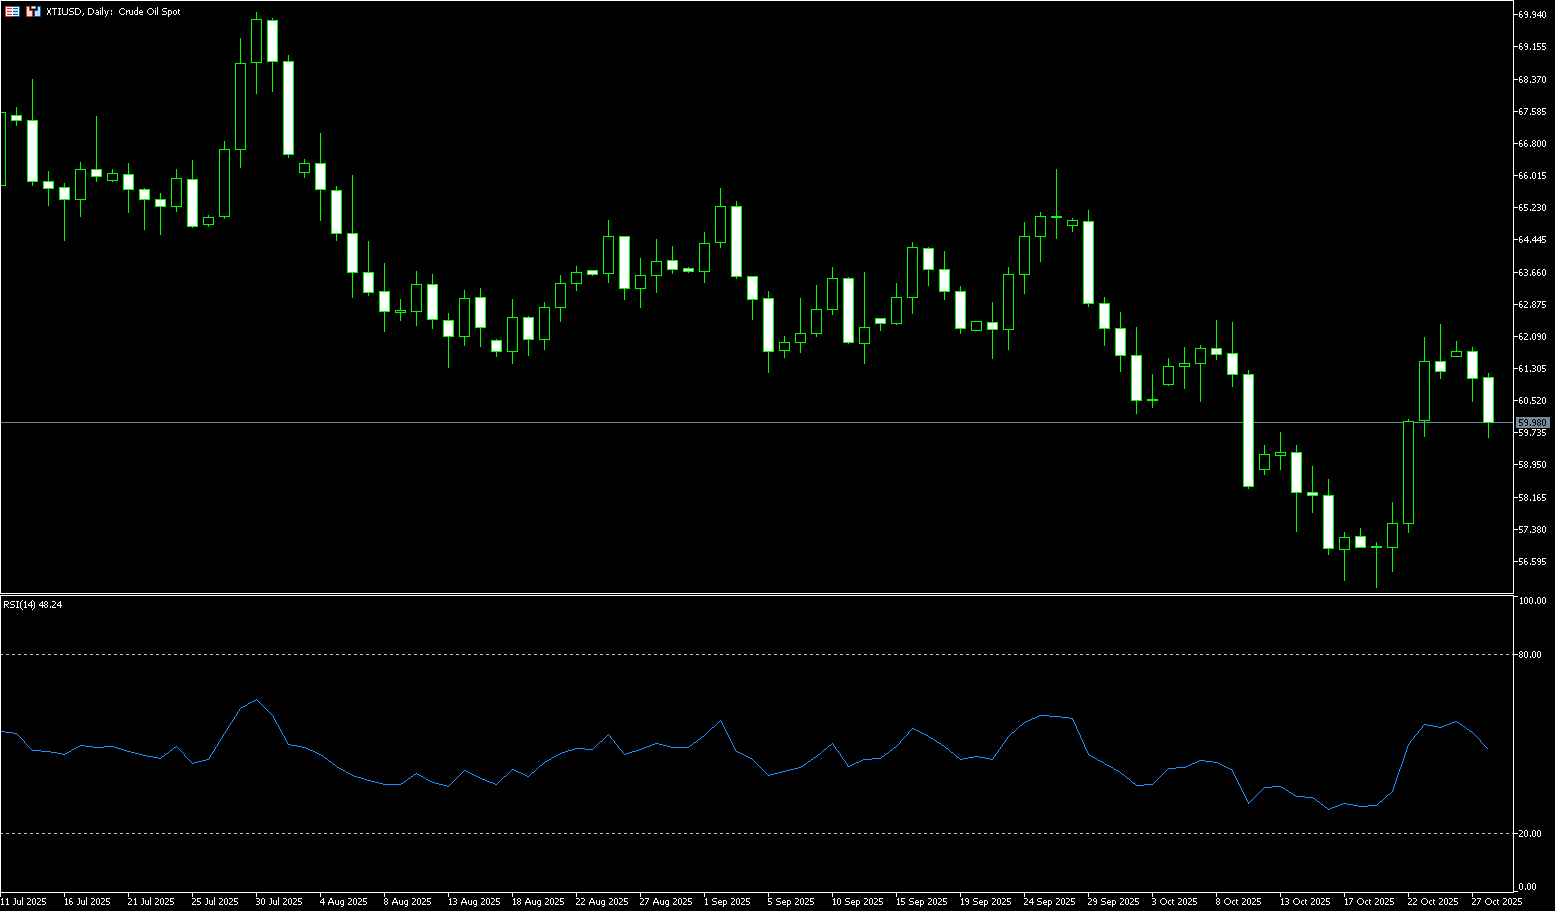
WTI crude oil is trading around $60.00 per barrel, having earlier dipped to a low of $59.60, as OPEC's production increase plan once again overshadowed hopes of a trade deal framework and the impact of re-imposed US sanctions on Russia. Concerns about sluggish demand weighed on the market, sending crude oil to its lowest point since May earlier this month. However, renewed US sanctions on Russia, coupled with stronger-than-expected US demand, helped boost prices. OPEC and its allies reversed course this year, reversing their previous production cuts to regain market share, which has helped to contain prices to some extent. Based on the core logic of "capacity clearing → supply contraction → oil price boost," while prices may be suppressed in the short term by the inertia of falling oil prices, the cumulative effects of capacity reductions will gradually become apparent in the medium term, potentially providing clear support for long positions in crude oil trading.
Given that WTI crude oil has encountered resistance at a major technical level and global demand concerns have eased following progress in Sino-US trade, the short-term outlook for oil prices is bearish. Crude oil has re-established its 50-day simple moving average at $61.96 and the $62.00 level (round-number level), and is poised to test the $63.43 level (89-day simple moving average). Otherwise, the path of least resistance remains further downside. Traders are currently targeting the next downside target between the psychologically important $60.00 level and the $59.80 level (20-day simple moving average). A break below this level would target the $59.24 level (9-day simple moving average), followed by the $58.00 level.
Consider going long on crude oil at $59.85 today. Stop-loss: $59.68. Targets: $61.60, $61.80.
Spot Gold
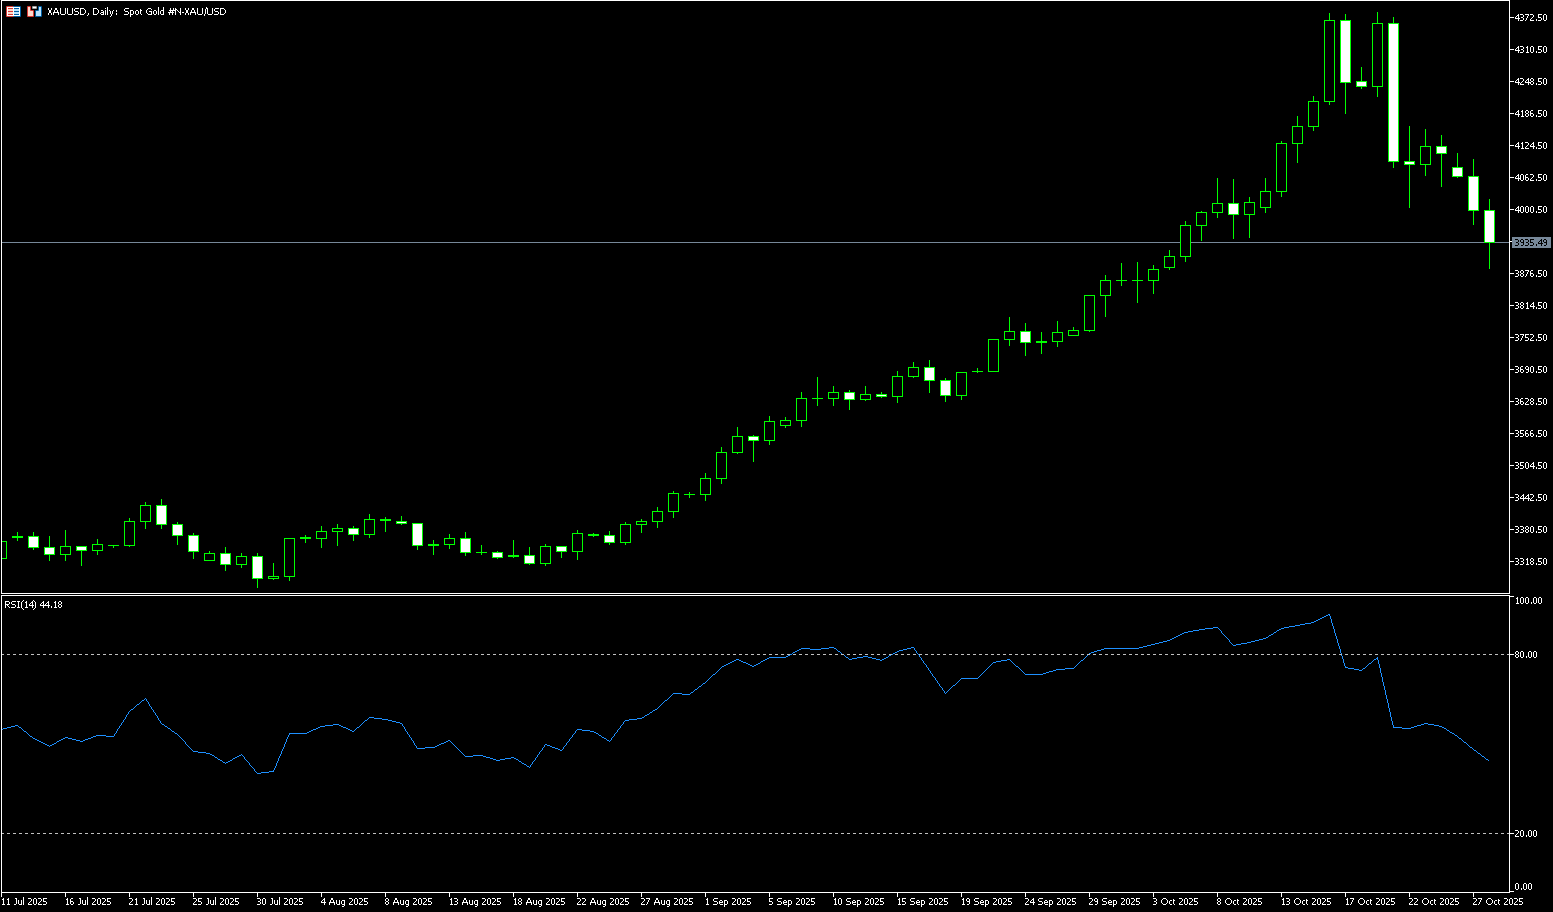
Gold fell for a third consecutive day during the European session on Tuesday, retreating from above $4,000 to a near three-week low of $3,886. While expectations of a Fed rate cut are weighing on the US dollar, the easing of US-China trade relations has weakened safe-haven demand, putting pressure on gold prices. Meanwhile, uncertainty surrounding the Russia-Ukraine situation has limited the extent of the decline. The market remains cautious ahead of the outcome of the two-day Fed meeting, and gold prices are likely to fluctuate between $3,900 and $4,000 in the short term. Progress in US-China trade negotiations has been the primary driver of the decline in gold prices. Gold prices experienced significant profit-taking before their rapid rise from around $3,800 to $4,400 in the first three weeks of October. Amidst easing trade tensions, some investors took profits, prompting a technical sell-off. This technical correction, combined with fundamental factors, further exacerbated the decline in gold prices.
In the short term, gold prices are likely to continue to face downward pressure. Progress in US-China trade negotiations, strong global stock markets, and rising US Treasury yields are all weakening gold's safe-haven appeal. Despite short-term pressure on gold prices, its long-term appeal remains intact. Geopolitical risks, inflation expectations, and monetary policy uncertainty remain key factors supporting gold prices. From a technical perspective, gold prices have been consolidating between $4,000 (the psychological barrier) and $3,864 (the 89-day simple moving average) since retreating from a high of $4,391.60. Structurally, the market is experiencing a weak "lower highs, lower lows" pattern of fluctuations. The 20-day simple moving average of $4,070 and the $4,100 mark present strong resistance above. Downside, focus is on the temporary support levels of $3,886 (Tuesday's and nearly three-week lows), $3,864 (the 89-day simple moving average), and $3,900 (the round number mark).
Consider going long on gold at 3,945 today. Stop-loss: 3,940. Targets: 3,980, 3,990.
AUD/USD
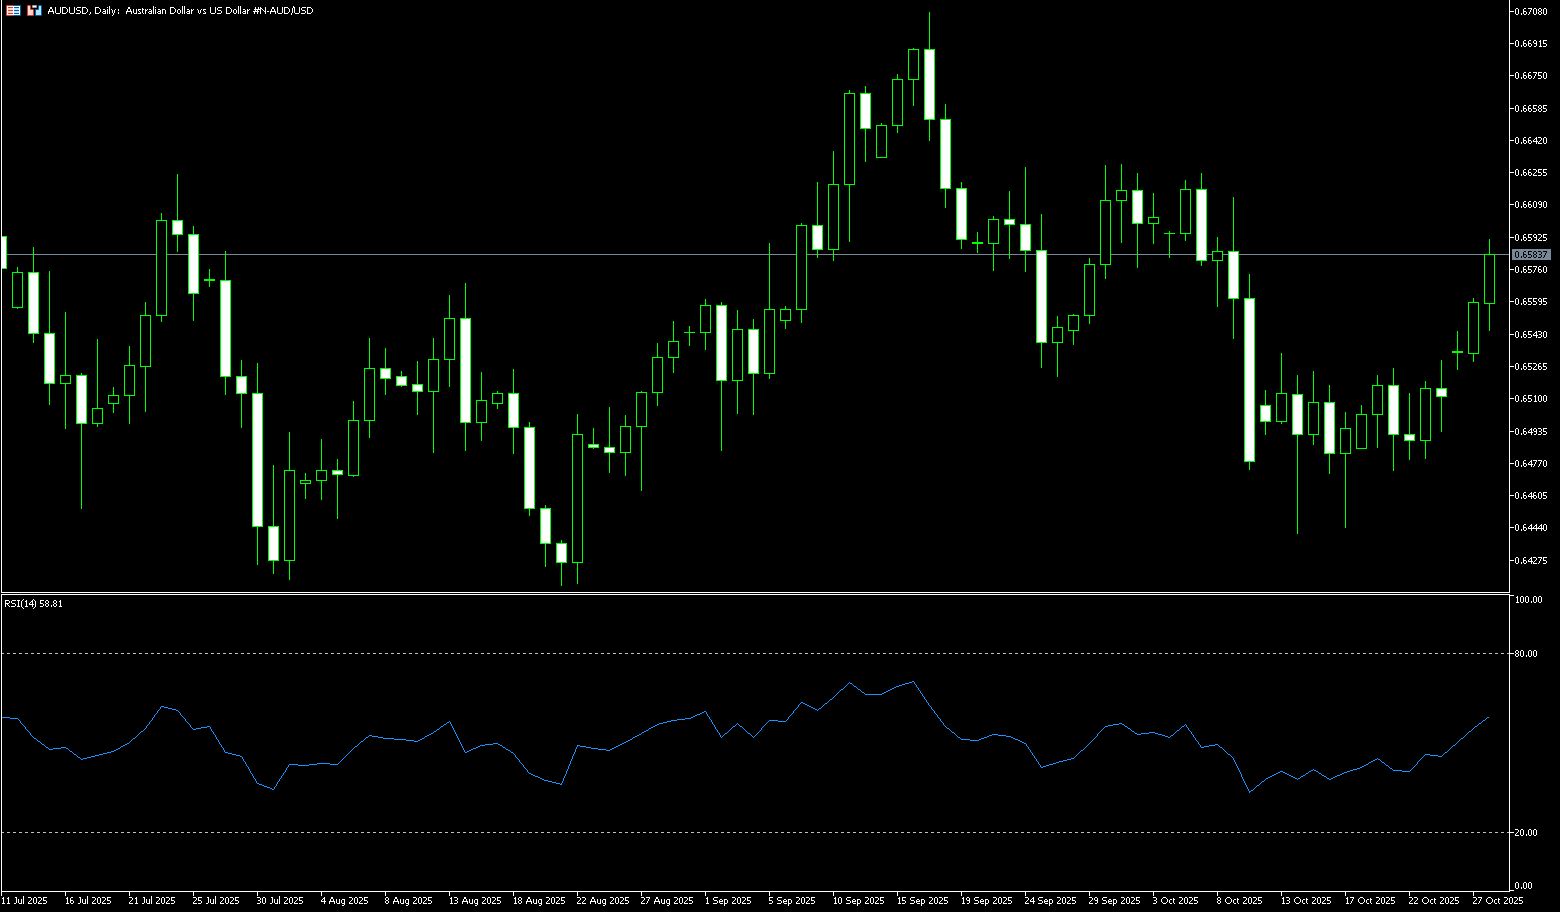
The Australian dollar rose to around $0.6590 on Tuesday, reaching its highest level in nearly three weeks, supported by a weaker US dollar. The dollar weakened ahead of Wednesday's Federal Reserve meeting, where markets anticipate a 25 basis point interest rate cut. Optimism about a potential US-China trade deal also dampened safe-haven demand. In Australia, attention now turns to Wednesday's third-quarter inflation data and the monthly Consumer Price Index report for September, which may shed further light on interest rate trends. Market expectations for a rate cut have fallen significantly, now at just 15%, significantly lower than Reserve Bank of Australia Governor Michelle Bullock's reiteration that the labor market remains "somewhat tight," despite a sharp drop from the previous 60% probability after the unemployment rate rose more than the RBA expected.
The Australian dollar traded around $0.6580 against the US dollar on Tuesday. Technical analysis on the daily chart shows the pair has slightly broken through the upper line of its descending channel, indicating signs of a bullish reversal. Meanwhile, the pair remains above the 9-day (0.6512) and 14-day (0.6510) simple moving averages. This, combined with the formation of a bullish "golden cross" pattern between the 9-day and 14-day moving averages, suggests strong short- and medium-term price momentum. On the upside, immediate resistance lies at the psychological level of 0.6600 and the 12-month high of 0.6624 on October 7. A break above these levels would support the AUD/USD pair in exploring the 12-month high of 0.6707 reached on September 17. Initial support lies at the 9-day (0.6512) and 14-day (0.6510) simple moving averages. A break below these levels would renew the bearish bias and push the AUD/USD pair towards the 0.6443 (October 17 low) and 0.6438 (200-day simple moving average) areas.
Consider a long AUD at 0.6570 today, with a stop-loss at 0.6560 and targets at 0.6630 and 0.6640.
GBP/USD
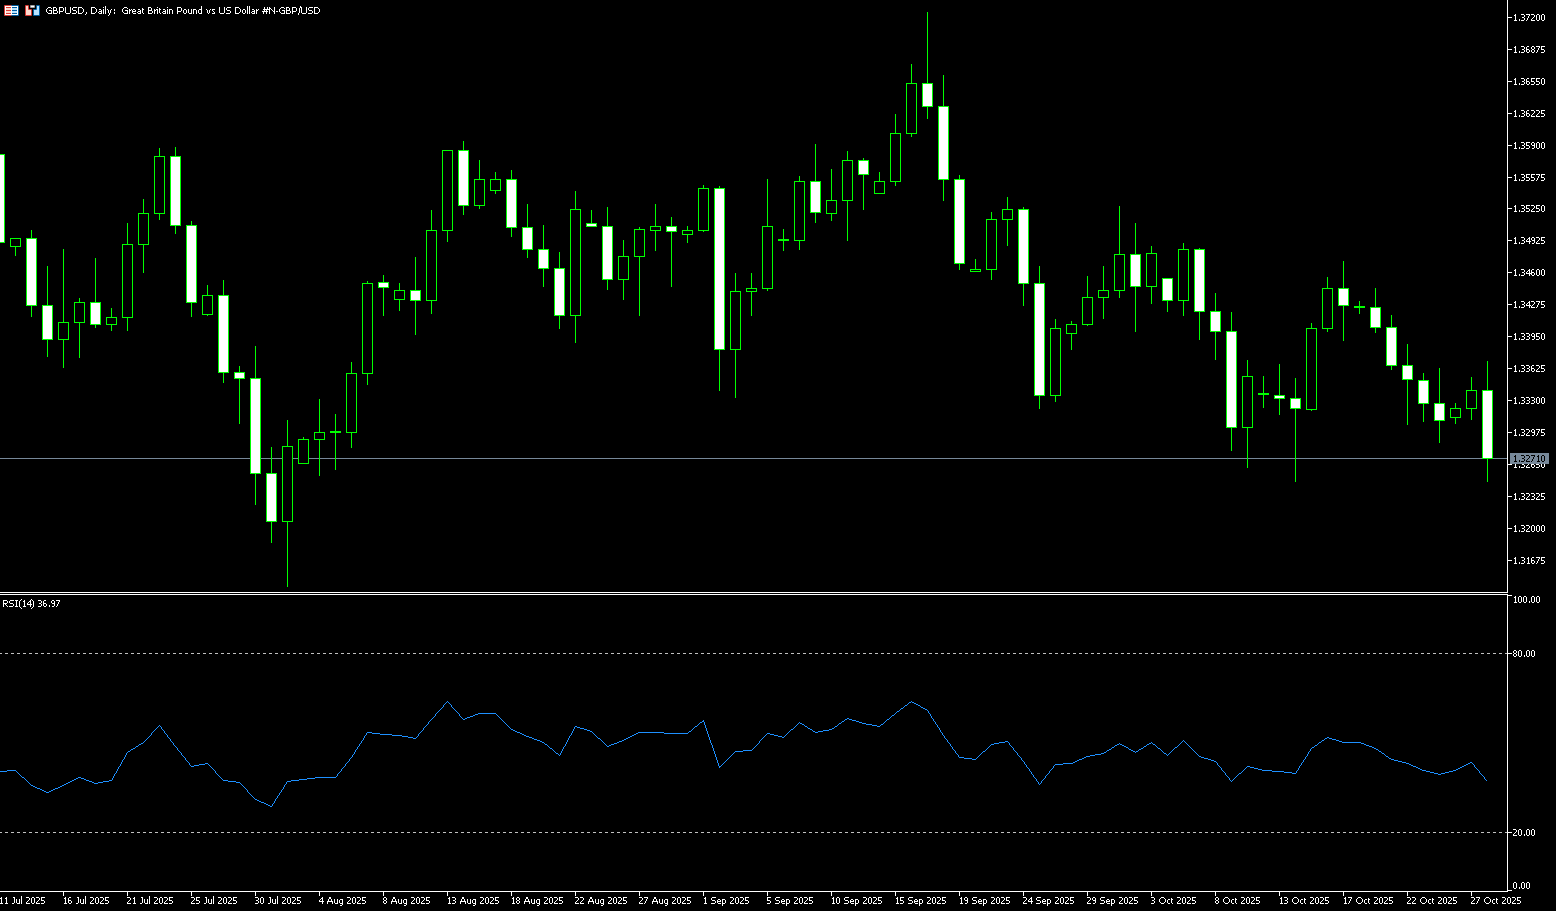
GBP/USD started the new week on a slightly positive note, holding just below the 1.3300 round-figure mark during the American session, despite a lack of sustained buying. Furthermore, the fundamental backdrop suggests that the path of lowest resistance for the spot price remains downward, supporting a continuation of the six-day downtrend. The British pound continues to underperform relative to the dollar amid growing expectations of further easing by the Bank of England, which in turn acts as resistance for GBP/USD. Furthermore, concerns about the UK's fiscal outlook ahead of the crucial November Autumn Budget could further limit GBP/USD's gains. On the other hand, the US dollar struggled to continue its gains after rebounding from a one-week low on Friday, as markets bet on two more interest rate cuts from the Federal Reserve this year. Furthermore, concerns about a prolonged US government shutdown have weakened the dollar.
The daily chart clearly shows that the British pound is hovering in the lower half of the Bollinger Band, with the current price trading above the lower Bollinger Band at 1.3270. Indicator parameters show the central axis of the Bollinger Band at approximately 1.3391, and the upper Bollinger Band at approximately 1.3509. In terms of price structure, the previous high of 1.3527 (01/10) was followed by a decline to the secondary high of 1.3471 (17/10) before retreating to 1.3248 and rebounding, forming a short-term convergence pattern characterized by unformed higher lows and established lower highs. The current price's repeated tests of the lower band at 1.3270 suggest a typical pattern of "weak mean reversion": rallies often end at the middle band at 1.3391, with little potential to extend to the upper band at 1.3509. If the range between 1.3287 (last week's low) and 1.3270 (lower Bollinger band) continues to break, a retest of 1.3248 (October 14 low) will be the target; a break below this level could push the price towards 1.3200.
Today, consider buying GBP at 1.3270, with a stop-loss at 1.3260 and targets at 1.3320 and 1.3330.
USD/JPY
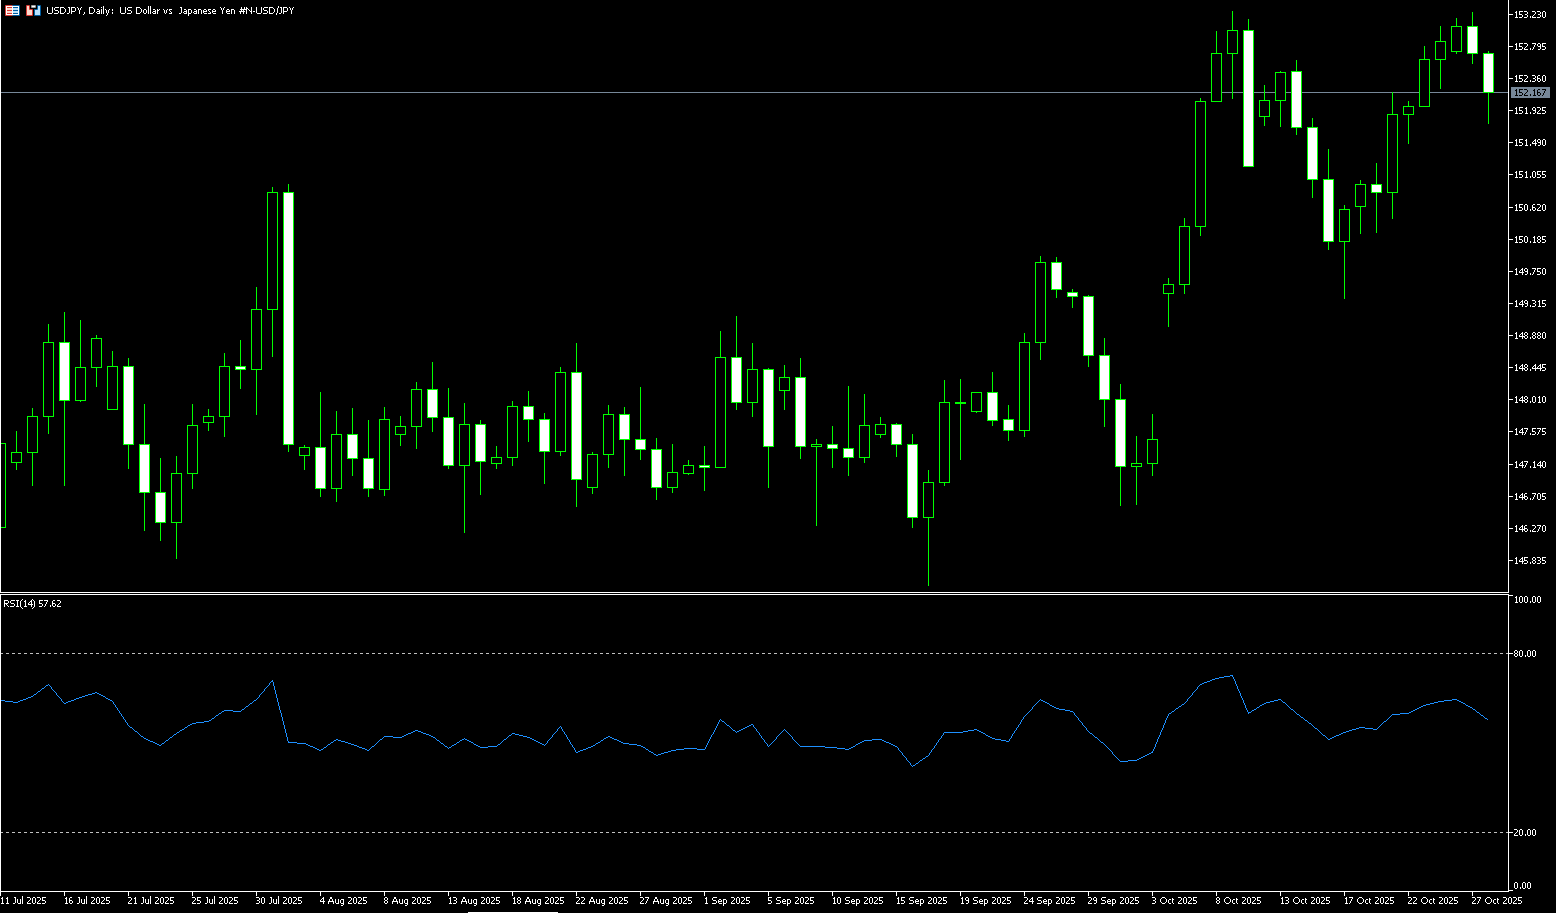
During early Asian trading on Tuesday, USD/JPY dipped to a low just below 152.00. However, potential downside may be limited by optimism about the US-China trade deal. Traders will closely monitor Wednesday's Federal Reserve interest rate decision. Thursday's Bank of Japan rate decision will be in focus. The US and China reached a preliminary agreement after officials announced a series of agreements to ease tensions. Positive progress in easing trade tensions could boost risk appetite and weaken safe-haven currencies like the yen. Regarding the yen, new Japanese Prime Minister Sanae Takaichi is expected to maintain an expansionary spending policy and resist premature tightening, which could put pressure on the yen and create tailwinds for the currency pair. Traders will closely monitor guidance from Bank of Japan Governor Ueda after the meeting for new catalysts.
The USD/JPY pair's failure to reach near its monthly swing high (around the 153.25-153.30 area) at the beginning of the week and the subsequent decline warrant caution for USD/JPY bulls. However, positive oscillators on the daily chart support the possibility of some dip buying around the 152.00 round number. A decisive break below the latter could negate the positive outlook and pave the way for a deeper decline towards the 151.13 (20-day simple moving average), with some intermediate support around the 151.50-151.45 area. On the other hand, the 152.90-153.00 area currently appears to be acting as immediate resistance ahead of the 153.25-153.30 range. A breakout of this range could see the pair aim to recapture the 154.00 round-figure mark. Momentum could extend further to the next relevant resistance level near the mid-154.00 level, leading to the 154.75-154.80 range and the psychological level of 155.00.
Consider shorting the USD at 152.30 today. Stop-loss: 152.50 Target: 151.40 151.20
EUR/USD
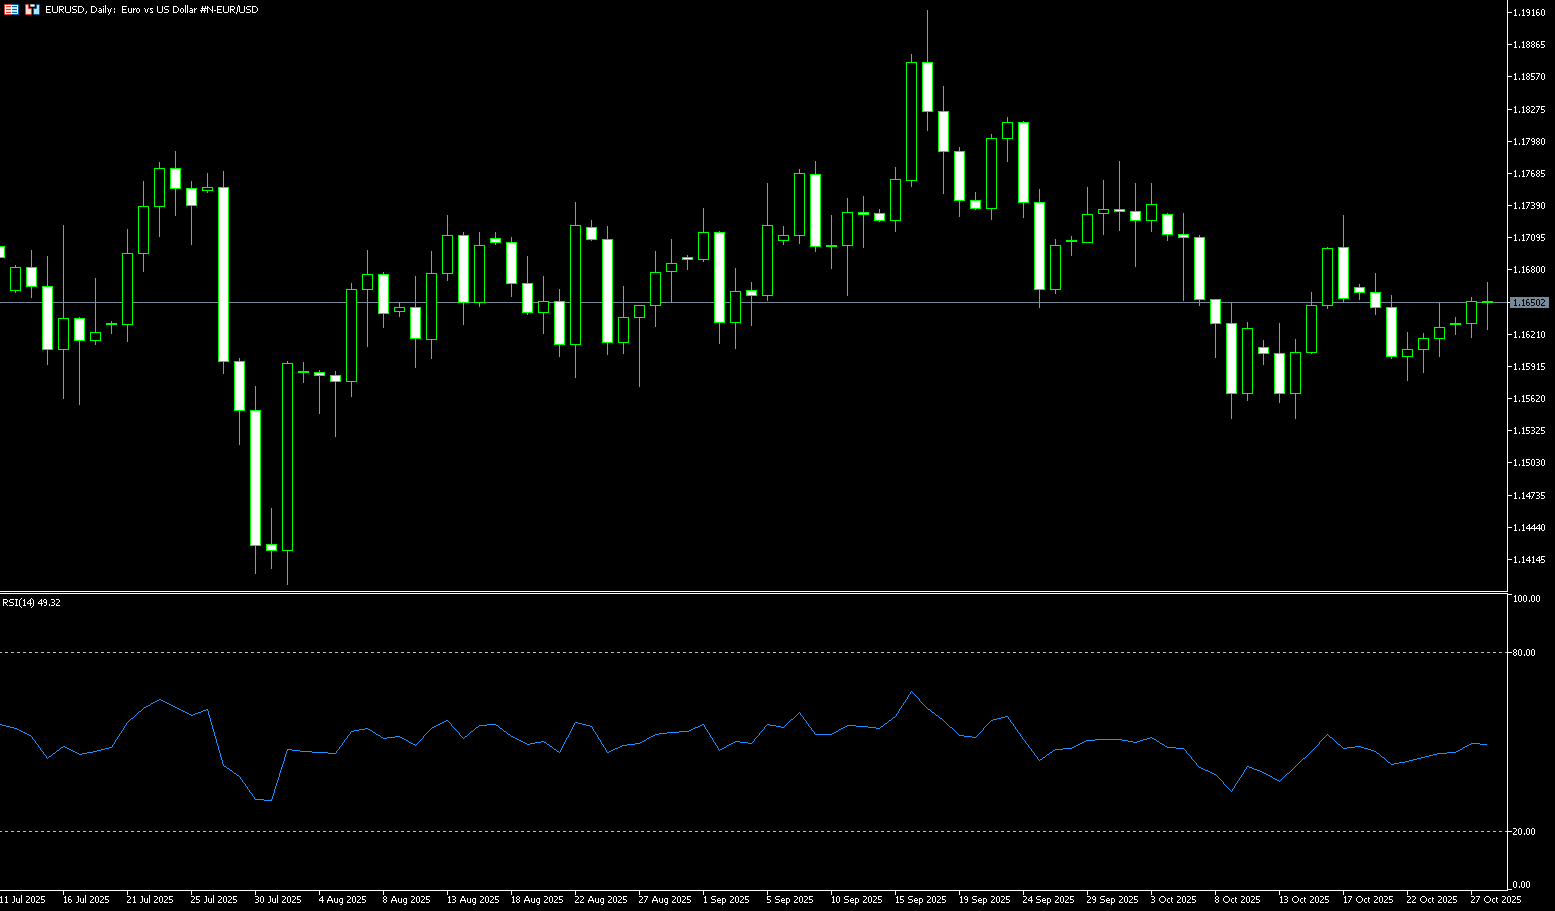
The euro hovered around $1.1650, little changed from last week's levels, as markets entered a critical week filled with global trade negotiations, central bank meetings, and key European economic data releases. Investors welcomed signs of progress in US-China trade talks, with attention now turning to Thursday's meeting between Presidents Trump and Xi Jinping, expected to finalize the framework for a preliminary agreement discussed over the weekend. Meanwhile, the European Central Bank is widely expected to keep interest rates unchanged at its meeting on Thursday, while the Federal Reserve is expected to lower borrowing costs amid signs of a slowing labor market and weaker-than-expected inflation. Later this week, the Eurozone will release preliminary third-quarter GDP data and October inflation figures, providing further insight into the region's economic outlook.
From a technical perspective, EUR/USD remains confined within a descending channel, with price action remaining subdued ahead of this week's Federal Reserve and European Central Bank interest rate decisions. The pair is trading below the key 50-day simple moving average at 1.1688 and the 1.1700 (round number) area, forming strong resistance. A break above this resistance area would target the 1.1778 (October 1 high) level. Momentum indicators, on the other hand, remain bearish: the 14-day relative strength index (RSI) is slightly below 50.00, suggesting further declines, while the average directional index (ADX) is around 15, suggesting a lack of strength in the current trend. Downside support lies near the 120-day simple moving average at 1.1607 and the 1.1600 level, followed by last week's low of 1.1576. If the price breaks below this level, the next target will be 1.1532 (the 150-day simple moving average).
Today, consider going long on the euro at 1.1640, with a stop-loss at 1.1628 and a target at 1.1690 or 1.1700.
Disclaimer: The information contained herein (1) is proprietary to BCR and/or its content providers; (2) may not be copied or distributed; (3) is not warranted to be accurate, complete or timely; and, (4) does not constitute advice or a recommendation by BCR or its content providers in respect of the investment in financial instruments. Neither BCR or its content providers are responsible for any damages or losses arising from any use of this information. Past performance is no guarantee of future results.
More Coverage


Risk Disclosure:Derivatives are traded over-the-counter on margin, which means they carry a high level of risk and there is a possibility you could lose all of your investment. These products are not suitable for all investors. Please ensure you fully understand the risks and carefully consider your financial situation and trading experience before trading. Seek independent financial advice if necessary before opening an account with BCR.
BCR Co Pty Ltd (Company No. 1975046) is a company incorporated under the laws of the British Virgin Islands, with its registered office at Trident Chambers, Wickham’s Cay 1, Road Town, Tortola, British Virgin Islands, and is licensed and regulated by the British Virgin Islands Financial Services Commission under License No. SIBA/L/19/1122.
Open Bridge Limited (Company No. 16701394) is a company incorporated under the Companies Act 2006 and registered in England and Wales, with its registered address at Kemp House, 160 City Road, London, City Road, London, England, EC1V 2NX. This entity acts solely as a payment processor and does not provide any trading or investment services.

 English
 简体中文
简体中文
 繁體中文
繁體中文
 Bahasa
Melayu
Bahasa
Melayu
 Tiếng
Việt
Tiếng
Việt
 ไทย
ไทย
 日本語
日本語
 한국어
한국어
 ភាសាខ្មែរ
 español