


0
US Dollar Index
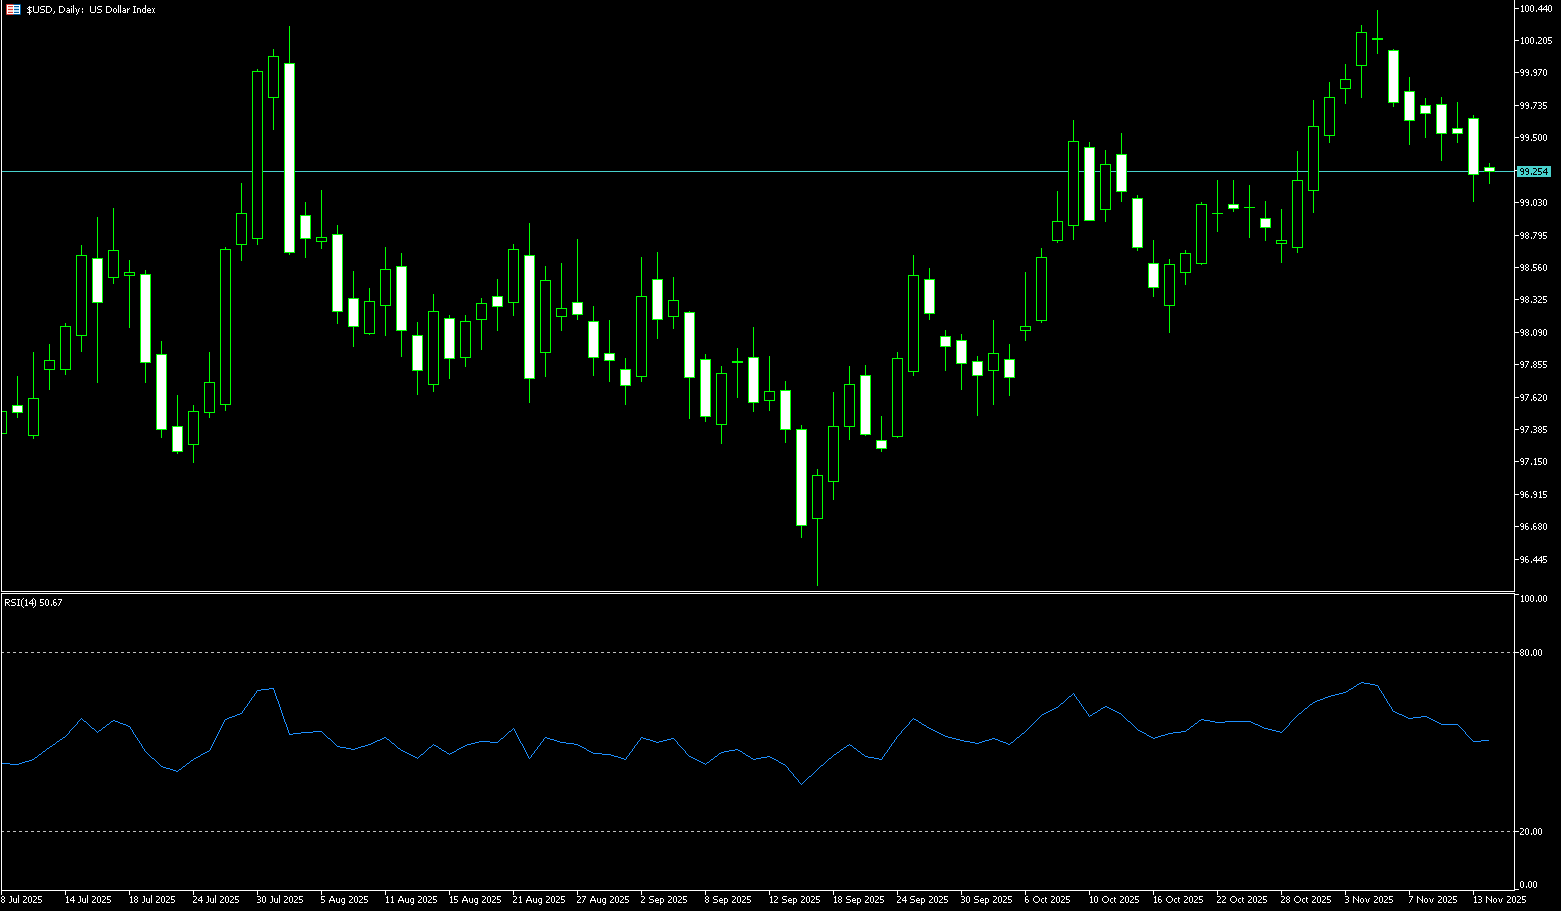
At the start of the week, the US dollar rose against the euro and the yen, as traders remained cautious ahead of long-awaited US economic data. With the federal government shutdown ending, a large amount of delayed data will be released this week, including Thursday's September non-farm payroll report, which will provide important clues about the health of the world's largest economy. Tightness in the US repo market and the rise in the effective federal funds rate directly reflect the increased cost of short-term dollar funding. The inverted yield curve, with the SOFR rate (4%) above the excess reserve rate (3.90%), attracts funds to the repo market, exacerbating pressure on the federal funds market. This strengthening of short-term interest rates usually enhances the dollar's attractiveness in the currency market, providing short-term support for the dollar exchange rate. The US dollar index may therefore remain relatively strong or fluctuate with a slightly bullish bias.
From the daily chart, the US dollar index rose at the start of the week but continues to fluctuate and consolidate within the range of 98.62 (50-day simple moving average) and 99.74 (last week's high). The 14-day Relative Strength Index (RSI) on the daily chart is around 56.05, suggesting that the short-term direction may be becoming clearer. On the other hand, the US Dollar Index formed a "minor double bottom" signal last Thursday at 98.98 and Friday at 99.00. The index may rise slightly in the next few days to the resistance area of 99.74 (last week's high) and the psychological level of 100.00. However, a significant upward move from these areas is unlikely. As for the downside, first watch the 34-day simple moving average at 99.09 and the psychological level of 99.00. A break above these levels would target the "minor double bottom" area formed last Thursday at 98.98 and Friday at 99.00.
Today, consider shorting the US Dollar Index around 99.68; Stop loss: 99.79; Target: 99.15; 99.05
WTI Crude Oil
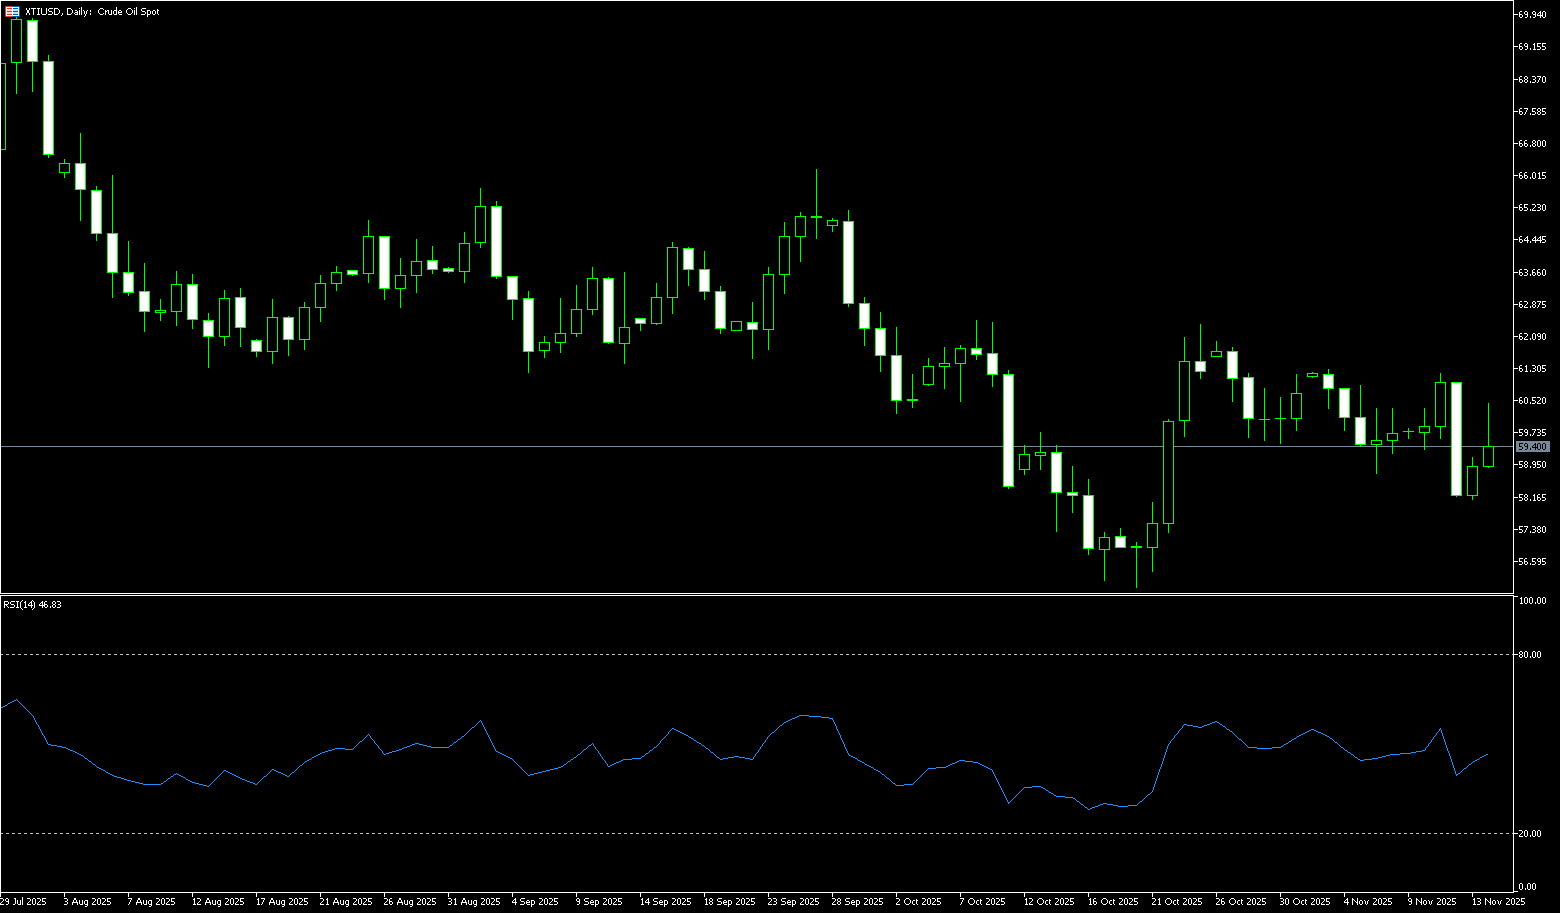
US WTI crude oil is trading around $60.60 per barrel. The price has rebounded above $60.00. News of the resumption of loading at the Russian port of Novorossiysk after the attack eased concerns about supply disruptions, but the continued attacks by Ukraine on Russian energy facilities keep the market on edge. Despite the resumption of port operations, Ukraine's intensified attacks on Russian oil infrastructure remain a focus of market attention. ING warned that the supply risks from the Ukrainian drone attacks are rising. Meanwhile, Iran's seizure of an oil tanker in the Gulf of Oman has also cast a shadow over the security of the vital oil shipping route, the Strait of Hormuz. Investors are closely watching the progress of Western sanctions against Russia; the US will ban transactions with Lukoil and Rosneft after November 21. Latest positioning data shows that as of last week, speculators increased their net long positions in Brent crude oil futures by 12,636 contracts, reaching 164,867 contracts. ING analysts believe this was mainly driven by short covering, indicating that market participants are unwilling to continue shorting amid uncertainty surrounding sanctions.
From a daily chart perspective, WTI crude oil maintains a weak and volatile pattern overall. Oil prices are trading below major moving averages, indicating significant trend pressure. The daily candlestick chart shows small-bodied fluctuations around $60, suggesting that neither bulls nor bears have a clear advantage. Technically, the 14-day Relative Strength Index (RSI) is in the neutral zone (52.80), showing no clear rebound signal; the MACD remains low and consolidating, indicating insufficient momentum. The key support level remains around last week's low of $58.12. A decisive break below this area would open up further downside potential to $57.31 (the low of October 22nd); the psychological level of $60.00 is the first resistance level that must be broken in the near term. If the price can hold above this level, then $61.49 (65-day simple moving average) will strengthen the short-term bullish bias and push oil prices to challenge the key resistance zone of $62.38 (October 24 high) and the 85-day moving average at $62.36.
Today, consider going long on WTI crude oil around $60.40; Stop loss: $60.20; Target: $61.80; $62.00
Spot Gold
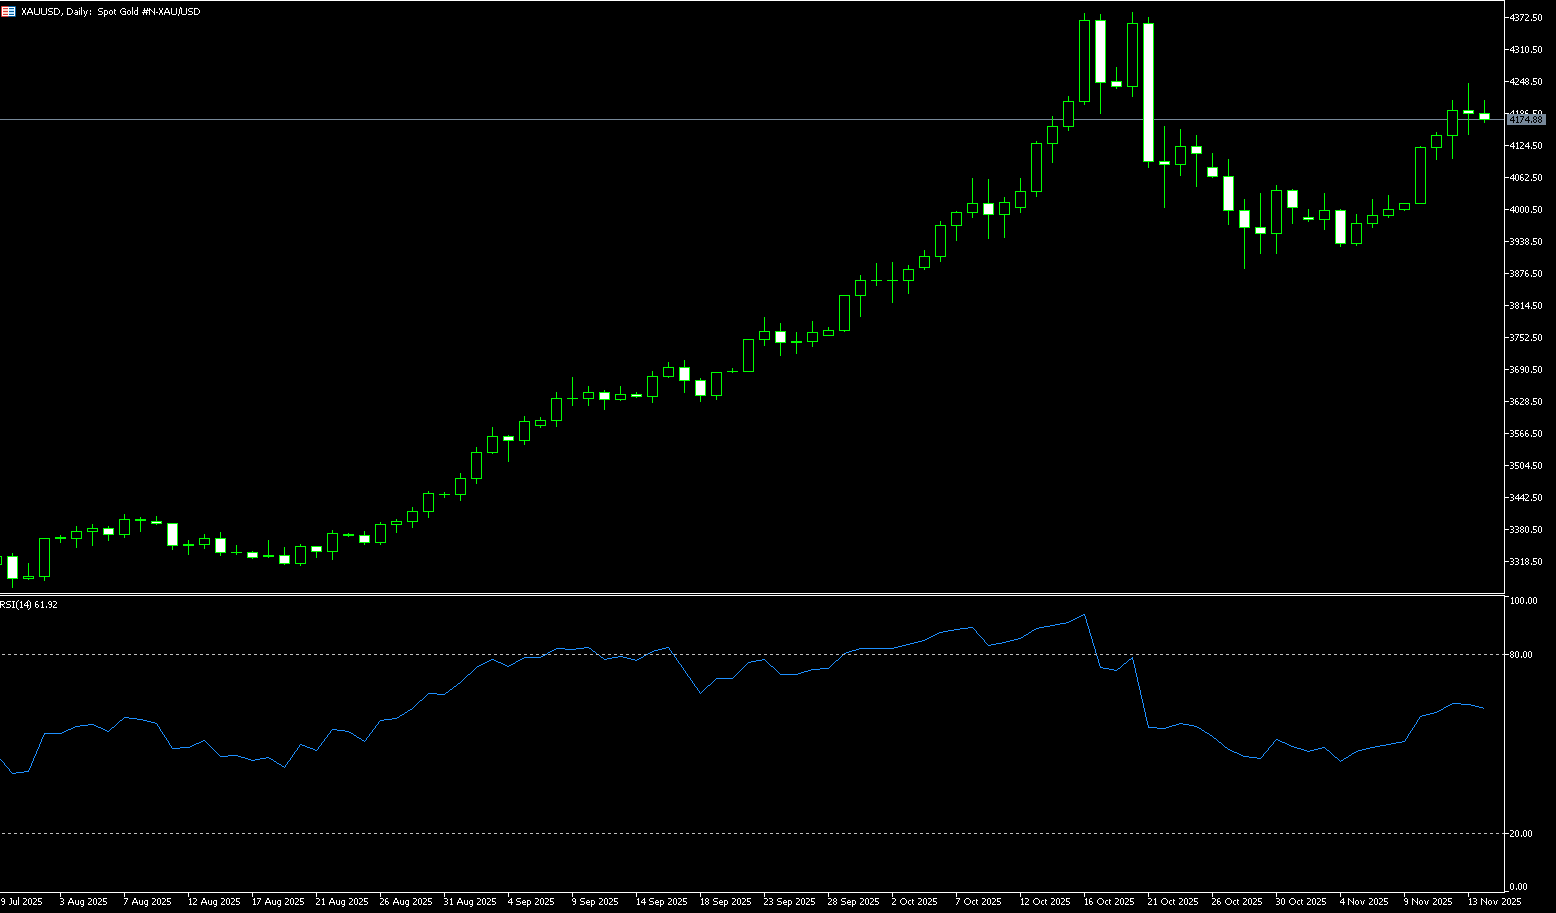
At the beginning of the week, spot gold plunged nearly 2%, hitting a low of $4006.90 per ounce, barely holding above $4045 at the close. The culprit was simple: the Federal Reserve further cooled expectations of a December rate cut, leading to a strong rebound in the US dollar index. With a stronger dollar, gold priced in dollars immediately became more expensive for holders of other currencies globally, naturally reducing buying interest significantly. On the other hand, the 10-year yield fell 1.7 basis points to 4.131%, and the yield curve flattened to 52.3 basis points. Superficially, this is positive for gold, but the market's real concern is that AI financing risks are spilling over into the entire credit market. Funds are beginning to flow back to US Treasuries as a safe haven, rather than into gold, and gold's "safe-haven premium" is being diluted. A short-term pessimism for gold is now widely accepted, but institutions remain generally optimistic in the medium to long term. In the short term, the $4,000 mark is teetering on the brink. If this week's September non-farm payroll data is unexpectedly strong, or if the Fed meeting minutes further reinforce a hawkish tone, gold prices are very likely to test the $3,900-$3,950 support zone. However, medium- to long-term gold bulls should not despair; gold could stage a triumphant rebound at any time.
From a technical perspective, the daily chart has become slightly bearish after the bearish trend at the end of last week. The sharp reaction in gold prices within the $4,000-$4,050 range highlights its importance—this is precisely the consolidation range for gold prices in the previous period, confirming the assessment that gold prices may have formed a temporary top. On the downside, this week's price action will help confirm whether the current pullback is still ongoing. If it continues to weaken, gold prices may test the $4,000 level, triggering a move towards $3,954 (the 50-day simple moving average), with $3,900 (the psychological level) becoming the next important support area. A decisive break below this level would indicate a more definitive downtrend and put significant pressure on the overall outlook for gold. On the upside, if buying momentum picks up again, the first resistance level is seen at $4,070 (the 10-day simple moving average), followed by the $4,100 level and $4,108 (Monday's high). A break above these resistance levels could see gold retest the $4,200-$4,250 range.
Today, consider going long on spot gold around 4,060; Stop loss: 4,055; Target: 4,095; 4,100
AUD/USD
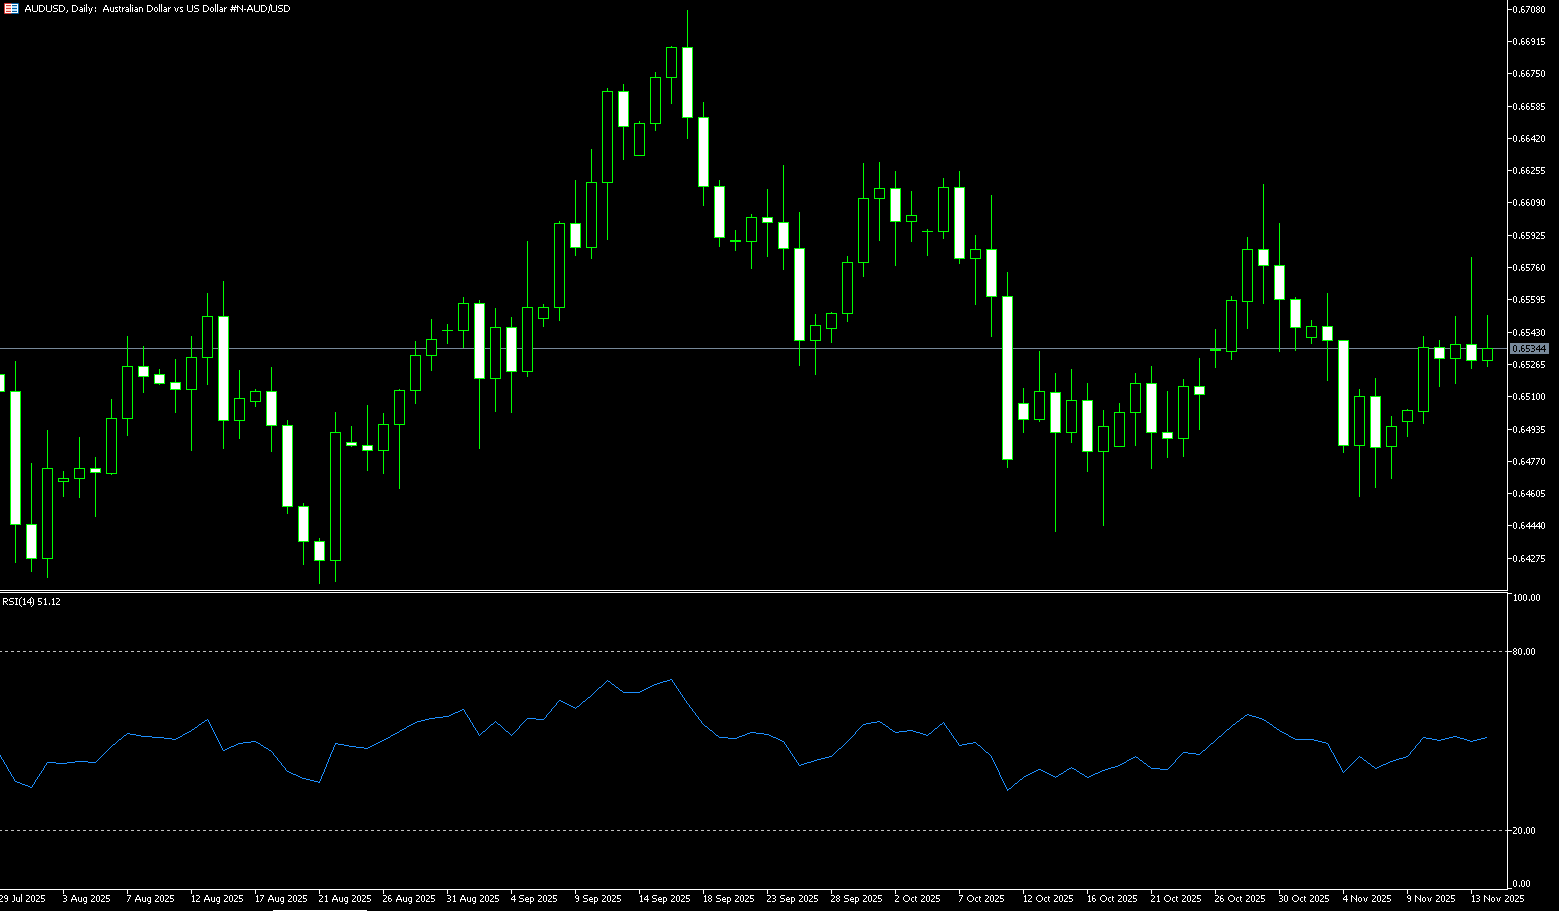
The Australian dollar initially fell to around US$0.6465 on Tuesday before rebounding above 0.6500 and fluctuating, as the Reserve Bank of Australia (RBA) indicated it would remain cautious and emphasized in its latest meeting minutes that future monetary policy would depend on data. Earlier this month, the RBA kept the cash rate at 3.60%, emphasizing its reluctance to further ease policy due to persistently high inflation, strong consumer demand, and a resurgence in the housing market. Furthermore, concerns about a weak labor market were significantly exaggerated, as employment surged and the unemployment rate fell in October. This prompted the market to significantly reduce the likelihood of policy easing in the near term, currently pricing in only a 40% chance of a rate cut next May. Nevertheless, the RBA acknowledged that monetary easing could still be necessary in certain circumstances, particularly if the labor market weakens or the overall economic recovery lags behind.
On Tuesday, the Australian dollar traded slightly above 0.6500, marking its second consecutive day of narrow-range trading. Daily chart analysis shows the pair consolidating within a rectangular range, reflecting a sideways trend. The pair is trading below the 10-day simple moving average at 0.6514, while the 14-day Relative Strength Index (RSI) has fallen to near a two-week low of 40-41, indicating weakening momentum. On the downside, key support lies at 0.6457 (the 200-day simple moving average), followed by the five-month low of 0.6414 recorded on August 21. On the other hand, AUD/USD may test the key resistance level of the 10-day simple moving average at 0.6514. A break above this level would improve short-term price momentum and bring the pair closer to the 50-day simple moving average at 0.6555 and the November 13 high of 0.6580.
Consider going long on the Australian dollar around 0.6495 today; Stop loss: 0.6482; Target: 0.6550; 0.6540
GBP/USD
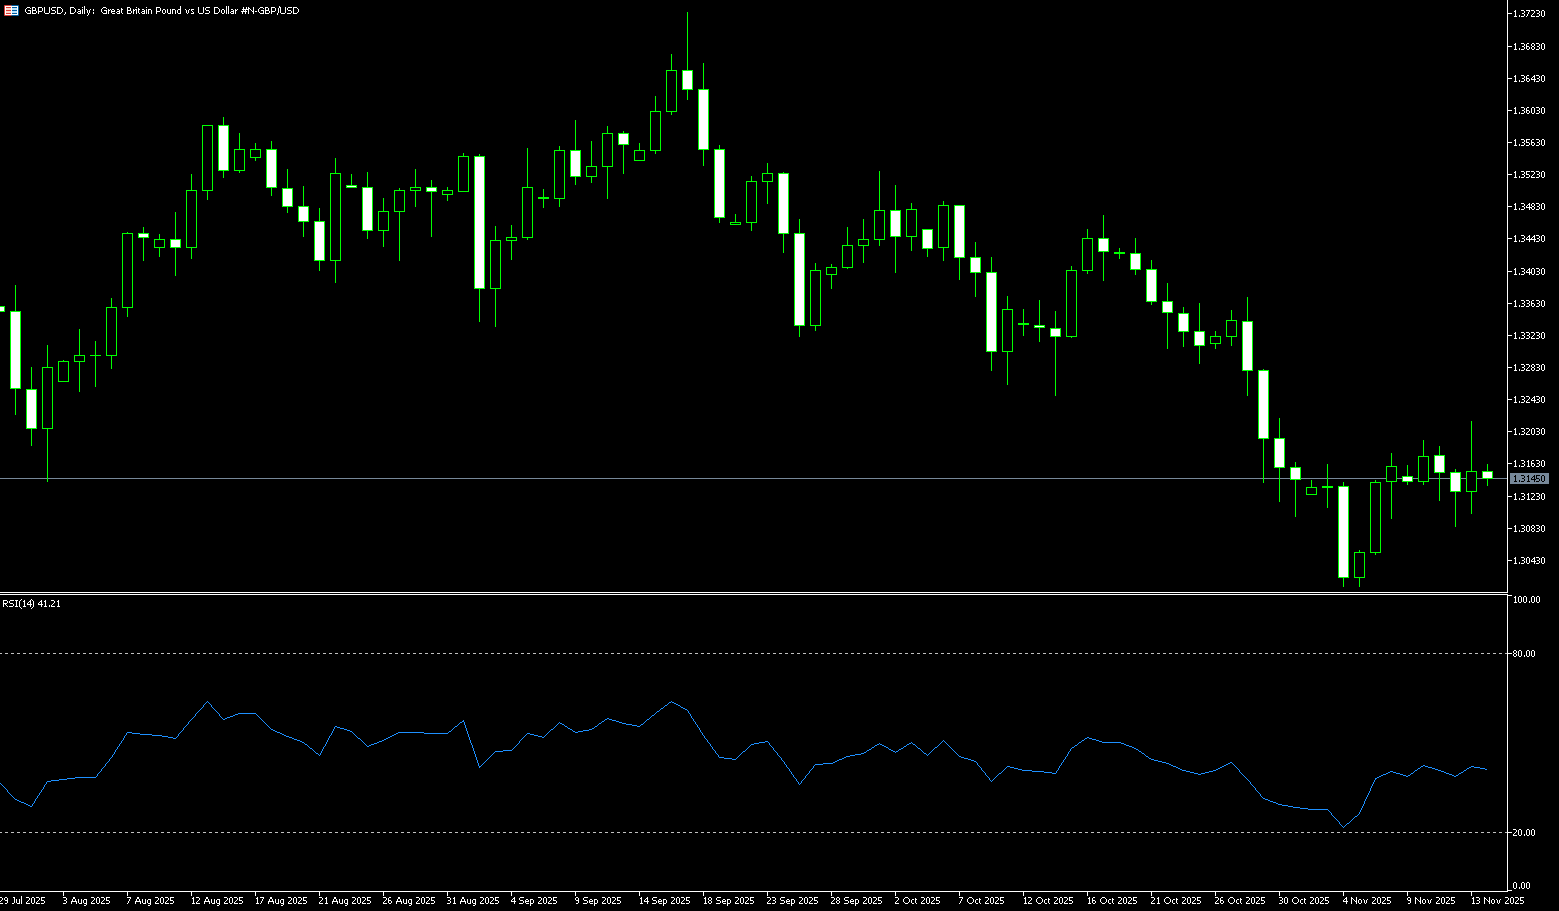
GBP/USD remained weak for the third consecutive trading day in Asian trading on Tuesday, trading around 1.3150. The pound struggled as Chancellor Rachel Reeves abandoned a planned income tax increase. Although the Office for Budget Responsibility lowered its budget deficit forecast from £35 billion to £20 billion, this decision raised questions about the UK's fiscal outlook. Reeves still expects to pursue revenue through threshold changes and wage sacrifice reforms, favoring a small budget rather than a large tax increase. Furthermore, the pound continued to face downward pressure after weak economic data, increasing market bets on a December rate cut by the Bank of England. The US dollar was little volatile as traders prepared for a series of US data releases following the government's reopening. The dollar received support as market bets on a December rate cut by the Federal Reserve decreased.
The recent break below the technically important 200-day simple moving average at 1.3290 is considered a key trigger for bears in GBP/USD. Furthermore, the daily Relative Strength Index (RSI) has moved out of oversold territory, which, along with the negative oscillator on the daily chart, suggests that the rebound from the psychological level of 1.3000 may continue. Therefore, upside targets could initially be seen at 1.3200 (a psychological level) and 1.3215 (last week's high), with a break above that targeting 1.3290 (the 200-day simple moving average). On the other hand, the 1.3100 (psychological level) - 1.3085 (November 12 low) area could provide immediate support; a break below this area could see GBP/USD retest the 1.3000 level, or even the low of 1.3010 reached last week, the lowest level since April.
Today, consider going long on GBP around 1.3132; Stop loss: 1.3120; Target: 1.3180; 1.3190
USD/JPY
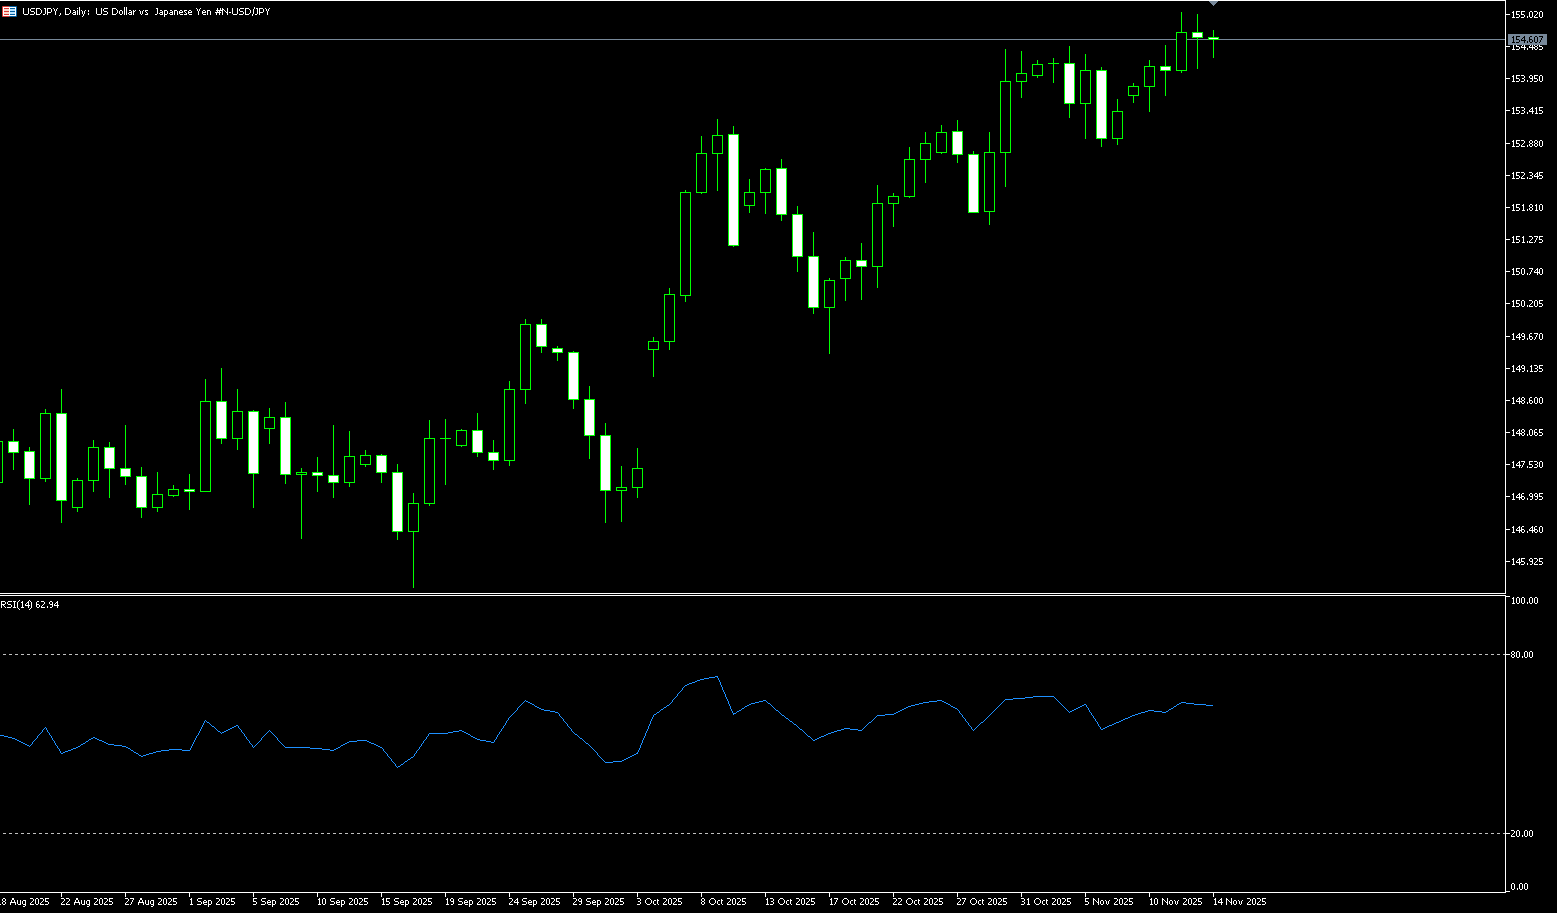
The yen traded near 155.50 against the dollar, its lowest level in ten months, ahead of a crucial meeting between Prime Minister Sanae Takaichi and Bank of Japan Governor Kazuo Ueda. Traders will be closely watching the talks for clues about the BOJ's next move and how policymakers will address yen pressures, amid rumors that Takaichi may advocate a cautious approach to interest rate hikes while planning a fiscal package that exceeds expectations. This meeting comes after data showed the Japanese economy contracted at an annualized rate of 1.8% this summer, the first decline in six quarters, impacted by building regulations and US tariffs. Some economists believe the headlines exaggerated the slowdown, but the report could strengthen Takaichi's resolve to pursue bold stimulus measures. Finance Minister Katayama also expressed concern about the yen's sharp one-sided movements, mentioning concerns about the broader economic impact of a weaker currency.
From the daily chart, USD/JPY is entering a narrowing range after hitting a year-to-date high of 155.73 at the beginning of the week, having risen approximately 6.0% since early April. This is often referred to as a reversing wedge pattern, indicating waning bullish momentum and often foreshadowing a significant pullback. Upward attempts are likely to encounter resistance at the mentioned 155.00 area and the top of the wedge (currently at 155.40). Higher targets are the 127.2% Fibonacci retracement level of the November 6-12 rally, at 155.65, and the 157.00 (psychological level) area. Support lies at the trendline support, currently around the 154.00 area, and the December 11-14 low of 153.65. A clear break below these levels would confirm a trend reversal and bring the November 6 low (152.85) into focus.
Consider shorting the US dollar around 155.70 today; Stop loss: 155.90; Target: 154.50; 154.70
EUR/USD
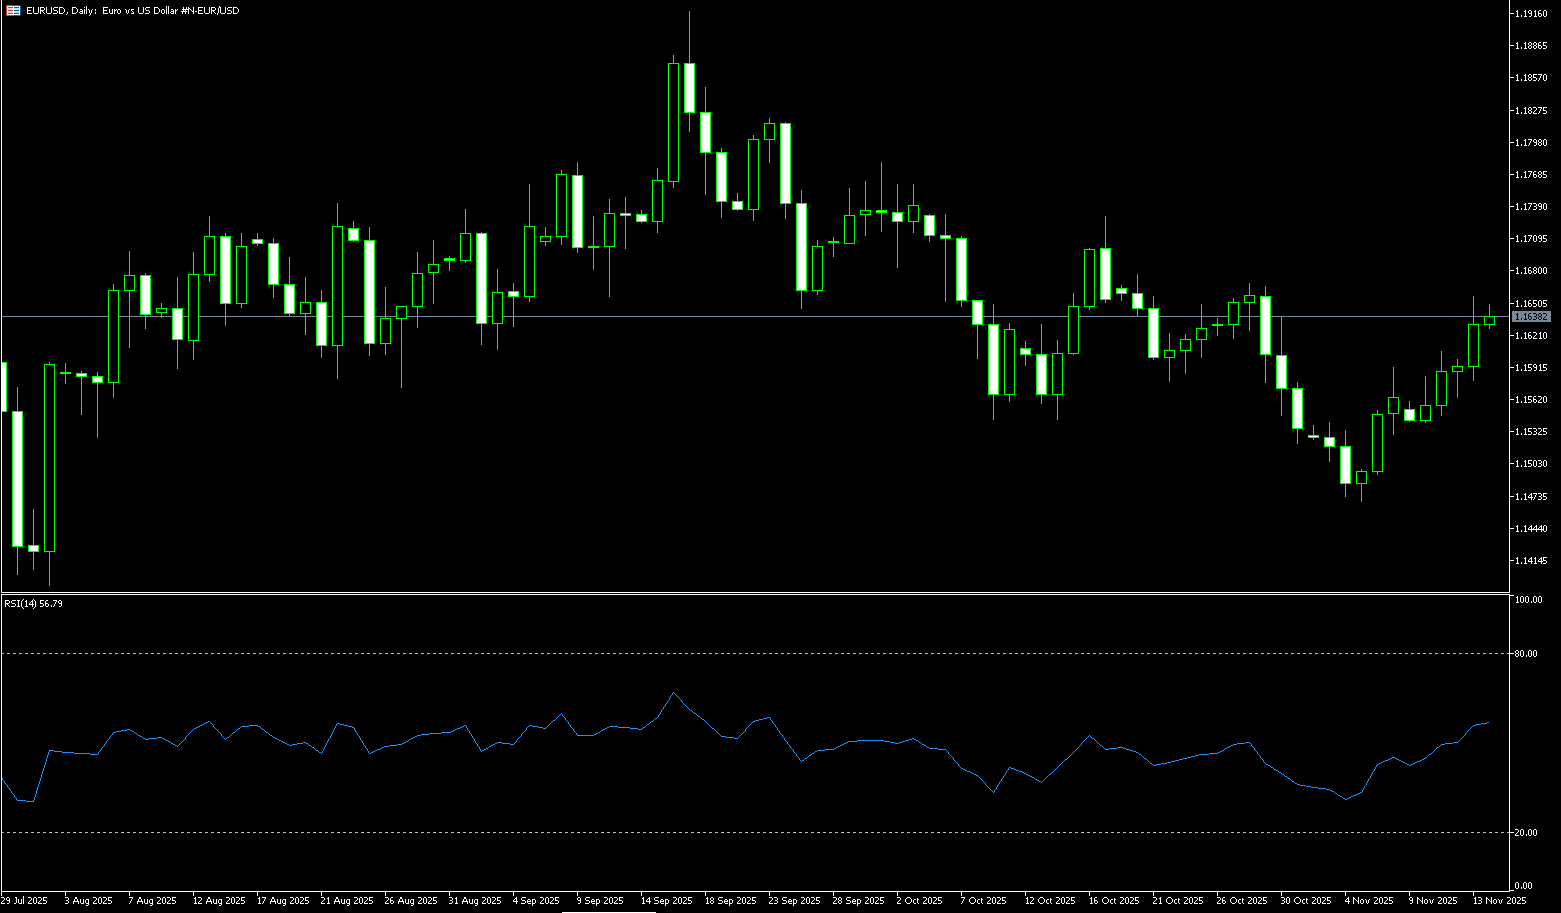
The euro remained slightly below $1.1600 in a quiet start to the week, as investors awaited speeches from the European Central Bank and key US economic data, delayed due to the government shutdown, including the September jobs report, to guide Federal Reserve policy. Earlier in the week, ECB Vice President Louis de Guindos stated that eurozone inflation would converge towards the central bank's target but warned of risks related to tariffs, sovereign debt, and sudden shifts in market sentiment. Meanwhile, the European Commission raised its 2025 eurozone growth forecast to 1.3% from 0.9% in the spring outlook, citing a surge in exports to the US and companies stockpiling ahead of Trump-era tariffs. Growth is expected to slow to 1.2% in 2026, below 1.4%, before rising to 1.4% in 2027.
This week, EUR/USD continued its bearish trend, with sellers briefly taking control and pushing the exchange rate towards the 150-day simple moving average at 1.1584 and the 1.1581 (early weekly low) area. It is currently trading slightly below 1.1600. The 14-day Relative Strength Index (RSI) on the daily chart has shown a U-shaped reversal and a slight decline, suggesting increased bearish pressure. A clear break above the 1.1581-1.1584 area would open the door to the 1.1553 (160-day simple moving average) level and further towards the 1.1500 level. On the upside, for buyers to regain control, EUR/USD must reclaim 1.1600. If successful, the next target is the 50-day simple moving average at 1.1654, and further strength would place the next resistance at 1.1700.
Consider going long on the Euro today around 1.1570; Stop loss: 1.1560; Target: 1.1640; 1.1630
Disclaimer: The information contained herein (1) is proprietary to BCR and/or its content providers; (2) may not be copied or distributed; (3) is not warranted to be accurate, complete or timely; and, (4) does not constitute advice or a recommendation by BCR or its content providers in respect of the investment in financial instruments. Neither BCR or its content providers are responsible for any damages or losses arising from any use of this information. Past performance is no guarantee of future results.
More Coverage


Risk Disclosure:Derivatives are traded over-the-counter on margin, which means they carry a high level of risk and there is a possibility you could lose all of your investment. These products are not suitable for all investors. Please ensure you fully understand the risks and carefully consider your financial situation and trading experience before trading. Seek independent financial advice if necessary before opening an account with BCR.
BCR Co Pty Ltd (Company No. 1975046) is a company incorporated under the laws of the British Virgin Islands, with its registered office at Trident Chambers, Wickham’s Cay 1, Road Town, Tortola, British Virgin Islands, and is licensed and regulated by the British Virgin Islands Financial Services Commission under License No. SIBA/L/19/1122.
Open Bridge Limited (Company No. 16701394) is a company incorporated under the Companies Act 2006 and registered in England and Wales, with its registered address at Kemp House, 160 City Road, London, City Road, London, England, EC1V 2NX. This entity acts solely as a payment processor and does not provide any trading or investment services.

 English
 简体中文
简体中文
 繁體中文
繁體中文
 Bahasa
Melayu
Bahasa
Melayu
 Tiếng
Việt
Tiếng
Việt
 ไทย
ไทย
 日本語
日本語
 한국어
한국어
 ភាសាខ្មែរ
 español