


0
US Dollar Index
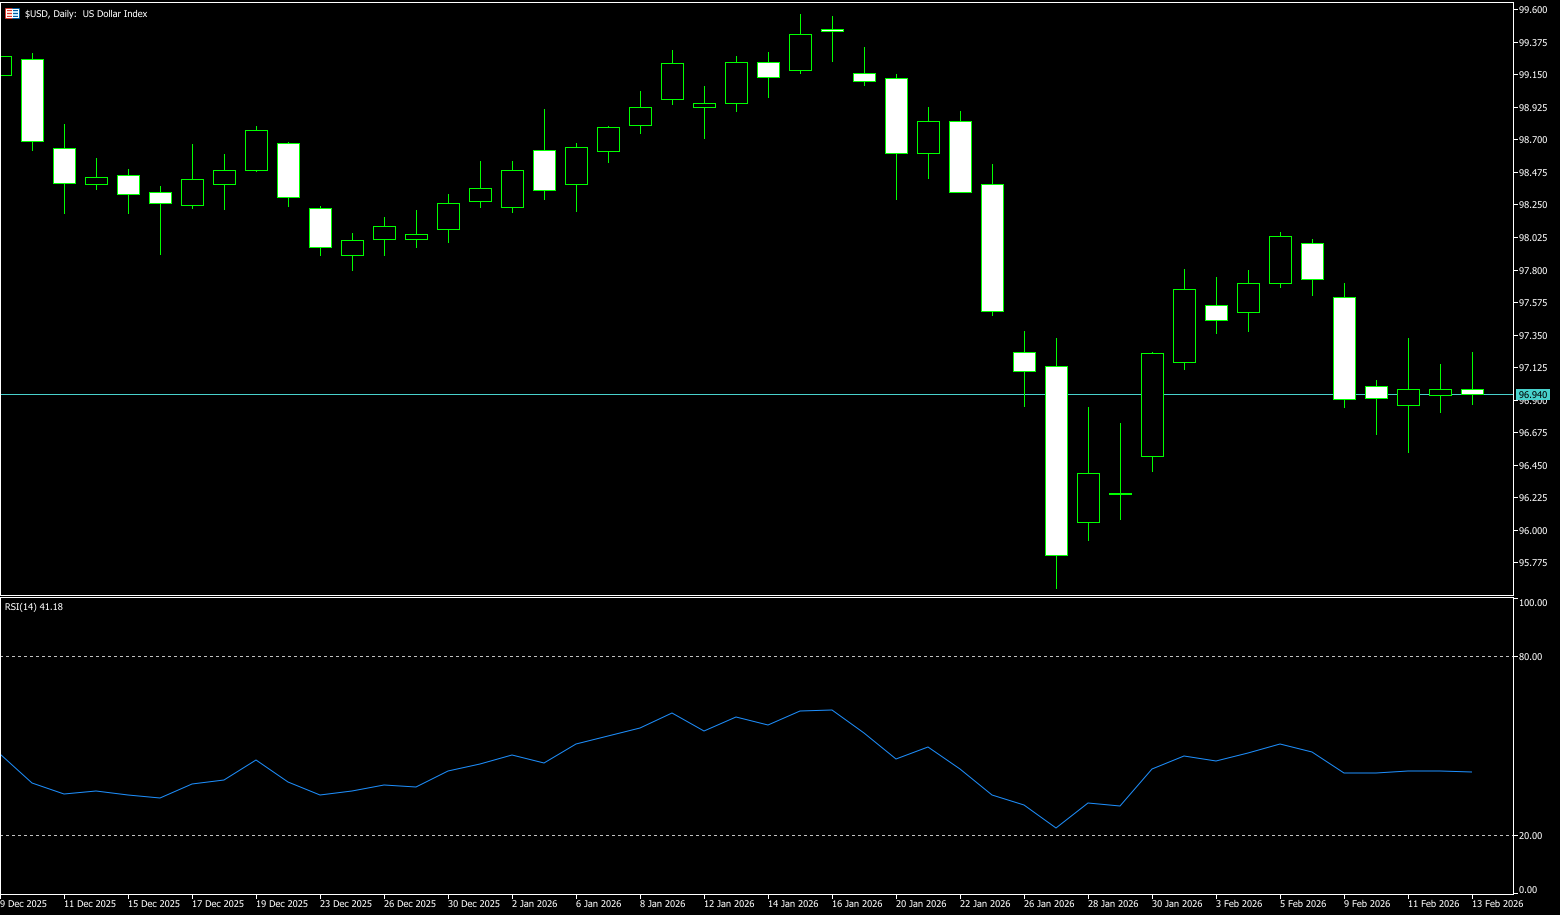
The US dollar index remained stable in a narrow range between 96.50 and 97.30 on Friday, marking its fourth consecutive day of sideways consolidation. Earlier this week, strong US non-farm payroll data highlighted the resilience of the labor market, despite the latest weekly jobless claims being higher than expected. The market currently expects the Federal Reserve to keep interest rates unchanged in March and anticipates two 25-basis-point rate cuts later this year, one in June and the other in September. Throughout the week, the dollar is expected to fall by more than 2% against the yen, related to the decisive election victory of Mayor Takashi and Tokyo's latest verbal intervention. The Australian dollar also recorded a strong rise on hawkish signals from the Reserve Bank of Australia. From a correlation perspective, the dollar index and US Treasury yields fell in tandem from mid to late January, indicating that the dollar did not effectively function as a safe haven during the period of heightened risk aversion; while since February, the dollar index has rebounded weakly, and US Treasury yields have remained low, showing a low-level resonance between the two. A well-known institution believes that the market is repricing its expectations for a shift in the Federal Reserve's monetary policy, a macroeconomic logic that is putting downward pressure on the US dollar and limiting the upside potential of US Treasury yields.
The daily chart of the US dollar index shows that after hitting a low of 95.56 on January 27, the market rebounded to around 98.03, but then fell back to around 97.00 in early February, exhibiting a pattern of "decreasing rebound height and continued downward pressure." The current price of 96.95 coincides perfectly with the short-term moving average, but is significantly lower than the 20-day moving average of 97.36, indicating that the bearish trend has not fundamentally reversed. The RSI (14) is hovering in the 40-45 range, approaching oversold territory but without triggering a clear rebound signal, indicating a weak equilibrium. The MACD bearish momentum still dominates. It has formed a golden cross in negative territory, which contrasts somewhat with the bullish divergence signal in the MACD of US Treasury yields. This technical divergence reflects that the pricing logic of dollar assets already incorporates some easing expectations into the exchange rate, representing a consolidation at lower levels after a breakout from higher levels. The technical outlook is bearish, with weak rebounds and lingering downside risks. Therefore, short-term support lies at 96.50-96.60 (the weekly low + densely traded area), followed by the psychological level of 96.00, and ultimately targeting 95.56 (the low of January 27th). On the upside, attention can be paid to the 20-day moving average at 97.36; a break below this level would lead to a further rebound to 97.76 (last week's high) and the psychological level of 98.00.
Today, consider shorting the US dollar index near 96.98; stop loss: 97.10; target: 96.45; 96.55
WTI Crude Oil
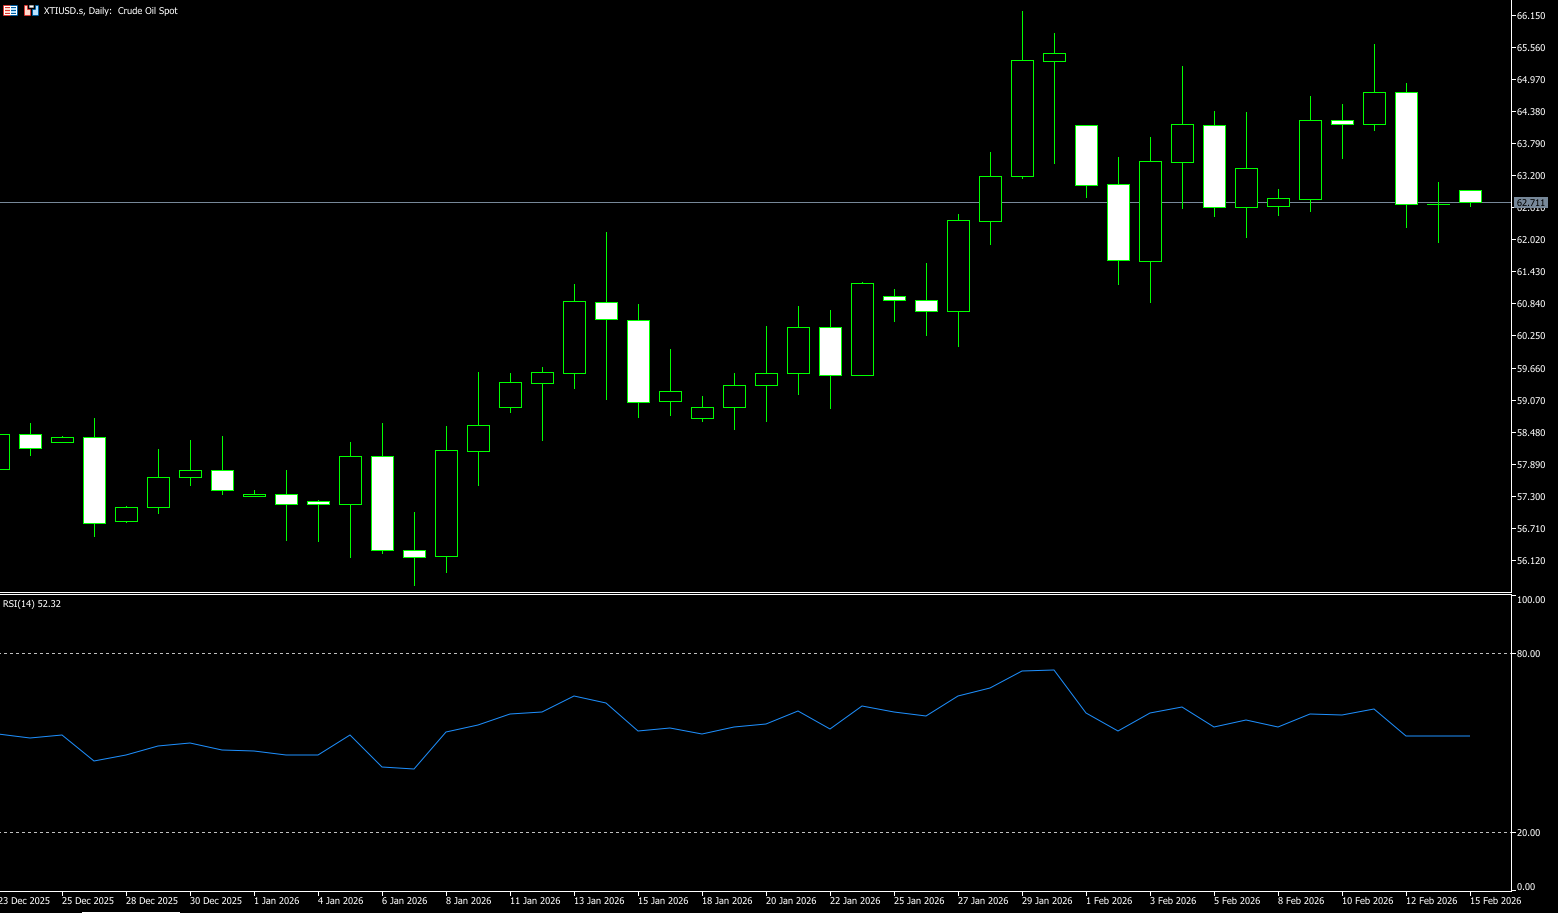
Last week, WTI crude oil technically exhibited a "rise and fall" pattern, closing lower for the second consecutive week. The International Energy Agency's (IEA) latest monthly report shows that the global oil market is rapidly shifting towards a supply glut. Inventories are projected to increase by 477 million barrels by 2025, the fastest pace since 2020, and OECD inventories are expected to exceed the five-year average for the first time in four years. Meanwhile, the agency predicts that the daily supply surplus in 2026 may exceed 3.7 million barrels. While geopolitical risks provide temporary support for oil prices, inventory realities are gradually becoming the dominant variable. Despite weakening fundamentals, oil prices have remained resilient driven by geopolitical risks. The IEA points out that relatively tight inventories in pricing centers provide short-term price support. On the geopolitical front, US President Trump stated that negotiations with Iran could last a month, and that failure to reach an agreement would have serious consequences. Market concerns about Middle East supply stability have led to a temporary rise in risk premiums. More confrontational rhetoric could push up risk premiums, but if the situation does not escalate to an urgent conflict, the upside potential for oil prices may be limited. Overall, inventory realities and risk premiums are creating a tug-of-war, leading to increased price volatility. The core issue in current oil prices has shifted from "supply disruption expectations" to "the reality of rapid inventory accumulation." Risk premiums can provide short-term support, but they are unlikely to counteract persistent oversupply in the long term. From a cyclical perspective, when inventories enter a rapid increase phase, prices often eventually revert to supply and demand realities.
Last week, WTI crude oil technically exhibited a pattern of "rising and falling back, high-level consolidation." The medium-term bullish trend remains intact, but short-term momentum is weakening and resistance is concentrated, making range-bound consolidation highly probable. Market concerns about Middle East supply stability have led to a temporary rise in risk premiums. If the situation does not escalate to an urgent conflict, the upside potential for oil prices may be limited. Overall, inventory realities and risk premiums are creating a tug-of-war, intensifying price volatility. Observing the daily chart, WTI crude oil has recently been trading below $63.66 (the 9-day moving average), indicating a weakening short-term trend. The previous upward consolidation structure has been broken, with prices falling below the lower edge of the previous upward channel, shifting the market rhythm from trending to range-bound trading. The MACD histogram is contracting, posing a risk of a death cross. This means that short-term downward pressure has not yet been fully released. In terms of momentum indicators, the RSI has fallen back to around 50-52, indicating a significant weakening of upward momentum. Overall, the WTI technical structure has shifted from slightly bullish to slightly bearish. If inventories continue to accumulate and geopolitical risks do not escalate significantly, the price center of gravity may gradually shift downwards. The first technical support level is currently around $62, which corresponds to the previous area of dense trading and a recent low. A break below this level could lead to a further test of the psychological level of $60. If $60 is effectively broken, the medium-term structure will turn bearish. Resistance is concentrated in the $64.50 to $65 range. This area is both a previous breakout platform and the convergence point of short-term moving averages. If the rebound fails to hold above $65, bullish momentum will be difficult to recover.
Today, consider going long on crude oil around 62.45; stop loss: 62.30, target: 64.00; 64.50
Spot Gold
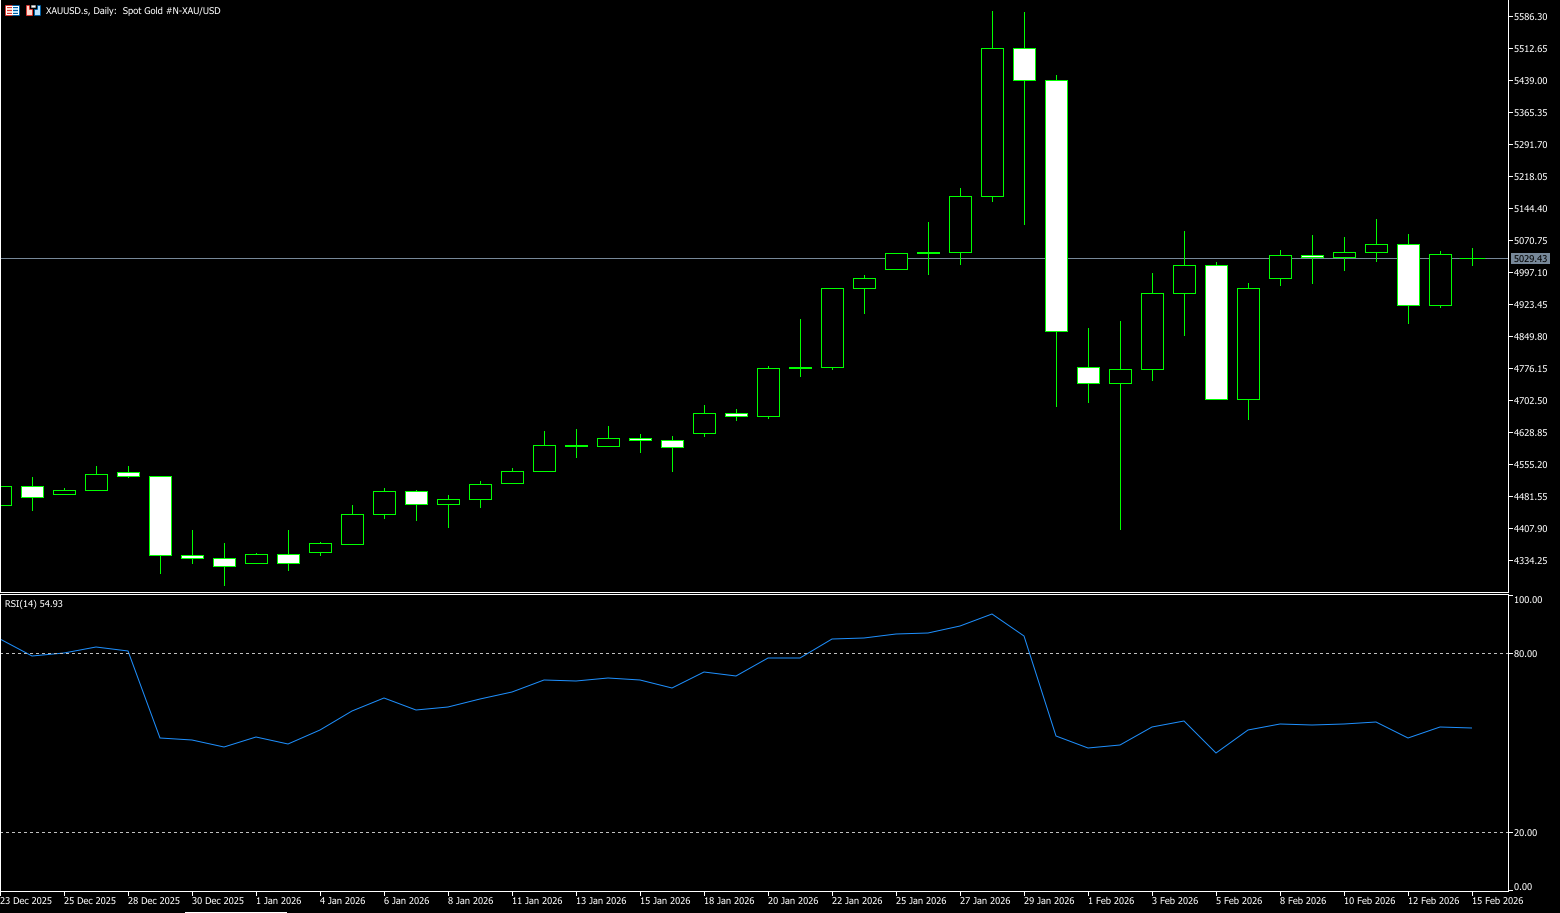
Just as bulls were dreaming of gold reaching $6,000, a sudden and perfect storm dragged gold down from its pedestal before the weekend. When non-farm payroll data shattered hopes for interest rate cuts, when AI panic triggered algorithmic sell-offs, and when stop-loss orders exploded below $5,000—the once impregnable fortress of gold fell below the psychological barrier of $5,000 overnight. Spot gold broke through the $5,000 mark with a massive bearish candle of over 3%, breaching the psychological barrier it had just established. During the session, it even plunged more than 4%, hitting a low of $4,878, the lowest level since February 6th. This was a systemic sell-off triggered by a multi-faceted resonance of fundamentals, technicals, and sentiment. Gold's non-interest-bearing nature became its fatal flaw at this moment. When the non-farm payroll report indicated confidence in maintaining high interest rates for an extended period, the opportunity cost of holding gold remained high, and might even rise further. Speculative funds' first reaction was to flee. If it were merely a negative non-farm payroll report, gold might only experience a mild correction. However, the fragile technical structure amplified the decline several times over. Many investors placed stop-loss orders below $5,000. This means that when gold prices broke through this psychological level, it wasn't natural buying pressure that absorbed the selling pressure, but rather a collective triggering of numerous stop-loss orders. The $5,000 level is so fatal precisely because too many people believed it was a rock-solid bottom, placing a dense concentration of stop-loss orders below it. The market is merciless; it preys on consensus expectations.
From a technical perspective, since the lows of early February, gold prices have rebounded by more than 10%. However, as prices have continued to rise, market volatility has shown a clear downward trend. This divergence indicates that the bullish momentum driving gold prices is gradually exhausting, and the enthusiasm of bullish participants in the market has cooled. However, it's important to clarify that for gold prices to experience a deep correction, a crucial condition must be met: a decisive break below the lows formed in early February is necessary, followed by a continuation of the downward trend that began from historical highs. If this occurs, the current market rebound is likely a classic "dead cat bounce"—a short-term false rally—and the price will likely revert to its downward trend, continuing the previous correction pattern. Currently, close attention should be paid to the key resistance areas of 5,139 (the 61.8% Fibonacci retracement level of the price movement from 5,598 to 4,402) and 5,100 (the high point of the rebound after the sharp drop to 4,402). If gold prices can effectively break through these areas, accompanied by a significant increase in trading volume, then a further move towards 5,314.70 (the 76.4% Fibonacci retracement level) is possible, continuing the rebound; however, given the current market situation, this possibility is relatively low. A deeper correction in gold prices is likely in the future. More importantly, during this rebound, gold futures trading volume has consistently declined, creating a "volume-price divergence." This signal typically indicates that the current rebound lacks sufficient capital support, and the probability of a subsequent correction is increasing. Therefore, downside targets to watch are 4,855.70 (38.2% Fibonacci retracement level) and 4,853.20 (28-day moving average), followed by 4,680.30 (23.6% Fibonacci retracement level) and 4,674.20 (45-day moving average).
Today, consider going long on gold around 5.025; stop loss: 5,018; target: 5,080; 5,090
AUD/USD
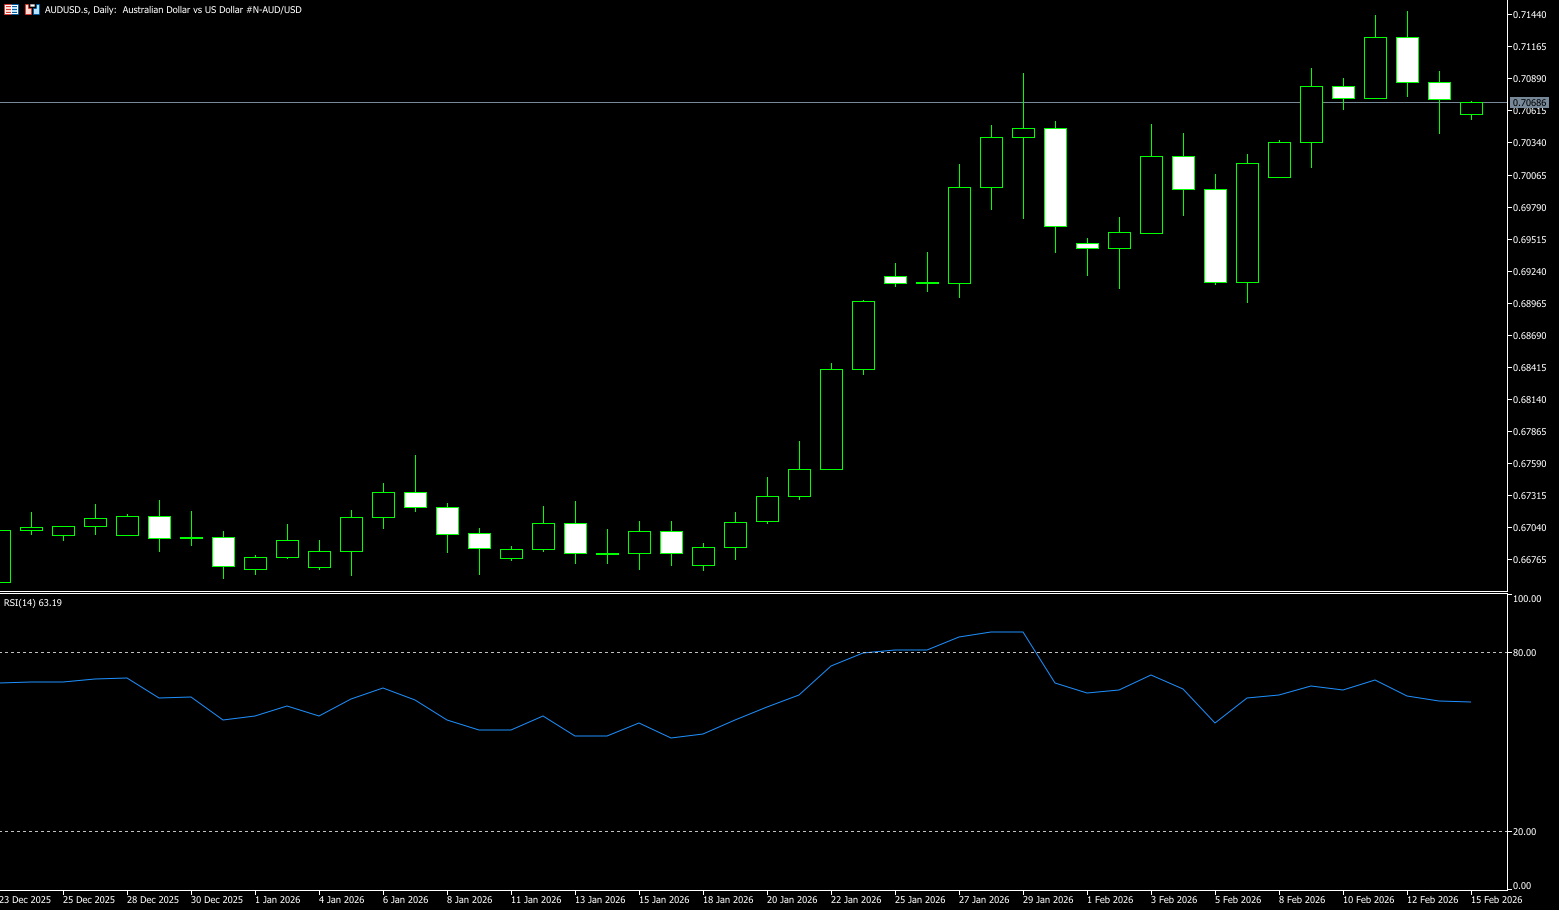
The Australian dollar hovered above the 0.7100 USD level twice last week, near a three-year high, after the Reserve Bank of Australia signaled a hawkish policy outlook. Reserve Bank of Australia (RBA) Governor Michelle Bullock stated that the board is prepared to raise interest rates further if inflation persists, and considers any "three-out-of-the-box" inflation unacceptable. Her comments reinforced warnings from Deputy Governor Hauser, who noted the previous day that inflation remained too high and continued to pose a significant challenge to the board in setting interest rates. Shortly after Bullock's speech, a consumer survey was released showing inflation expectations jumped to 5% in February, the highest level since mid-2025, further reinforcing the hawkish tone. Speaking in Perth, Assistant Governor Hunt added that she expects the labor market to remain tight and inflation to remain above target for some time. Economists now widely expect the RBA to raise rates in May, as it weighs first-quarter inflation data against upcoming employment and GDP reports.
From a technical perspective, the Australian dollar against the US dollar last week exhibited a pattern of "rising and falling back, high-level consolidation." While the daily bullish trend remains intact, it has entered a zone of concentrated resistance in the short term, indicating slowing upward momentum and an increased risk of a pullback. At the beginning of the week, the price rose supported by the psychological level of 0.70. In the middle of the week, it broke through the 0.7100 level. Before the weekend, it fell back due to the sharp drop in US stocks and the rise in risk aversion. The weekly line closed with a small positive line but with a clear upper shadow. The 5/10/20-day moving averages are in a bullish alignment. The exchange rate is running based on the 14-day moving average (about 0.7030). The short-term moving averages have turned flat, indicating that the upward momentum is weakening. The RSI (14) is in the 65-67 range, which is in the strong range but close to the overbought (70) range. The bullish momentum is weakening and the cost-effectiveness of chasing the rise is decreasing. In addition, the MACD is above the zero axis, the red bars are slightly shrinking, and the fast and slow lines are flat, indicating that the upward momentum is slowing down and the short-term pullback signal is clear. Therefore, the psychological level of 0.7100 and the three-year high of 0.7147 limit the recent upward space. After breaking through 0.7147, it is expected to challenge the medium-term target of 0.7200. Failure to return to that level will limit the rebound and maintain a seller-dominated environment. The first targets are at 0.7030 (14-day moving average) and the 0.7000 (psychological level). If the support area mentioned above is breached by the bears, the next targets are at 0.6964 (20-day moving average) and the 0.6900 (psychological level).
Consider going long on the Australian dollar today around 0.7060; Stop loss: 0.7050; Targets: 0.7110; 0.7120
GBP/USD
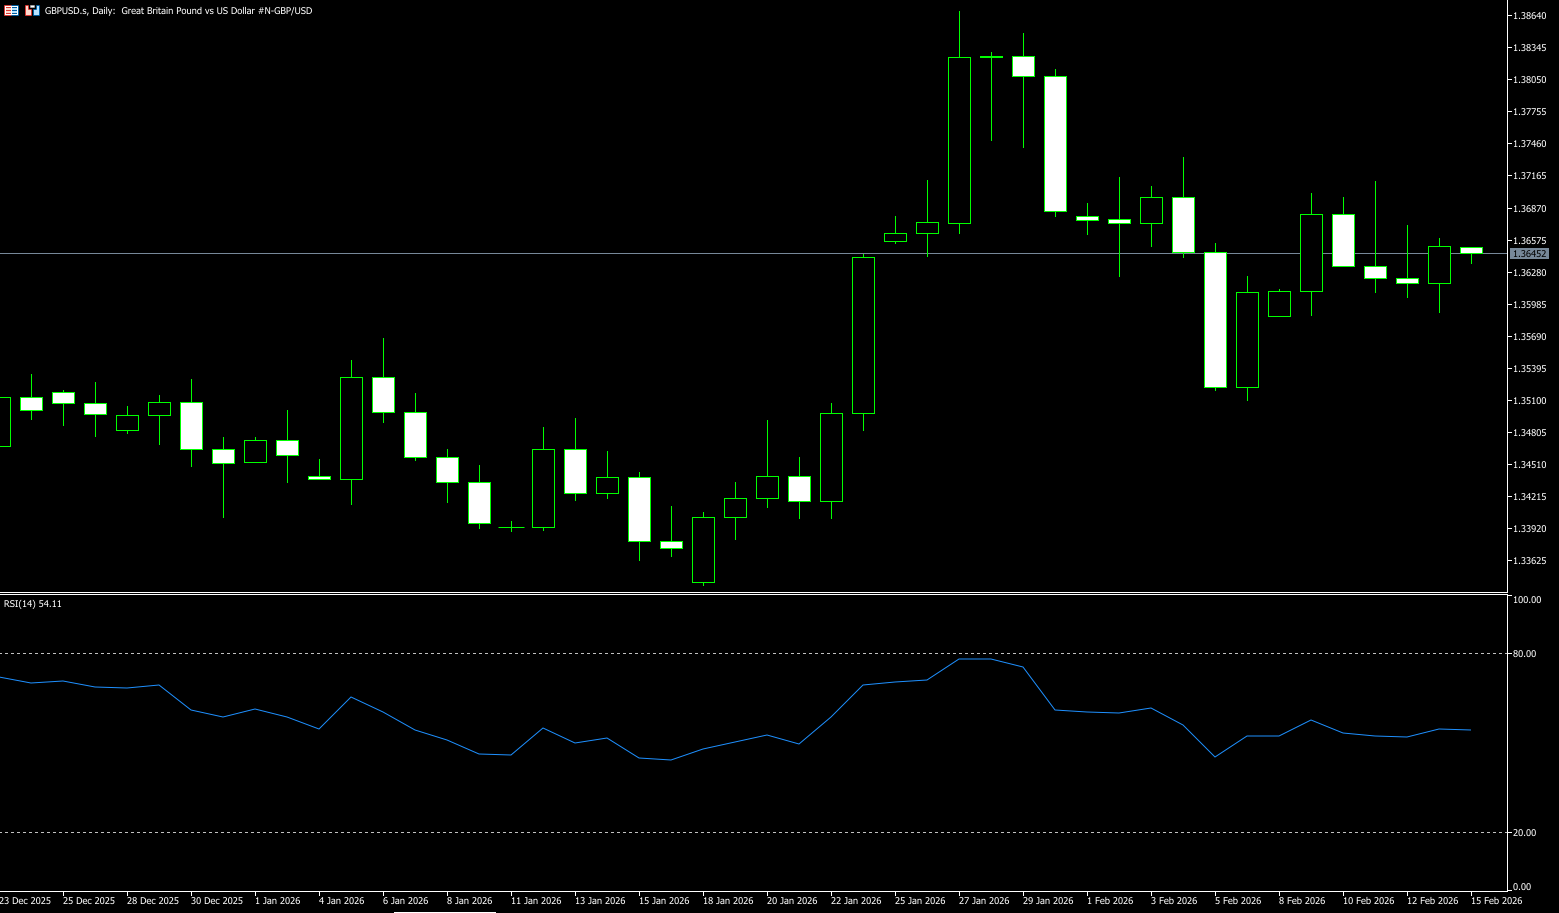
Last week, GBP/USD traded in a narrow range between 1.3712 and 1.3590 as investors assessed weaker-than-expected UK economic growth data. Data from the Office for National Statistics showed that the economy grew by 0.1% in the fourth quarter of 2025, unchanged from the previous quarter but below the expected 0.2%. On an annualized basis, GDP grew by 1.0%, below expectations and the slowest expansion since the second quarter of 2024. Monthly data also showed unexpected contractions in industrial output and construction, highlighting the fragility of the recovery. These disappointing figures have made it a challenging year for the UK economy and increased political pressure on Prime Minister Keir Starmer. Meanwhile, investors continue to expect further monetary easing from the Bank of England. Although policymakers decided to keep interest rates unchanged at 3.75% in a divided decision, they adopted a more dovish tone, suggesting that inflation could return to 2% from April. Furthermore, if the UK economy remains in a "low but not faltering" state, and inflation remains sticky, the Bank of England will likely remain cautious and avoid initiating a significant rate-cutting cycle prematurely. This would limit the downside potential of the pound. Conversely, if manufacturing weakness spreads to the job market and impacts service consumption demand, expectations of rate cuts will quickly intensify, and the pound could face temporary pressure. In short, the fate of the pound is no longer determined by a single data point, but rather by the dynamic balance between growth, inflation, and employment.
The British pound traded in a wide range against the US dollar last week, consolidating with a slightly bullish bias. The core of the trading was a struggle within the 1.35-1.37 range, with bulls holding a slight advantage in the short term but momentum weakening. This week is likely to close with the pound consolidating around 1.36. Looking at the GBP/USD exchange rate, it is currently hovering around 1.3630-1.3650. After a rapid rebound from 1.3344 to a high of 1.3867 this year, it entered a consolidation phase, with market sentiment shifting from chasing gains to a wait-and-see approach. Technical indicators show that while the MACD fast and slow lines are still above the zero line, the momentum bars have turned negative (-0.0025), indicating weakening upward momentum. The RSI{14} is around 55.20, in the neutral zone, showing neither a strong upward signal nor oversold conditions, consistent with the characteristics of a range-bound market. From a price structure perspective, the 1.3712 (last week's high) and 1.3700 (psychological level) form a strong resistance zone. A break above these levels would target 1.3869 (this year's high), but without significant fundamental catalysts in the short term, a breakout is unlikely. On the downside, the 1.3568 (30-day moving average) level, a previous low, provides crucial support. A breach of this level could trigger technical stop-loss orders, pushing the price lower to the 1.3500 psychological level. If this level holds, the exchange rate will likely fluctuate between 1.3500 and 1.3867.
Today, consider going long on GBP around 1.3643; stop-loss: 1.3630, target: 1.3690; 1.3700
USD/JPY
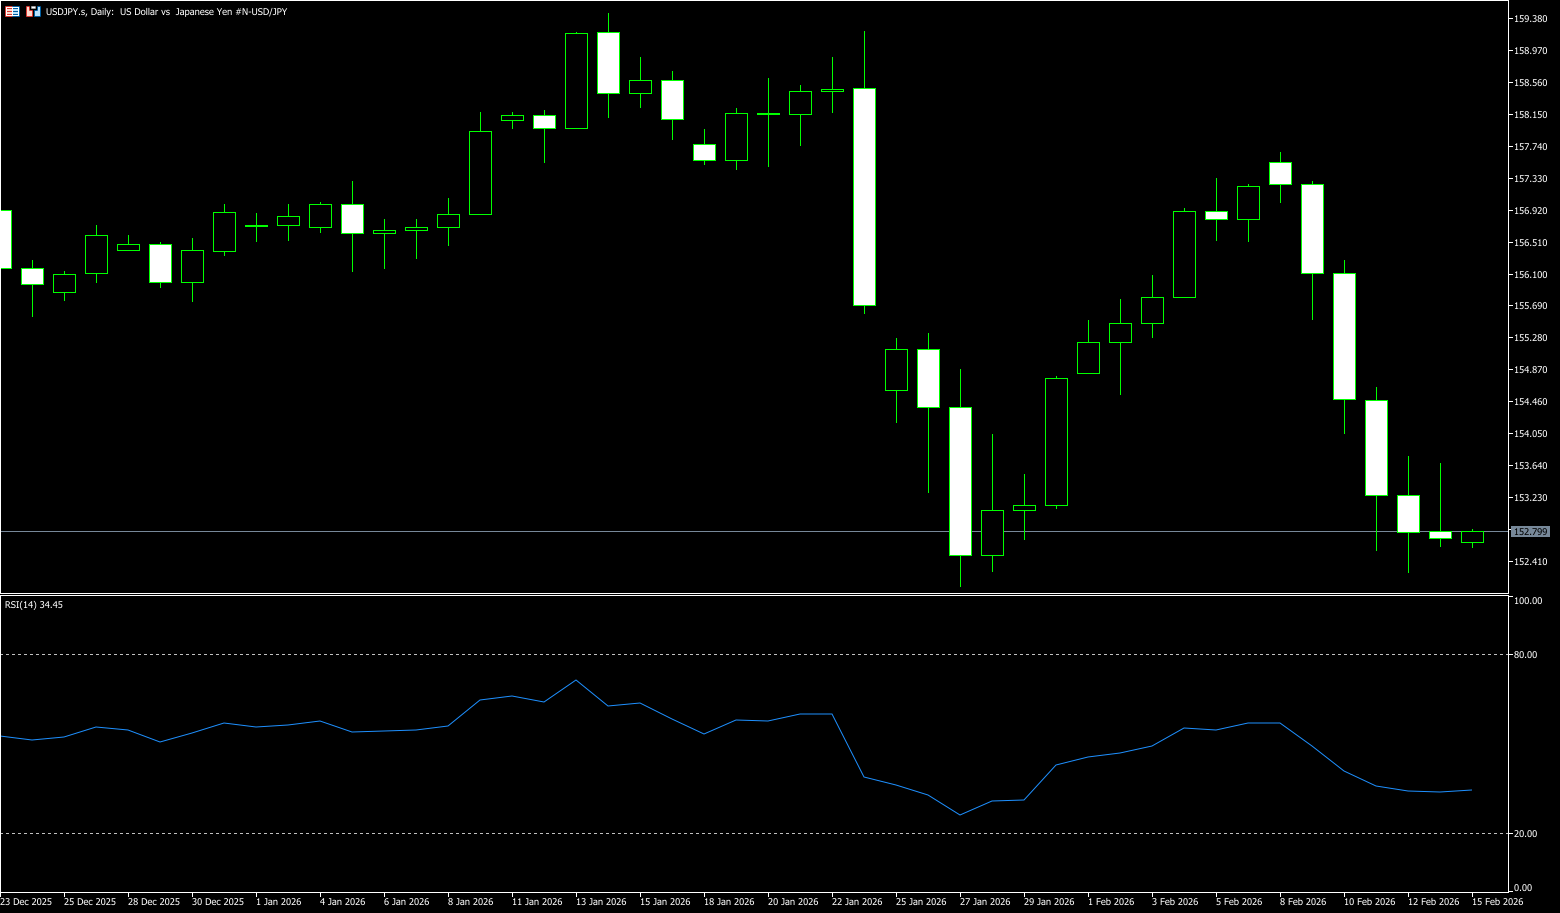
The USD/JPY pair rebounded slightly last week after ending a four-day losing streak. However, expectations of a more responsible fiscal strategy from Prime Minister Sanae Takaichi, coupled with market bets that the Bank of Japan will stick to its policy normalization path and risk aversion, may support the safe-haven yen and limit the pair's upside. USD/JPY rose above 153 before the weekend but is still on track for its biggest weekly gain since November 2024, supported by expectations that Prime Minister Takaichi's fiscal expansion plans will boost growth without increasing the burden on public finances. Takaichi's decisive victory in the election reduced political uncertainty and provided a clear mandate for increased spending and targeted tax cuts. Addressing market concerns about a proposed two-year food sales tax cut, the Prime Minister emphasized that the measure would not be financed through additional bond issuance. Instead, her government plans to implement the measures in a "sustainable" manner through subsidies, special tax measures, and non-tax revenue. The yen was also supported by verbal intervention, with Chief Currency Diplomat Atsushi Mimura noting that despite the recent currency rebound, relevant departments remain highly vigilant about exchange rate volatility.
The core driver of the USD/JPY exchange rate has shifted from single data points to policy path dynamics. If Japan continues its policy normalization while the US enters an easing cycle around 2026, the interest rate advantage will gradually narrow, putting structural pressure on the USD/JPY. From a daily chart perspective, the USD/JPY previously retreated from its highs, breaking below the short-term upward trendline support and forming a temporary low near 152.27 (last week's low). The current rebound is a technical correction, not a trend reversal. Momentum indicators show the RSI below 40, indicating bearish dominance; the MACD histogram remains in negative territory, reflecting that the medium-term downtrend has not yet ended. While there is room for a short-term technical rebound, the overall structure leans towards a downward trend. Key support lies at the psychological level of 152.00; a break below this level could lead to a further test of 151.45 (the lower Bollinger Band on the daily chart). If bearish momentum continues, a pullback towards the psychological level of 150 cannot be ruled out. The first resistance levels are around 153.93 (5-day moving average) and 154.00 (psychological level), followed by the 154.69 (14-day moving average) area. Only a firm hold above 155 could reverse the current weak trend. In the short term, inflation data will determine the dollar's direction; in the medium term, policy divergence will be the trend variable. With interest rate expectations gradually reversing, the exchange rate faces further downside risk.
Today, consider shorting the dollar around 153.00; stop loss: 153.20; target: 152.00; 152.10
EUR/USD
Last week, after reaching a high of 1.1928 at the beginning of the week, EUR/USD fell for the fourth consecutive day to around 1.1870. Investor concerns about the negative impact of artificial intelligence on the labor market triggered another decline on Wall Street after Microsoft AI CEO Mustafa Suleiman stated in the Financial Times that all white-collar jobs would be replaced within the next 12 to 18 months. Risk aversion continued in Asian trading, providing some support for the safe-haven dollar and offsetting weak macroeconomic data on Thursday. However, market movement remained subdued ahead of the Eurozone's preliminary GDP figures, which will reveal the region's economic performance for the final quarter of 2025. The Eurozone economy is expected to grow at a steady pace of 0.3% in the quarter, slowing its annualized growth to 1.3%, down from 1.4% in the third quarter. On the other hand, the US has peaked, with global investors over-investing in US assets. The dollar may weaken further, which would support the euro and provide more upside potential for EUR/USD in the future. Even after the significant weakening of the dollar over the past year, it is still not historically weak. Foreign investors have not completely withdrawn so far. In other words, there may be more adjustments to come.
The euro/dollar pair traded in a range-bound manner last week, fluctuating at high levels before declining. The technical outlook is neutral to slightly weak, with the core range being 1.1759 (50-day moving average) – 1.1928 (last week's high). Initially, the pair surged to a high of 1.1928 due to a weaker dollar and dovish expectations from the ECB. Mid-week, the dollar rebounded due to strong non-farm payroll data and easing expectations of a rate cut. Before the weekend, the euro/dollar pair approached the key support level of 1.1850. Therefore, the weekly chart is likely to close with a small bearish candle, indicating weakening bullish momentum. Technical indicators are bearish but have not broken down. On the daily chart, the RSI (14) has fallen from above 60 to around 56, indicating weakening bullish momentum but not oversold conditions. The MACD histogram is shortening and approaching a death cross, suggesting bears are in control. Currently, the euro/dollar pair is expected to remain within the 1.1759 – 1.1928 range, awaiting further guidance from next week's ECB meeting and Fed speech. The euro is currently testing the key levels of 1.1837 (20-day moving average) and 1.1800 (psychological level), which are crucial for determining whether the market is bullish or bearish this week. A break below these levels would open up downside potential to the 1.1759 (50-day moving average). If the ECB releases hawkish signals or the dollar weakens, the euro could rebound and retest the 1.1900 (psychological level) and 1.1928 (last week's high) resistance zone. A break above these levels would target the 1.2000 (psychological level).
Today, consider going long on the euro around 1.1860; stop loss: 1.1850; targets: 1.1920, 1.1910.

Disclaimer: The information contained herein (1) is proprietary to BCR and/or its content providers; (2) may not be copied or distributed; (3) is not warranted to be accurate, complete or timely; and, (4) does not constitute advice or a recommendation by BCR or its content providers in respect of the investment in financial instruments. Neither BCR or its content providers are responsible for any damages or losses arising from any use of this information. Past performance is no guarantee of future results.
More Coverage


Risk Disclosure:Derivatives are traded over-the-counter on margin, which means they carry a high level of risk and there is a possibility you could lose all of your investment. These products are not suitable for all investors. Please ensure you fully understand the risks and carefully consider your financial situation and trading experience before trading. Seek independent financial advice if necessary before opening an account with BCR.
BCR Co Pty Ltd (Company No. 1975046) is a company incorporated under the laws of the British Virgin Islands, with its registered office at Trident Chambers, Wickham’s Cay 1, Road Town, Tortola, British Virgin Islands, and is licensed and regulated by the British Virgin Islands Financial Services Commission under License No. SIBA/L/19/1122.
Open Bridge Limited (Company No. 16701394) is a company incorporated under the Companies Act 2006 and registered in England and Wales, with its registered address at Kemp House, 160 City Road, London, City Road, London, England, EC1V 2NX. This entity acts solely as a payment processor and does not provide any trading or investment services.

 English
 简体中文
简体中文
 繁體中文
繁體中文
 Bahasa
Melayu
Bahasa
Melayu
 Tiếng
Việt
Tiếng
Việt
 ไทย
ไทย
 日本語
日本語
 한국어
한국어
 ភាសាខ្មែរ
 español
