


0
Currency & Commodity Analysis:
US Dollar Index
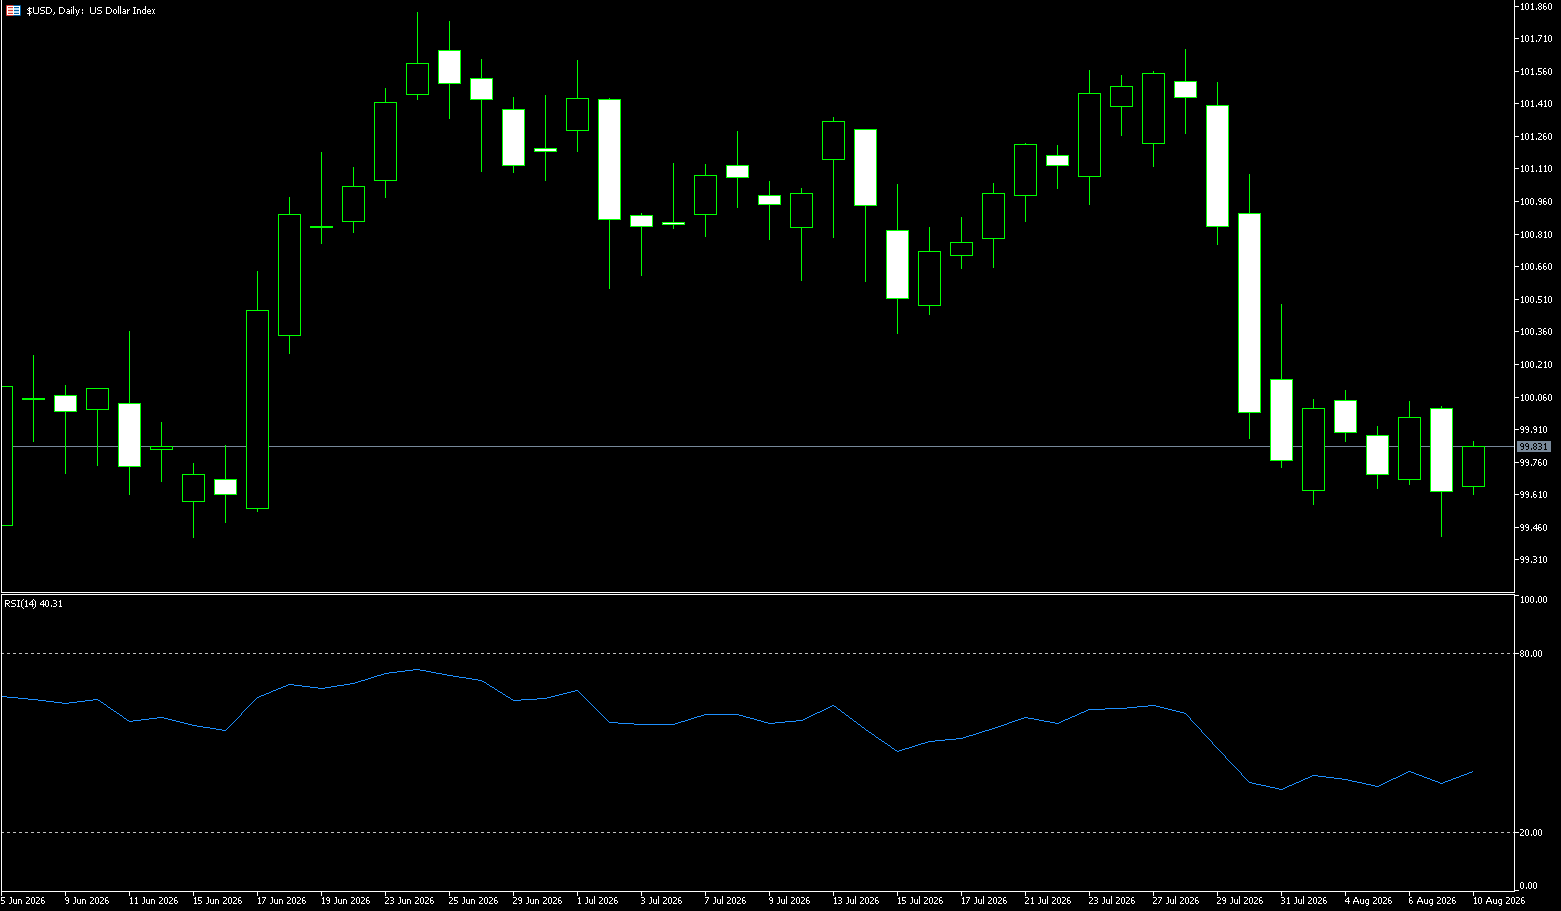
The US dollar index fell 0.36% on Friday, marking its second consecutive weekly decline. It touched a near two-month low of 99.39 during the session, impacted by unexpectedly weak US non-farm payroll data for July (a loss of 23,000 jobs, far below the expected increase of 80,000, and a significant downward revision of June's data; while the unemployment rate fell to 4.1%, the labor force participation rate dropped to a near five-and-a-half-year low), dampening expectations of a Federal Reserve rate hike. The first week of August saw a rare storm in the global foreign exchange market. The USD/JPY pair rebounded sharply last week from near a 40-year low of 163 to 157.55, supported by strong intervention from the US and Japan for the first time since 1998. However, this intervention, costing over $100 billion and hailed as "historic" by the market, faced a severe test within a week—the yen, after rising to 155.22 on Monday, gave back nearly half of its gains and entered a period of volatility this week; the dollar index, impacted by weak non-farm payroll data, fell for the second consecutive week, hitting a seven-week low of 7 points. Easing geopolitical tensions in the Middle East led to a general rise in non-US currencies, with the euro, Australian dollar, and Canadian dollar all reaching highs of over a month and a half.
Last week, the dollar weakened overall, briefly testing a six-week low of 99.41. This tension was primarily driven by ongoing geopolitical risks in the Middle East. That said, the dollar index briefly fell to the 99.41 area, the first time since mid-June, before recovering some ground in late North American trading. The final stages of deflation may become a significant source of support for the dollar in the coming months. The US dollar weakened overall last week, briefly testing a six-week low despite continued geopolitical tensions fueling safe-haven demand. These tensions, primarily driven by ongoing geopolitical risks in the Middle East, should continue to provide solid support for the dollar as long as underlying inflation remains stubborn and expectations of higher interest rates for an extended period persist. In the short term, support levels to watch are 99.41 (last week's low) and 99.00 (a psychological level). On the upside, consider the 100 (psychological level) and the 100.45 (July 31 high) area.
Today, consider shorting the US Dollar Index at 99.90, with a stop-loss at 100.00 and targets at 99.50 and 99.40.
WTI Crude Oil
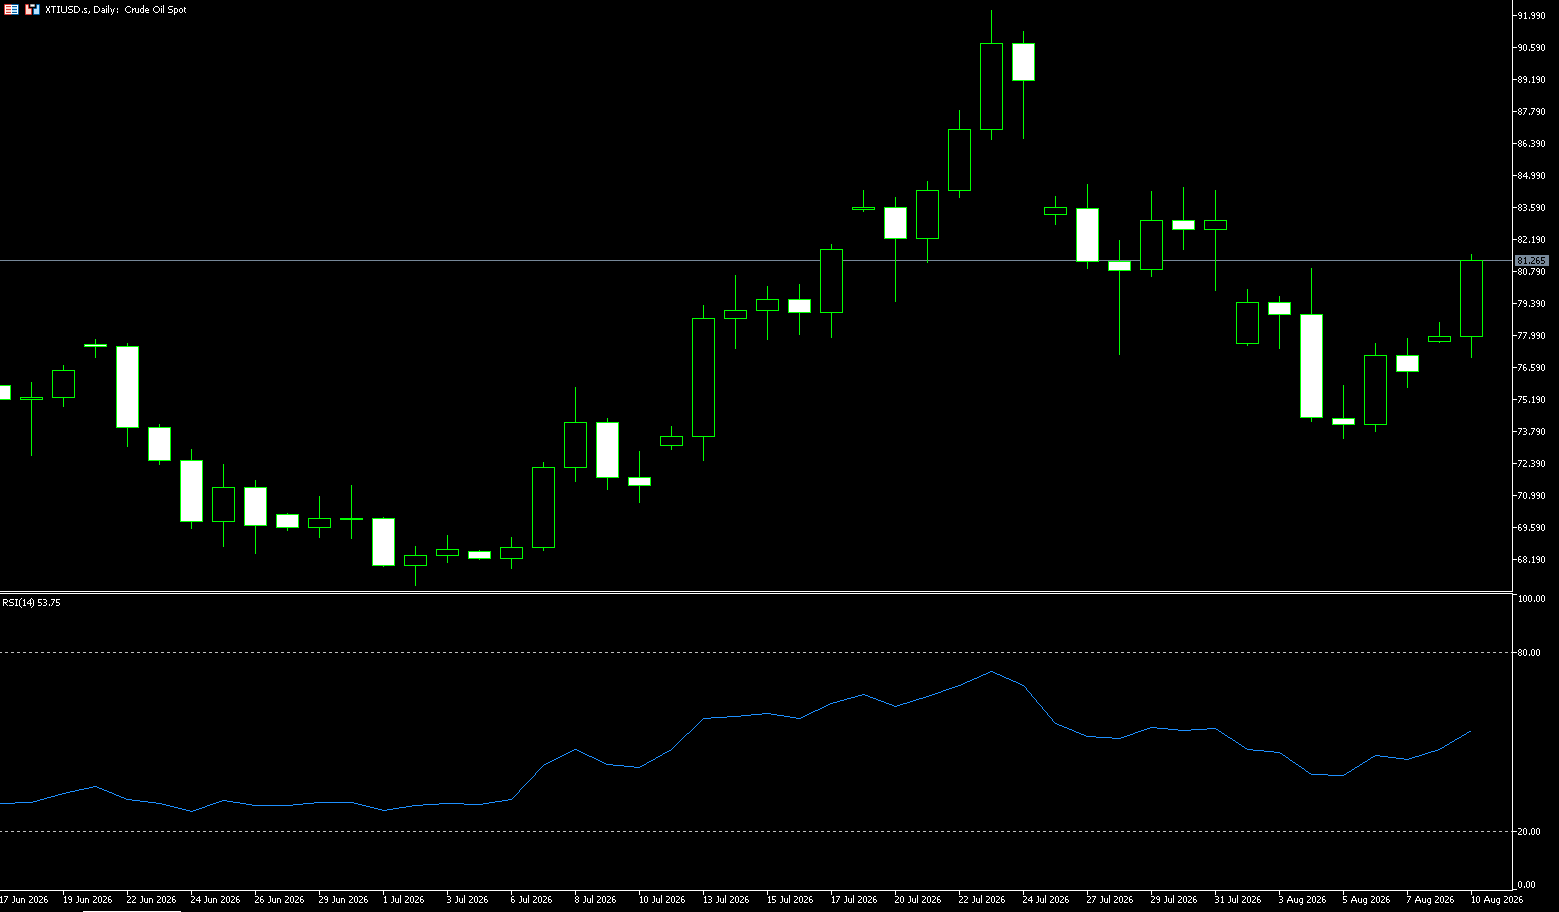
Crude oil prices rose above $81 a barrel on Monday, marking a third consecutive day of gains and reaching a one-week high, as uncertainty surrounding an agreement between the US and Iran to end the war and reopen the Strait of Hormuz intensified. US President Trump lashed out at Iran's war reparations demands in negotiations. Tehran stated that the US must lift the blockade before agreeing to a full reopening of the Strait of Hormuz. Trump also indicated on Sunday that he was prepared to allow increased economic pressure on Iran rather than launching new military strikes. Elsewhere, the Houthis claimed responsibility for the attack on Saudi Arabia's Jazan oil refinery, while an oil tanker operated by Abu Dhabi National Oil Company was attacked in the Strait of Hormuz. Meanwhile, crude oil inventories in the US Strategic Petroleum Reserve have fallen below 300 million barrels, the lowest level since 1983, as the conflict continues.
Last week, international oil prices fell sharply amid a tug-of-war between expectations of easing tensions in the Middle East and the risk of renewed conflict. US crude oil fell more than 10% for the week. From Tuesday's plunge to Thursday's rebound, the price movement clearly reflected every subtle change in the progress of the negotiations. Looking ahead, the final outcome of the negotiations regarding the Strait of Hormuz will continue to dominate oil price direction. If an agreement is implemented and brings about a substantial recovery in shipping, the supply disruption risk premium is expected to further decline, potentially putting downward pressure on oil prices. Conversely, if negotiations stall or regional conflicts escalate again, including risks such as Houthi attacks and Iranian legislation restricting certain activities, oil prices will quickly rise. Support lies around the 200-day moving average at $75.54, serving as a short-term dividing line between bullish and bearish sentiment; the next level is $72.53 (the low of July 13th). On the upside, watch $85.11 (the high of July 31st) and the psychological level of $86.00.
Today, consider going long on crude oil at 81.30, with a stop loss at 81.10 and targets at 84.00 and 85.00.
Spot Gold
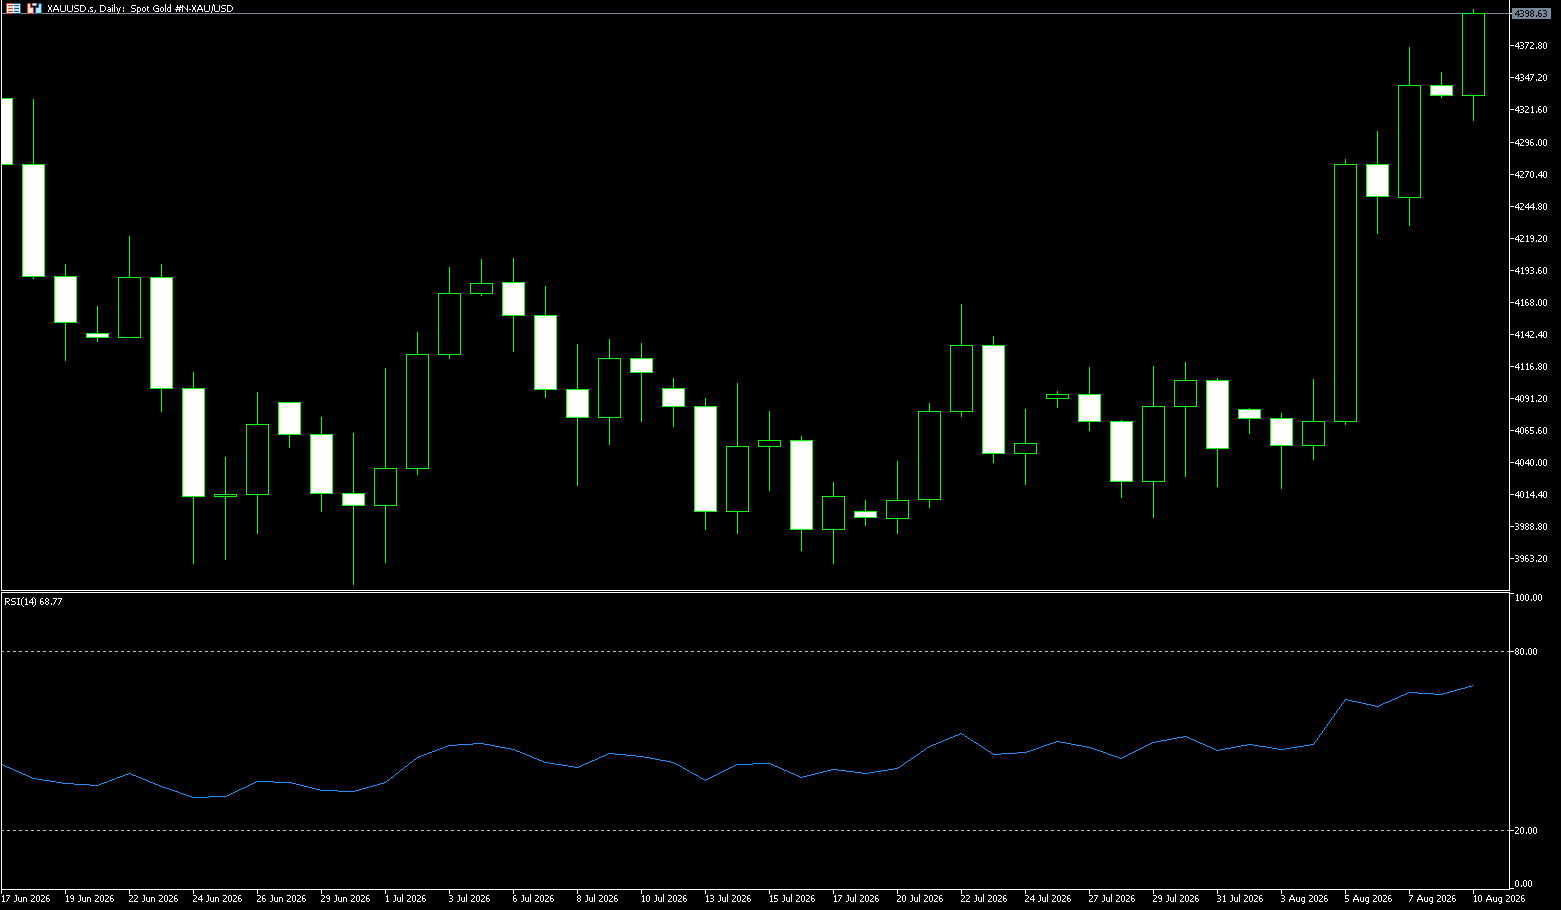
In early Asian trading on August 10, spot gold was trading around $4,380 per ounce. Unexpectedly weak US non-farm payroll data for July dampened expectations of a Fed rate hike, boosting gold prices. Gold prices surged 2.37% last Friday, with spot gold hitting a seven-week high of $4,400 per ounce. Before that, it had risen more than 3% intraday to its highest level since June 17, with a cumulative weekly gain of over 7%, marking the largest weekly gain since January 19. The unexpectedly weak US July non-farm payroll data (a loss of 23,000 jobs, far below the expected increase of 80,000, and a downward revision of the previous figure) dampened market expectations of a rate hike. The interest rate futures market reacted quickly to the strong employment data. The probability of a Fed rate hike in September plummeted from 57% before the report to 44%, while the probability of keeping rates unchanged rose from 43.2% to 56%. The 10-year Treasury yield also fell 2 basis points to 4.649%. The US dollar index weakened in tandem, falling 0.36% to 99.59, marking its second consecutive week of decline. The weakening dollar and declining real interest rate expectations directly opened up upward potential for gold.
The Relative Strength Index (RSI) on the daily chart rose to 65.31, its highest level since late January, and gold prices broke through the downtrend line drawn since early March, indicating that bullish momentum is accumulating. On the upside, the 100-day simple moving average at $4,390, together with the $4,495-$4,510 range (the 200-day simple moving average and the 38.2% Fibonacci retracement of the March-August downtrend), forms the next important resistance level. If gold prices can break through this resistance area, the continued strengthening of technical buying pressure could pave the way for a further rise to $4,680 (50% Fibonacci retracement). On the downside, immediate support lies at $4,300 (23.6% Fibonacci retracement), followed by $4,250 (65-day simple moving average) and $4,200 (psychological level). Further declines could lead to more losses.
Consider going long on gold today at $4,384, with a stop loss at $4,380; targets: $4,445; $4,450.
AUD/USD
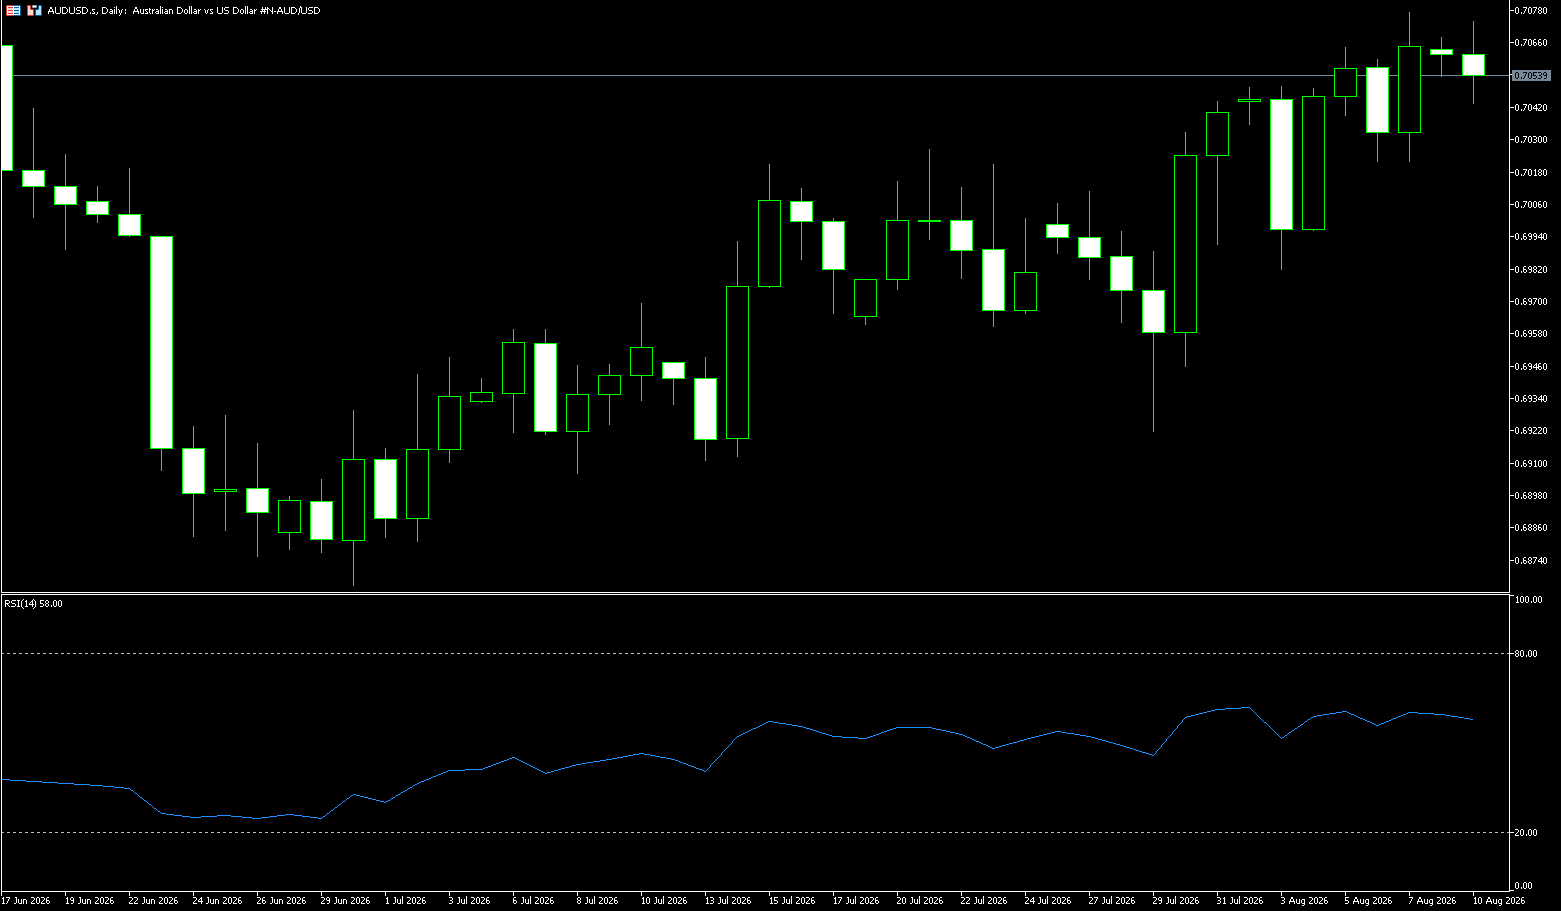
The Australian dollar remained above US$0.7050, near an eight-week high, as investors awaited the Reserve Bank of Australia's monetary policy decision on Tuesday. Markets widely expect the Reserve Bank of Australia (RBA) to keep the cash rate unchanged at 4.35% for the second consecutive meeting, despite policymakers' anticipated hawkish stance due to persistently high inflation. The market anticipates a roughly 50% probability of a 25 basis point rate hike by year-end, and traders will closely watch the RBA's latest forecasts and Governor Michelle Bullock's comments for clues about the future policy path. Elsewhere, the US dollar weakened against major currencies as a surprise drop in US jobs in July reduced market expectations for a Federal Reserve rate hike. The Australian dollar is also poised to rebound to a 35-year high against the Japanese yen as the impact of Tokyo's currency intervention diminishes and the RBA's hawkish stance strengthens the exchange rate.
On the daily chart, AUD/USD is trading around 0.7060, maintaining a mildly bullish short-term bias as it holds above the 20-day simple moving average at 0.7006 and the psychological level of 0.7000; initial resistance lies at the Bollinger Band at 0.7070. The Relative Strength Index (RSI) for the 14-day period is around 59.76, indicating constructive but not excessive momentum; the Average Directional Index (14) is close to 13, suggesting a relatively weak underlying trend, reinforcing the view of a gradual upward trend rather than a sharp rise. On the upside, immediate resistance is at the Bollinger Band at 0.7070, followed by horizontal resistance at the 0.7100 level; a sustained break above this range would target the higher resistance zone around 0.7180 (the high of June 3rd), followed by the more distant psychological resistance level of 0.7200. On the downside, initial support appears at 0.7000 (a psychological level), while the 200-day simple moving average at 0.6925 remains a key area.
Today, consider going long on the Australian dollar at 0.7040, with a stop loss at 0.7030 and targets at 0.7100 and 0.7090.
GBP/USD
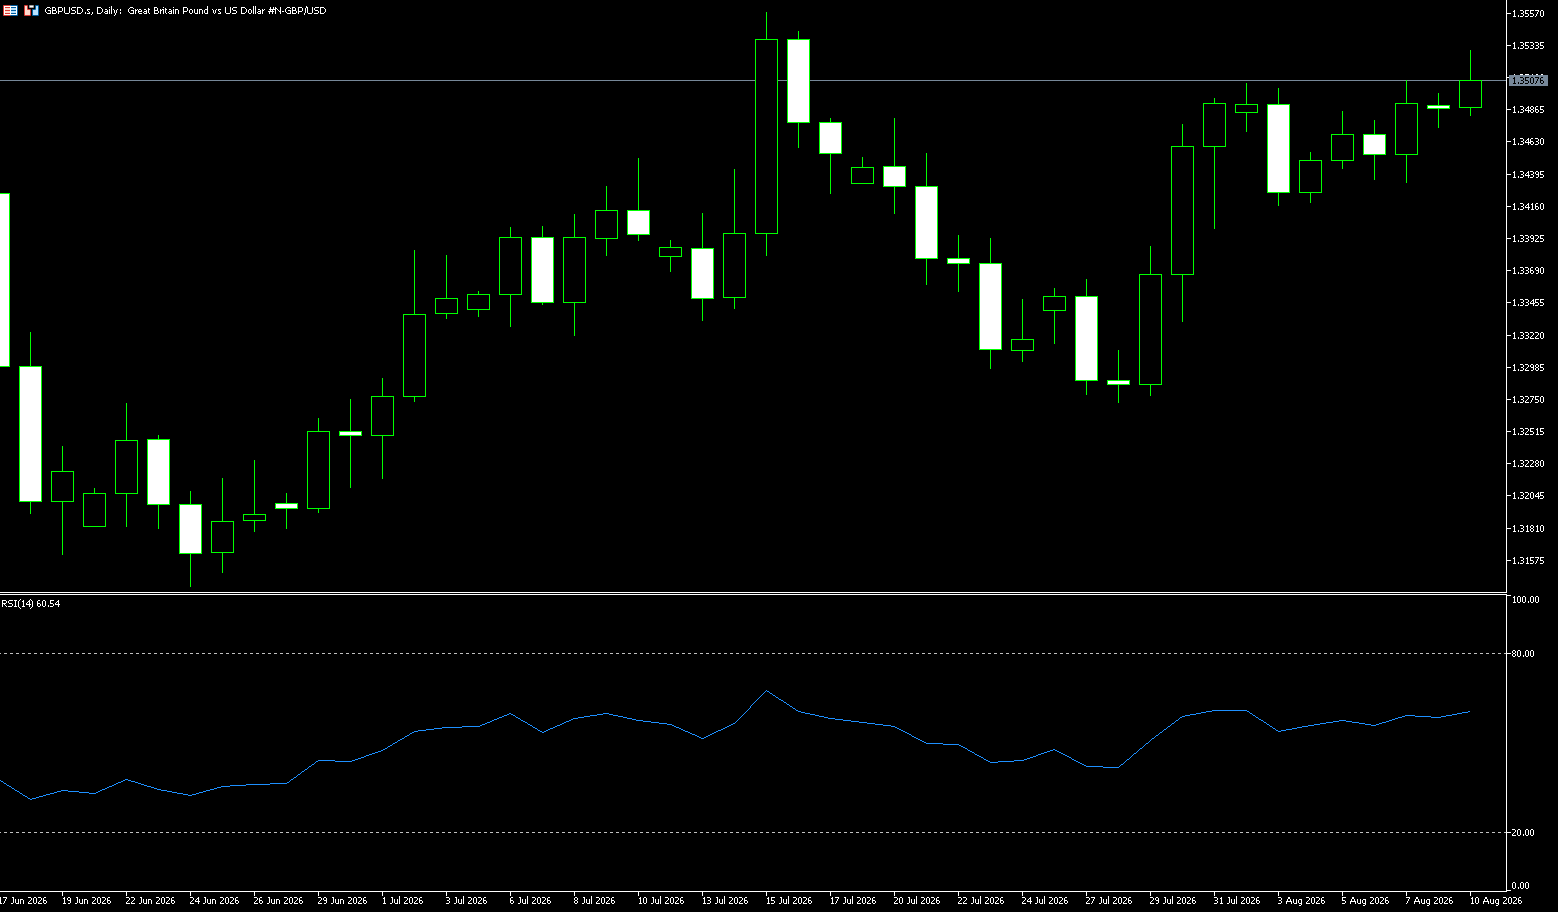
The pound sterling saw a slight pullback against the dollar in Asian trading on Monday, gradually moving away from the three-week high reached last Friday, above the psychological level of 1.3500. Although the dollar has recently rebounded from its post-nonfarm payroll data lows, declining expectations of a Fed rate hike have limited further upside for the dollar, keeping the pound relatively strong against the dollar. Investors are currently awaiting the latest US inflation data to further assess the Fed's future policy path. If inflation continues to decline, the market may further lower its expectations for rate hikes, putting pressure on the dollar and potentially pushing the pound sterling higher against the dollar. However, if rising energy prices lead to renewed inflationary pressures, the likelihood of the Fed maintaining a tightening stance increases, potentially providing new support for the dollar. In the UK, the market will focus on the upcoming preliminary second-quarter GDP data. This data will be a crucial indicator of the UK economy's resilience and could influence expectations for the Bank of England's future policy. Stronger-than-expected economic performance could support the pound; weaker growth could weaken the recent upward momentum.
Currently, the fundamentals for the pound sterling against the dollar remain mixed. On the one hand, weak US employment data reduces the dollar's interest rate advantage, providing room for the pound to rise; on the other hand, geopolitical risks, energy prices, and US inflation trends may still limit further gains for the pound against the dollar. In the short term, the market is more inclined to wait for new economic data to confirm direction rather than follow a one-sided trend. From a daily chart perspective, the pound against the dollar previously rebounded from around 1.3273 (the low of July 28th) to 1.3509, and the upward trend remains intact, with the exchange rate holding above the major moving average system. After recent gains, the pound against the dollar has entered a consolidation phase. Short-term technical indicators show that upward momentum has slowed, but no clear reversal signal has yet formed. If the price holds above the 1.3400 area, the upside resistance should be watched at the 1.3500 (psychological level) to 1.3509 (last week's high) area. A successful break above this level could lead to a further test of the 1.3600 area; support lies at 1.3400 and 1.3300. From a daily chart perspective, the bulls still hold a certain advantage, but the risk of high-level consolidation is increasing. Future price movements will largely depend on US CPI data, UK GDP performance, and changes in the US dollar index.
Consider going long on GBP/USD today at 1.3495, with a stop-loss at 1.3483 and targets at 1.3550 and 1.3560.
USD/JPY
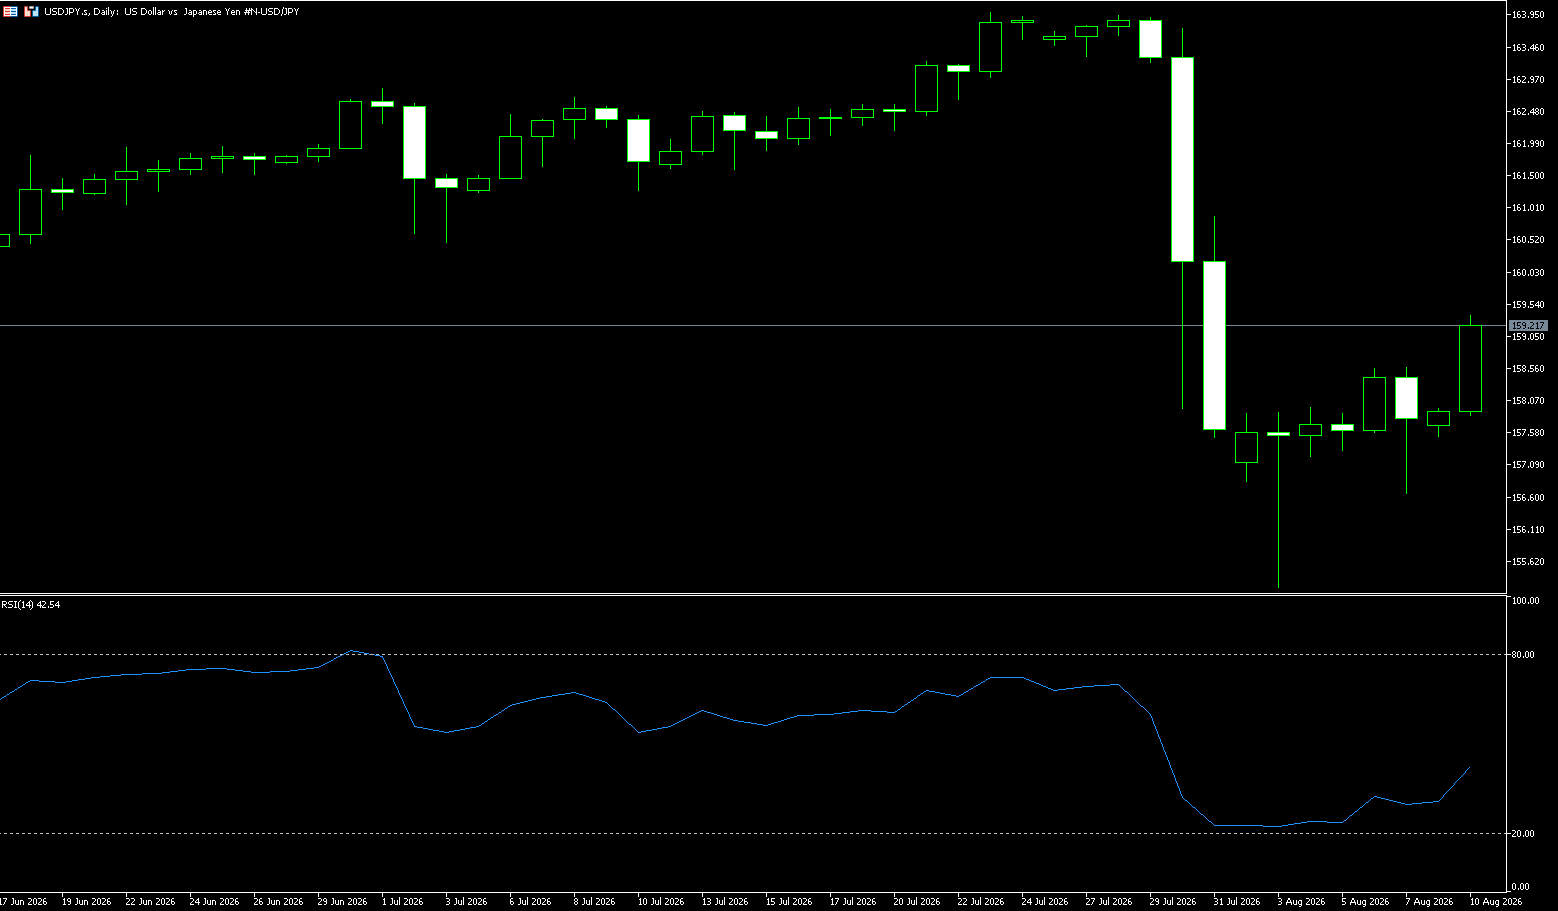
The yen fell below 159 per dollar on Monday, reversing gains from the previous session, as recent coordinated intervention by Tokyo and Washington failed to sustain its rebound under persistent structural pressures. The yen remains pressured by interest rate differentials, growing fiscal concerns, and high energy and import costs. Latest data showed Japan's current account surplus narrowed in June, with strong exports of AI-related electronics offset by higher imports driven by increased crude oil purchases. Meanwhile, the Bank of Japan highlighted the risk of accelerating inflation in its July meeting summary, with one board member suggesting a potentially faster pace of interest rate hikes. The yen strengthened sharply against the dollar on Friday as weaker-than-expected US jobs data prompted traders to lower their expectations for a near-term Fed rate hike.
From a daily chart perspective, the USD/JPY pair is currently maintaining a high-level consolidation with a slight upward bias. The exchange rate is trading above major moving averages, indicating that bulls still hold the initiative in the short term. The MACD indicator shows that the previous rapid decline is still dragging down the trend indicators. Going forward, it's crucial to observe whether three variables re-establish a stable relationship: the USD/JPY short-term interest rate differential, exchange rate volatility, and speculative positions. Currently, the upside resistance level to watch is the 15950-160.00 (psychological resistance) area. A break above this area could lead to a further test of the 162.00 level. Support is seen at the 157.00 level. A break below 157.00 could lead to a pullback to around 156.40 (around 250) for support. Future price movements will be heavily influenced by US CPI data, changes in the US dollar index, and subsequent policy statements from the Bank of Japan.
Today, consider shorting the US dollar at 159.45, with a stop-loss at 159.60 and targets at 158.10 and 158.00.
EUR/USD
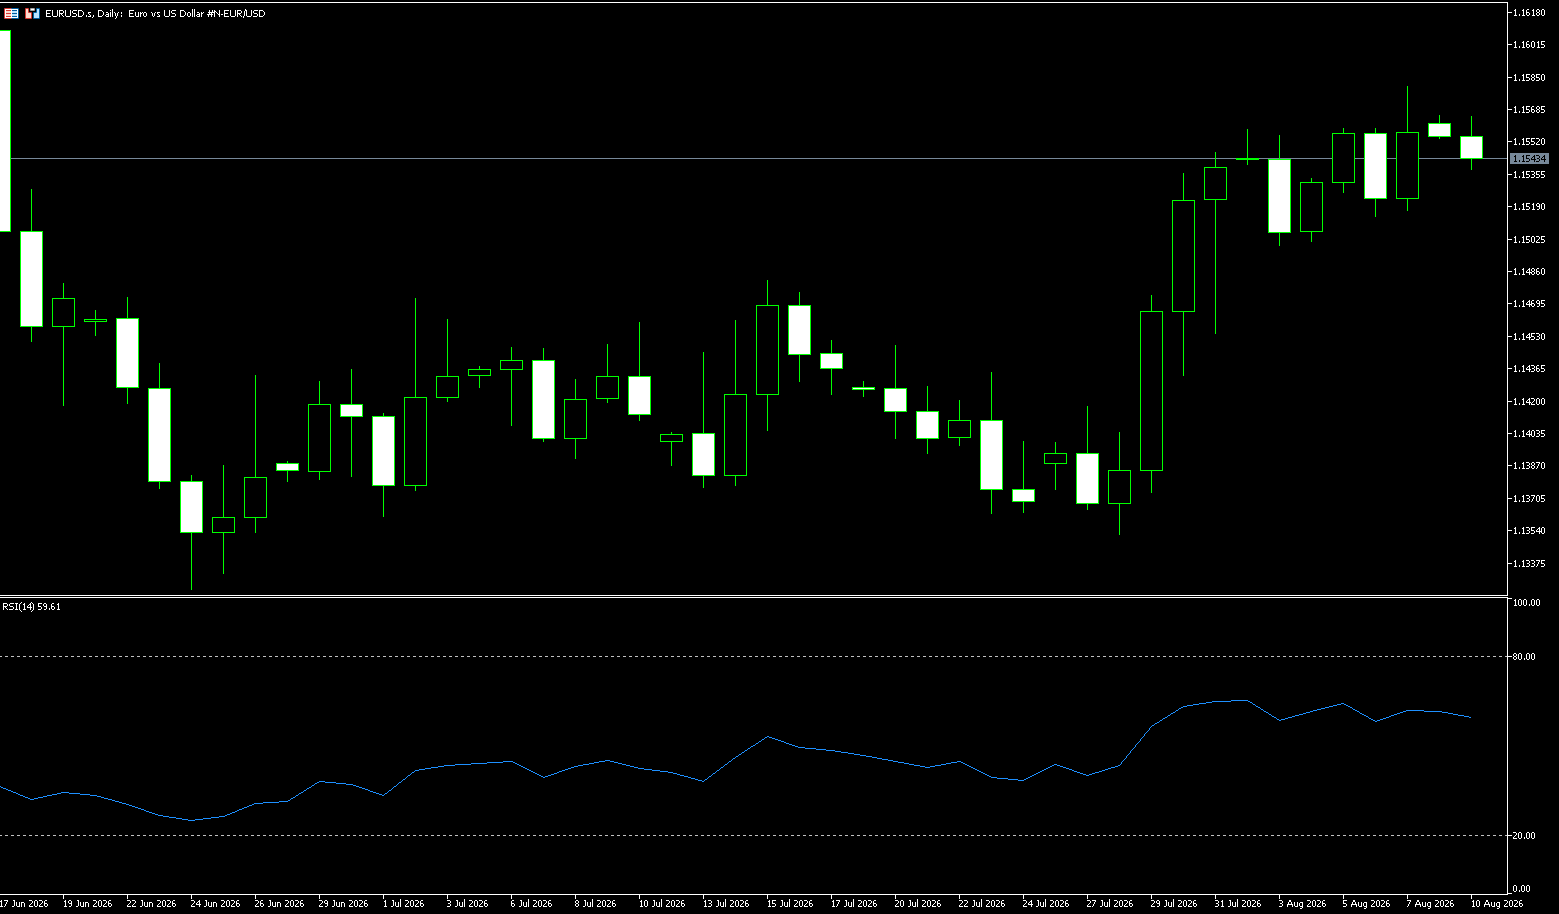
The euro appreciated above $1.1580 last week, reaching its highest level since June 16, as the dollar weakened sharply following a disappointing US jobs report, reducing expectations for further Fed rate hikes. Meanwhile, falling oil prices strengthened market expectations that inflationary pressures in the Eurozone would continue to ease. Investors are also watching developments in the Strait of Hormuz, where President Trump stated that negotiations between Iran and Oman were "going well," although no agreement had been reached. An agreement to manage this strategic waterway is seen as key to restoring energy flows, which remain below pre-war levels amid ongoing regional tensions. Reopening the strait could also pave the way for broader negotiations aimed at ending the conflict. Against this backdrop, the European Central Bank kept interest rates unchanged in July, after raising its benchmark rate by 25 basis points in June, its first rate hike in three years.
The euro retreated slightly against the dollar on Monday, mainly pressured by a technical rebound in the dollar. However, a significant cooling of market expectations for a September rate hike by the Federal Reserve provided support for the euro. The short-term direction depends entirely on Wednesday's US CPI data: if inflation cools, the euro could move towards the 1.1620 target; if inflation remains stubborn, it could trigger a dollar rebound, causing the euro to retreat below 1.1500. Technically, the euro/dollar is currently still in a short-term uptrend: key support levels: 1.1500 (psychological level and recent low area) - 50-day moving average 1.1470; short-term resistance levels: 1.1580-1.1600; a break above this area would target 1.1620 (near the monthly high). On the downside, if the dollar rebounds sharply due to better-than-expected CPI data, the exchange rate may test the 1.1500 support, and a break below could lead to further declines towards the 1.1450 area. However, before the CPI data release, the exchange rate is expected to maintain a slightly bullish consolidation pattern.
Today, consider going long on the Euro at 1.1530, with a stop-loss at 1.1520 and targets at 1.1570 and 1.1580.
Stock Analysis:
Australian ASX 200 Stock Index
Basic Market Overview:
The Australian Securities Exchange (ASX) 200 index fell 31 points, or 0.3%, to close at 9,233 on Monday, marking its second consecutive day of weakness, pressured by declines in financials, consumer durables, and industrial services. Market sentiment remained cautious ahead of the Reserve Bank of Australia's monetary policy decision. While the market expects the cash rate to remain at 4.35% after three rate hikes, inflation risks persist amid geopolitical uncertainty. Westpac shares plunged 5.4% after forecasting a halving of investor housing credit growth and a 20% drop in mortgage applications next year, severely impacting financial stocks, with quarterly cash earnings falling to A$1.8 billion.
Peers ANZ, Commonwealth Bank, and National Australia Bank also fell by about 2%. Nevertheless, mining stocks provided some offsetting losses, supported by strong metal prices, with BHP Billiton rising 1.2% and Rio Tinto gaining 0.6%. Meanwhile, shares of Treasury Wine Estates surged 4.8% after announcing plans to reduce its North Coast wine production and write down bulk wine inventories starting in 2026.
Sector Performance:
Leading Sectors
1. Healthcare +1.30%: The strongest sector overall, with medical device and biotech stocks performing strongly. Cochlear and ResMed-related stocks showed outstanding performance, with significant defensive capital inflows.
2. Materials (Mining) +0.90%: Supported by metal prices, BHP Group +1.2% and Rio Tinto +0.6%; lithium and gold mining companies also rose.
3. Communication Services: Slightly higher, benefiting from market risk aversion due to its defensive attributes.
Representative Strong Stocks: BHP Group, Northern Star Resources, Evolution Mining, Cochlear
Leading Sectors
1. Financials -2.10%: The biggest drag on the sector. Westpac plunged 5.4%, warning of a sharp decline in mortgage applications; the other three major banks generally fell by around 2%; insurance stocks also weakened.
2. Consumer Discretionary: Following the broader market weakness, weak consumer confidence weighed on the sector.
3. Commercial & Industrial Services: Profit-taking led to a general pullback in the sector.
Technical Analysis:
The ASX200 closed at 9233 points on Monday, down 31 points, or -0.30%, marking its second consecutive day of decline. The market is currently consolidating at high levels and retreating, with a cautious sentiment prevailing as the market awaits the Reserve Bank of Australia's (RBA) policy decision. Bank earnings reports revealed real estate credit risks, suppressing the heavyweight financial sector; the resource sector offset some of the decline; the market is awaiting RBA policy decisions and is also influenced by iron ore and overnight performance in US stocks. Technical Analysis: The index is currently in a high-level range-bound trading pattern, with upward momentum clearly weakening. The RSI has retreated from its high level but has not yet entered oversold territory. The medium-term moving averages remain upward, maintaining a generally bullish trend, but short-term pullback pressure is increasing. The market is highly dependent on the RBA decision and commodity price performance, lacking a clear directional trend.
Tuesday's RBA interest rate decision is a high-risk event, with volatility expected to amplify sharply during the announcement and press conference. For those with low risk tolerance, it is recommended to avoid opening positions during the data window and wait for the market direction to become clearer before participating.
Trading Strategy:
Trading Strategy (Short-Term Trading Perspective)
Long Position Option
1. If a pullback to the 9180-9200 range shows a bottoming candlestick pattern, a small long position can be initiated; the stop-loss should be placed below 9140; the first target is 9280, with a break above targeting 9320.
2. If the price directly and firmly establishes itself above 9320, follow the trend with a long position, a stop-loss at 9270, aiming for a new high. Short Selling Strategy
1. If the price breaks below 9180 and closes below that level, consider a small short position; stop loss above 9235; first target 9120, further down to 9060.
2. If the price rebounds to the 9280-9300 range and encounters resistance, consider a pullback; stop loss at 9330.
Key Risk Warnings:
Monetary Policy Risk: The market consensus is for the interest rate to remain unchanged at 4.35%, but a hawkish stance from the RBA would directly pressure the stock market; inflation stickiness remains, and there is a possibility of unexpected changes.
Sector Risk: The financial sector accounts for approximately 33% of the index; weaker-than-expected bank profits and housing credit data will continue to drag down the index; the mining sector is highly correlated with iron ore, copper prices, and domestic demand, and commodity price fluctuations will rapidly influence the index's movements.
External Impact Risk: The overnight closing performance of US stocks, the Australian dollar exchange rate, and fluctuations in the US dollar index will directly affect Tuesday's opening and intraday price movements.
Japan's Stock Market Index (JP225)
Basic Market Overview:
The Nikkei 225 index rose 2.08% to close at 66,970 points, while the broader Topix index gained 0.63% to 4,101 points. Japanese stocks reached multi-week highs on Monday, driven by gains on Wall Street after weaker-than-expected U.S. jobs data reduced market expectations for a near-term Federal Reserve rate hike. Investors were also focused on the Middle East situation, with Iran denying direct negotiations with the U.S. despite Washington's claims of a close deal. Domestic data showed Japan's current account surplus narrowed in June, as strong exports of AI-related electronics were offset by increased imports due to increased crude oil purchases.
Chipmakers and AI-related stocks led the gains, with Fujikura (7.6%), Furukawa Electric (2.5%), Advantest (6.4%), Ibiden (4%), and Tokyo Electron (4.1%) all showing significant increases. Consumer stocks performed well, while financial stocks declined.
Sector Performance:
Leading Sectors
1. Semiconductors/Chip Equipment (AI Hardware): The strongest sector, driven by the US AI sector.
• Tokyo Electron +4.13%; Advantest +6.43%; Ibiden +4.03%
2. Fiber Optic Communication Components
• Fujikura +7.62% (upgraded full-year results)
3. Human Resources Services (better-than-expected results)
• Recruit +22.79%, hitting the daily limit
4. Non-Ferrous Metals/Mining
• Sumitomo Metal Mining +12.73%
Leading Sectors
1. Japanese Banks and Financials (Bank of Japan signaled a September rate hike, suppressing short-term bank stock performance)
• Sumitomo Mitsui Financial and Mitsubishi UFJ Financial Group weakened slightly, with declines of approximately -1% to -2.2%.
2. Some Consumer Retail
• Fast Retailing (Uniqlo) -0.74%; Keyence slightly declined.
3. Some traditional automotive stocks dragged down the index slightly, with most auto stocks showing mixed performance but no significant sell-offs.
Technical Analysis:
The Nikkei 225 closed at 66,970.22 points, up 2.08%, or 1363.51 points, with a high of 67,006.84 and a low of 65,848.58, forming a large bullish candlestick and reaching a near four-week high. Drivers: Weaker-than-expected US non-farm payrolls led to a downward revision of market expectations for a Fed rate hike, and overnight gains in US stocks boosted Japanese stocks; the AI/semiconductor chip sector was the core driver; geopolitical tensions in the Middle East limited further upside potential; Japan entered the Obon holiday, resulting in reduced market liquidity. Daily Chart: The large bullish candlestick broke upwards, indicating a short-term bullish trend, but the direct surge to the previous resistance zone suggests a possible pullback and high-level consolidation; reduced liquidity during the Obon holiday could amplify volatility.
RSI: Entering a high-level range, there is a risk of overbought pullback; if it cannot continue to rise with increased volume, a pullback to confirm support is likely. External linkages: Highly correlated with overnight US stock market performance and the USD/JPY exchange rate. Rapid appreciation of the yen will suppress export-heavy stocks and drag down the index.
Tuesday's trading scenario prediction: Optimistic: Hold the 66000 support level and test the 67300-67800 resistance level; Neutral: Consolidate gains in the 66000-67300 range; Pessimistic: Fall below 65800 and pull back to the 65200 support level, marking the end of the rebound phase.
Trading Strategy:
Short-term trading strategy (Tuesday)
1. Bullish approach:
◦ If it pulls back to the 65800-66000 support level and stabilizes, consider going long; place a stop loss below 65200; first target 67300, second target 67800.
◦ It is not recommended to chase the price higher directly in the 67300-67800 resistance zone.
2. Short-selling strategy:
◦ If a price surges to the 67300-67800 range and shows clear signs of stagnation and a long upper shadow, a short position can be attempted; place a stop-loss above 68050; the initial target is 66000, with a further target of 65200.
3. Observation: If the market fluctuates wildly after the opening and lacks a clear direction, given the weak liquidity during the Obon festival, it is advisable to observe and wait for a directional move, reducing frequent trading.
Key Risk Warnings:
Exchange Rate Risk: Significant fluctuations in the USD/JPY exchange rate; a rapid appreciation of the yen will suppress the profits of Japanese export companies, directly dragging down the JP225 index.
External Markets: A sharp correction in the US technology sector will directly impact the Nikkei; fluctuating US inflation and employment data, and the Fed's expectation of a renewed shift towards interest rate hikes, will suppress risk assets.
Geopolitical Risk: Escalating tensions in the Middle East will push up oil prices and exacerbate global risk aversion.
Disclaimer: The information contained herein (1) is proprietary to BCR and/or its content providers; (2) may not be copied or distributed; (3) is not warranted to be accurate, complete or timely; and, (4) does not constitute advice or a recommendation by BCR or its content providers in respect of the investment in financial instruments. Neither BCR or its content providers are responsible for any damages or losses arising from any use of this information. Past performance is no guarantee of future results.
More Coverage





Risk Disclosure:Derivatives are traded over-the-counter on margin, which means they carry a high level of risk and there is a possibility you could lose all of your investment. These products are not suitable for all investors. Please ensure you fully understand the risks and carefully consider your financial situation and trading experience before trading. Seek independent financial advice if necessary before opening an account with BCR.
BCR Co Pty Ltd (Company No. 1975046) is a company incorporated under the laws of the British Virgin Islands, with its registered office at Trident Chambers, Wickham’s Cay 1, Road Town, Tortola, British Virgin Islands, and is licensed and regulated by the British Virgin Islands Financial Services Commission under License No. SIBA/L/19/1122.
Open Bridge Limited (Company No. 16701394) is a company incorporated under the Companies Act 2006 and registered in England and Wales, with its registered address at Kemp House, 160 City Road, London, England, EC1V 2NX. Open Bridge Limited acts solely as a payment processor for BCR Co Pty Ltd and does not provide any financial, trading, or investment services on its behalf. Open Bridge Limited's role is limited to payment processing.


 English
 简体中文
简体中文
 繁體中文
繁體中文
 Bahasa
Melayu
Bahasa
Melayu
 Tiếng
Việt
Tiếng
Việt
 ไทย
ไทย
 日本語
日本語
 한국어
한국어
 ភាសាខ្មែរ
 español